


First Nations (FN) peoples are the original inhabitants of Canada. Today, FN represent 60·8 % of the total Indigenous population and 2·6 % of the total Canadian population. More than half (53 %) of FN live on reserve or in communities, while the others (47 %) live off reserve( 1 ). There are 634 unique FN communities in Canada (www.afn.ca), one-third of which (n 203) are in the province of British Columbia (BC; www.bcafn.ca).
Significant health disparities exist between FN and non-indigenous Canadians( Reference Reading and Wein 2 , Reference Adelson 3 ). FN people continue to experience shorter life expectancy and higher rates of mortality and chronic conditions including obesity, type 2 diabetes and CVD( 4 ). In BC, the general population has the lowest prevalence of chronic diseases among the Canadian provinces( Reference Pelletier, Dai and Roberts 5 , Reference Fang, Kmetic and McCarney 6 ); however, FN in BC experience poorer health status and a greater burden from chronic conditions compared with the general population in BC( 7 ). Recent statistics show some improvements, including a slowdown in the diabetes prevalence rate lately( 8 , 9 ). However, the rates of CVD tend to increase( 7 ) and remain a leading cause of death in FN adults in BC( 10 ).
The traditional food systems of Indigenous peoples in Canada are diverse across twelve terrestrial and marine ecozones (www.ecozones.ca) and include a large variety of game, fish, birds, berries, and other plant and tree foods. An ecozone is a large geographical region identified based on the distribution patterns of plants, animals, geographical characteristics and climate (www.ecozone.ca). Culture area is a concept to identify geographic areas within which Indigenous communities share a greater number of traits/cultural affinities compared with those from outside the area( Reference Chan, Receveur and Sharp 11 ). Over millennia, FN have developed many resource management and food production technologies, including hunting, trapping, foraging and intensive food production (clam gardens, estuarine root beds, berry patches, crab-apple orchards, species domestication including sunflower, corn, beans and squash)( Reference Saier and Trevors 12 ). Traditional foods are a significant contributor of energy, essential vitamins, minerals and PUFA, are low in saturated fat and carbohydrates( Reference Gagne, Blanchet and Lauzie 13 – Reference Sheehy, Kolahdooz and Schaefer 15 ) and continue to have important social, health and cultural benefits( 16 ).
Among FN in BC, particularly in coastal communities, there has always been a far greater reliance on a wide variety of marine foods, which are rich in high-quality protein and several key minerals and vitamins. Furthermore, fish is a major source of the essential n-3 fatty acids, EPA and DHA( Reference Kuhnlein, Receveur and Soueida 17 ), which are involved in neurological development, cell membrane function, immune function and inflammatory response( Reference Yashodhara, Umakanth and Pappachan 18 ). There is strong evidence of numerous beneficial health effects of n-3 fatty acids, including improvement of cardiovascular health( Reference De Caterina 19 – Reference Leung Yinko, Stark and Thanassoulis 21 ), reducing mortality from cardiac causes( Reference Wen, Dai and Gao 22 ) and favourable effects on blood pressure, inflammation and lipid profile( Reference Panagiotakos, Zeimbekis and Boutziouka 23 ). Among Indigenous peoples, a lower prevalence of metabolic and cardiovascular diseases has been attributed to high consumption of traditional foods rich in n-3 fatty acids( Reference Bruce, Riediger and Lix 24 – Reference Jorgensen, Bjeregaard and Borch-Johnsen 26 ).
Notwithstanding the benefits of traditional foods, including fish, recent research indicates that FN have been undergoing a nutrition transition characterized by lower consumption of traditional nutrient-dense foods and increased consumption of store-bought foods which are high in energy, fat and sugar( Reference Kuhnlein, Receveur and Soueida 17 , Reference Sheehy, Roache and Sharma 27 , Reference Willows 28 ). This nutrition transition is concomitant with changing lifestyle practices including the decline in physical activity. The nutrition and lifestyle transitions are driven by various factors preventing FN from using traditional foods, including, but not limited to, government restrictions, decreased harvesting areas, decline in the abundance and types of traditional food species due to ongoing land privatization, habitat loss and climate change, as well as household poverty( Reference Chan, Receveur and Sharp 11 , Reference Kuhnlein, Fediuk and Charles 29 ). Additionally, human impacts on local ecosystems have resulted in widespread concern about the risk of exposure to contaminants( Reference Laird, Goncharov and Egeland 30 , Reference Kuhnlein and Chan 31 ) such as polychlorinated biphenyls (PCB), dichlorodiphenyldichloroethylene (DDE) and heavy metals like methylmercury (MeHg), which can have impacts on neurological development, immune and endocrine functions( Reference Ross 32 – Reference Ha, Basu and Bose-O’Reilly 34 ).
Considering the benefits of traditional foods and their potential role in promoting better cardiovascular health, and in view of the health problems experienced by FN, the objective of the present study was to describe seafood consumption patterns in FN living in eight BC ecozones and to examine dietary and lifestyle characteristics associated with seafood consumption. In addition, we identified the top ten most consumed seafood species, their contribution to EPA+DHA intake and dietary exposure to PCB, DDE and MeHg. Finally, we estimated the percentage of participants who met dietary EPA+DHA recommendations from total seafood consumption.
Methodology
Study population
The First Nations Food Nutrition and Environment Study (FNFNES) is a 10-year cross-sectional study (2008–2018) designed to assess the quality of the total diet combining traditional foods and market foods and to provide a national baseline of background levels of environmental contaminants of concern in FN adults living on reserves south of the 60th parallel across Canada (www.fnfnes.ca). In the current study, data collected from FN in BC were used( Reference Chan, Receveur and Sharp 11 ). FN communities were sampled using a combined ecozone/cultural area framework to ensure that the diversity in ecozones and cultural areas was represented in the sampling strategy( Reference Chan, Receveur and Sharp 11 ). Estimation weights were calculated to obtain representative estimates of the total FN population. The design weight was adjusted based on the assumption that the responding communities represent both responding and non-responding communities.
The current study analysed data from twenty-one FN communities across eight BC ecozones: (i) Boreal Cordillera/Subarctic; (ii) Boreal Plains/Subarctic; (iii) Montane Cordillera/Plateau; (iv) Montane Cordillera/Subarctic; (v) Montane Cordillera/Subarctic/Northwest Coast; (vi) Pacific Maritime/Subarctic/Northwest Coast; (vii) Pacific Maritime/Plateau; and (viii) Taiga Plains (Fig. 1). In total, 1103 participants aged 19 years or above were recruited to the study in the autumn of 2008 and 2009. The overall participation rate was 68 %.
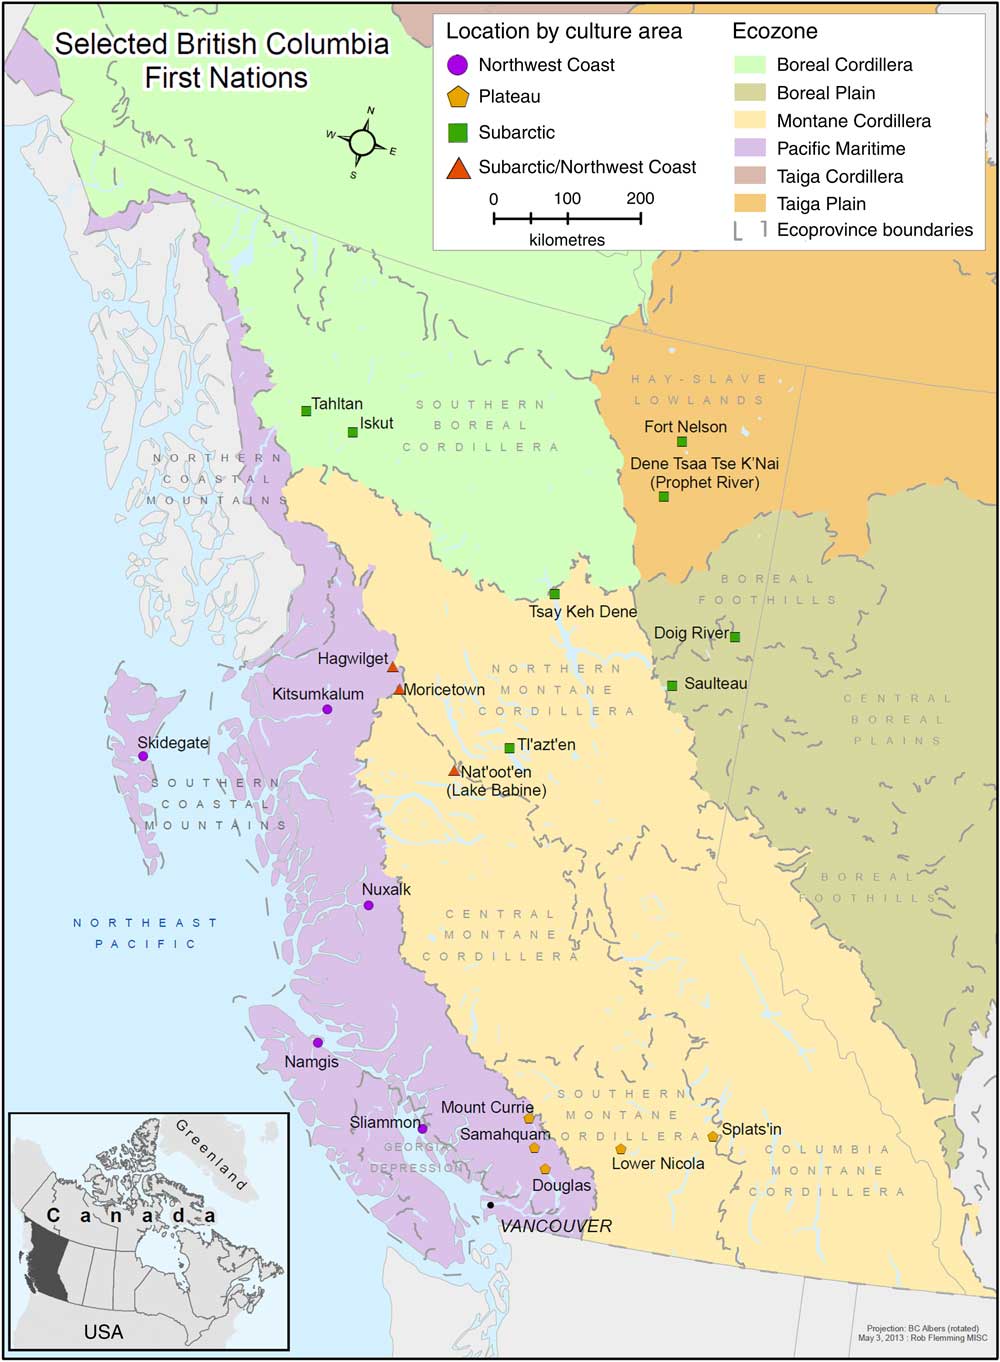
Fig. 1 (colour online) Map of twenty-one participating First Nations in British Columbia, Canada; First Nations Food Nutrition and Environment Study (FNFNES), 2008–2018( Reference Chan, Receveur and Sharp 11 )
Data collection
Household interviews were conducted by trained interviewers. Participants completed a series of questionnaires that collected information on diet (a 24 h diet recall and a traditional FFQ) and sociodemographic, health and lifestyle data (SHL questionnaire). The 24 h recall recorded all foods and beverages including their approximate quantities consumed the previous day using the multiple-pass technique with three stages( Reference Raper, Perloff and Ingwersen 35 ). The quantities consumed were estimated using three-dimensional food and beverage models. The FFQ was used to collect data on locally harvested traditional foods consumed during the four seasons in the past year; it included all identified traditional foods and was representative for each participating community. In total, the FFQ combined 208 traditional food items including sixty-five seafood items, twenty-three land mammals, twenty-six wild bird species, fifty-three wild berries, and wild nuts, plants, tree foods and mushrooms. Only the data on seafood consumption were used in the current analysis. For this purpose, the definition of seafood combined all fish species, shellfish, seaweed and sea mammals reported in the survey.
The SHL questionnaire collected information on age, gender, weight and height (measured or self-reported), physical activity level (sedentary, somewhat active, moderate, vigorous), dieting (to lose weight) on the previous day (yes/no), smoking status (yes/no), years of education, employment status (full-time, part-time, no job), source of income (wage, social assistance, worker’s compensation, pension), household size (number of people per household), self-perceived health status (excellent, very good, good, fair, poor) and traditional food-gathering activity (yes/no). BMI was calculated as weight (in kilograms) divided by the square of height (in metres). When available, both measured weight and height were used in the BMI calculation; otherwise, self-reported or a combination of self-reported and measured values were used.
Household food security status was assessed using the income-related Household Food Security Survey Module (HFSSM) developed by the US Department of Agriculture( Reference Bickel, Nord and Price 36 ) and further adapted for Aboriginal communities( Reference Lawn and Harvey 37 ). The module consisted of eighteen questions (ten adult-referenced items and additional eight child-referenced questions for households with children) asking about the ability of households to afford enough food. Households were considered ‘food secure’ when no items, or only one item in the adult or child scale, were/was affirmed. Households responding affirmatively to two and more questions were categorized as ‘food insecure’.
Estimation of seafood consumption, dietary methylmercury, polychlorinated biphenyls and dichlorodiphenyldichloroethylene intake, and EPA+DHA intake
The FFQ was used for estimation of seafood consumption and EPA+DHA intake. This was necessary as species consumption changes across seasons and there was a limited number of participants who consumed a specific seafood species on the day of the 24 h recall during the autumn data collection period. Usual frequency of intake of each seafood species was calculated from the FFQ. Each participant was asked to estimate his/her average portion size of each seafood species (grams per serving) in the 24 h recall with the aid of food models. Average portion size was calculated for each age and sex group. Daily intake of each seafood species (grams per day) was estimated by summing up the number of days in the past four seasons when a particular species was consumed, multiplied by the mean portion size (grams) and divided by 360 days. In the present study, a year included four seasons of ninety days each. Total seafood intake for each participant was estimated by summing up the amount of all seafood items consumed per day.
Given that seafood consumption data were derived from the FFQ whereas other dietary variables were estimated using the 24 h recall (since most of the market foods are eaten on a daily basis), a comparison was made between seafood intake (grams per day and percentage of consumers) collected from the FFQ and the 24 h recalls (see online supplementary material, Table S1).
Dietary PCB, DDE and MeHg intake for each participant (j) from each seafood species (i) was calculated by multiplying the amount of PCB, DDE and MeHg (nanograms) in one gram of each species by the total amount of each food items consumed per day (grams) and dividing the obtained amount by the body weight of each participant (nanograms per kilogram of body weight per day):
 $$\eqalignno{ & {\rm MeHg/PCB/DDE\,\,intake}_{{i,j}} {\equals}{\rm Food}\,{\rm intake}_{{i,j}} \left\,( {{\rm g/d}} \right)\,{\times} \cr & \quad \qquad {\rm MeHg}_{i} {\rm/PCB}_{i} {\rm/DDE}_{i} \left\,( {{\rm ng}} \right){\rm \,/\,body}\,{\rm weight}_{j} \left\,( {{\rm kg}} \right).$$
Total dietary PCB, DDE and MeHg intake was estimated by totalling the amount of each chemical from all fish species consumed per day.
The concentrations of EPA+DHA in seafood species were estimated from the Canadian Nutrient File, a national food composition database( 38 ), taking account of the preparation method (i.e. baked or broiled, boiled or raw). Daily EPA+DHA intake for each participant (j) was estimated by multiplying the amount of EPA+DHA (milligrams) in one gram of each food item (i) by the total amount of each food item consumed per day (grams):
 $${\rm EPA}{\plus}{\rm DHA}_{{i,j}} {\equals}{\rm Food}\,{\rm intake}_{{i,j}} \left\,( {{\rm g/d}} \right){\times}{\rm EPA}{\plus}{\rm DHA}_{i} \,\left( {{\rm mg/d}} \right).$$
The validation of dietary assessments was performed by comparing the estimated intake of MeHg from total traditional foods as well as from total fish consumption with MeHg in the hair sample of the participants. Both estimates of MeHg intake from foods were strongly correlated with MeHg in hair (Spearman r=0·54).
Seafood sampling for contaminant content
Seafood samples were collected based on input from communities, so that collected foods are representative of seafood species consumed by members in each community and those of the most concern from an environmental perspective. The seafood samples were collected during autumn 2008. Each fish sample was a composite of tissues from up to five different fish. The collected fish samples were analysed for several toxic chemicals, including MeHg, PCB and DDE, at Maxxam Analytics (formerly CANTEST), in Burnaby, BC, Canada. All fish samples were homogenized to provide a homogeneous sample for subsequent digestion. If required, a moisture value was determined gravimetrically after drying a portion of the blended sample at 105°C overnight.
Dichlorodiphenyldichloroethylene and polychlorinated biphenyls
Tissue (6 g) was homogenized in dichloromethane and filtered through anhydrous sodium sulfate. The extract was evaporated to 6 ml and 5 ml was injected onto the gel permeation chromatography column where a fraction of the eluent was collected, concentrated and solvent exchanged to acetone:hexane (1:1). Further clean-up was performed by eluting this extract through PSA (primary secondary amine) columns. The final extract was concentrated and solvent exchanged to isooctane. Analysis was performed for DDE and PCB using GC–MS in selective-ion monitoring mode with an electron ionization source. Spiked standards and blank samples were measured for quality analysis/quality control.
Methylmercury
Samples were prepared by alkaline digestion. A combination of methanol and potassium hydroxide was used to solubilize MeHg for instrumental analysis. Highly selective and sensitive detection was achieved by cold vapour atomic fluorescence spectrometry after pyrolytic decomposition of the GC eluent. The diluted extract was buffered to a pH of 4·5–5·0 and treated with sodium tetraethylborate, resulting in ethylation of oxidized mercury species. These volatile ethylated species (as well as elemental mercury) were stripped from the liquid phase with argon gas, retained on Tenaex traps, desorbed back into the sample stream and separated with a GC column. Each ethylated mercury species was released from the column en masse into the sample stream, thermally oxidized to elemental mercury and then detected by cold vapor atomic fluorescence spectrometry.
Statistical analyses
Proportions and means with 95 % CI were calculated to describe seafood consumption in different BC ecozones. Seafood consumption was stratified in tertiles for the total population, separately for males and females. Other dietary characteristics, such as fruit and vegetable consumption, which appeared frequently in the diet of individuals were calculated using the 24 h recall data. Mean levels of dietary variables and lifestyle characteristics were compared between participants from three categories of seafood consumption within each gender. Univariate regression was performed to assess if differences were statistically significant. To compare macronutrient intakes, nutrient densities per 4184 kJ (1000 kcal) were estimated by dividing each participant’s daily nutrient intake by his/her total energy intake and multiplied by 4184 kJ (1000 kcal). Daily intake of the top ten most consumed seafood species and their contributions to dietary EPA+DHA and selected contaminant intakes were estimated. Proportions of FN males and females who met dietary recommendations for EPA+DHA were calculated. Results with a P value of less than 0·05 were considered statistically significant.
All estimates were weighted to obtain representative data at the regional level. All statistical analyses were performed using the statistical software package Stata version 14.2.
Results
The study population consisted of 1103 participants (398 men and 705 women) living in twenty-one communities across eight BC ecozones (Fig. 1). Seafood reported by FN in BC combined the variety of forty-one fish, sixteen shellfish, four seaweed and four sea mammal items. Overall, 95 % of FN reported consuming at least one traditionally harvested seafood in the prior year, including fish (94·7 %), shellfish (60·0 %), seaweed (34·5 %) and sea mammals (2·8 %). Salmon was the most consumed fish species, consumed by 91·2 % of FN in BC. The mean intake of total seafood was estimated to be 42·8 (95 % CI 28·3, 57·4) g/d. The mean age of the total population was 45·7 (95 % CI 42·7, 48·7) years and was comparable between males and females (46·1 (95 % CI 43·1, 49·1) years and 45·5 (95 % CI 42·4, 48·7) years, respectively). Mean BMI was 29·7 (95 % CI 28·4, 31·1) kg/m2 in both males and females. The smoking rate was higher in males (42 %) than females (37·5 %). Also, males tended to be more physically active compared with females. About 51 % of FN males reported moderate/vigorous activity while only 38·5 % of females did. The total years of education were comparable between male and female FN.
The consumption of marine foods varied significantly across BC ecozones (Table 1). The highest consumption of total seafood was reported by FN living in the coastal ecozones of the Pacific Maritime/Subarctic/Northwest Coast (57·8 g/d) and the Montane Cordillera/Subarctic/Northwest Coast (31·0 g/d) followed by the northern region of the Boreal Cordillera/Subarctic (25·1 g/d). In the Pacific Maritime/Plateau and the Montane Cordillera/Plateau, average seafood consumption was 27·3 g/d and 26·5 g/d, respectively. Likewise, the consumption of total fish, salmon, shellfish and seaweed was determined to be higher among FN residing in the coastal and northern regions. The lowest intake of total seafood was reported by participants from the Taiga Plain ecozone (8·0 g/d). Table 2 shows the proportion and daily intake of different seafood species in consumers only. The highest proportions of FN who consumed total seafood resided in the Pacific Maritime, the Montane Cordillera/Subarctic/Northwest Coast and the Boreal Cordillera/Subarctic ecozones, ranging from 95·7 to 98·4 % of consumers with the mean intake of 26·3–59·1 g/d. Among all seafood species, salmon was the most consumed fish, especially among FN living in the coastal and northern ecozones where salmon contributed about 50 % of the total fish consumption. Mean intake of shellfish ranged from about 2 to 14 g/d. However, the highest percentage of FN eating shellfish resided in the Pacific Maritime/Subarctic/Northwest Coast ecozone (81 %). Seaweed consumption across regions ranged from 0 to 9 g/d. The highest percentage of participants consuming seaweed lived in the Pacific Maritime/Subarctic/Northwest Coast ecozone (52 %) with a mean intake of 7·2 g/d. The consumption of sea mammals was reported by 3 % of FN in the Pacific Maritime/Subarctic/Northwest Coast ecozone (12·3 g/d) and by one participant (1·3 %) from the Boreal Cordillera/Subarctic ecozone (2·1 g/d).
Table 1 Seafood consumption in First Nations adults aged 19 years or over (n 1103) in British Columbia, Canada, by ecozone; First Nations Food Nutrition and Environment Study (FNFNES), 2008–2018
All estimates are weighted.
Table 2 Seafood consumption in First Nations adults aged 19 years or over (n 1103) in British Columbia, Canada, by ecozone (consumers only); First Nations Food Nutrition and Environment Study (FNFNES), 2008–2018
All estimates are weighted.
* Percentage of consumers of the respective food item.
Lifestyle and demographic characteristics of FN males and females by tertiles of total seafood consumption are presented in Table 3. Among both males and females, high seafood consumers were older, had a higher BMI and had a lower smoking rate than low seafood consumers. In males, the highest seafood consumption was associated with increased physical activity, traditional food-gathering activity and lower prevalence of food insecurity. In females, physical and traditional food-gathering activity as well as food security status were not associated with seafood consumption. Similarly, self-perceived health status, household size, years of education and sources of income did not differ between seafood consumption groups.
Table 3 General characteristics of First Nations males and females aged 19 years or over (n 1103) in British Columbia, Canada, by tertile of seafood consumption; First Nations Food Nutrition and Environment Study (FNFNES), 2008–2018
All estimates are weighted.
* Traditional activity, any traditional food-gathering activity by participants.
Dietary characteristics of participants are summarized in Table 4. Fruit juice contributed significantly to fruit consumption; therefore, solid fruit with and without 100 % fruit juice consumption were estimated separately. Among both males and females, individuals with higher seafood consumption had higher consumption of both fruit (with and without juice) and vegetables. Overall, males reported higher consumption of fruit than females; however, females consumed more vegetables than males did. Total energy intake increased with seafood consumption and was higher among males. The mean percentage of energy from protein, carbohydrate, fat and saturated fat was within the recommended Acceptable Macronutrient Distribution Range, i.e. protein 10–35 %, carbohydrate 45–65 %, fat 20–35 %, saturated fat <10 %. Among females, the proportion of energy from protein decreased significantly with increased seafood consumption; whereas in males, the proportion of energy from total fat increased with seafood consumption. Macronutrient and fibre intakes were not different between seafood consumption groups. EPA+DHA intake increased significantly with seafood consumption.
Table 4 Dietary characteristics of First Nations males and females aged 19 years or over (n 1103) in British Columbia, Canada, by tertile of seafood consumption; First Nations Food Nutrition and Environment Study (FNFNES), 2008–2018
All estimates are weighted.
Fruit/juice includes solid fruit and 100 % pure fruit juice (fresh, canned, frozen); fruit includes solid fruit only; vegetables includes fresh, frozen, canned (excludes potatoes).
Acceptable Macronutrient Distribution Range: protein 10–35 %, carbohydrate 45–65 %, fat 20–35 %, saturated fat <10 %.
* Estimated using FFQ.
† Estimated using 24 h recalls.
Table 5 summarizes the daily intakes of the top ten most consumed seafood species and their contribution to total EPA+DHA intake. Total salmon combined sockeye, chinook, coho, pink, chum salmon species and salmon eggs, and was the most consumed type of fish. About 91·2 % of FN in BC reported eating any type of salmon with the mean intake of 28·6 g/d in men and 16·8 g/d in women. Among all salmon species, sockeye was the most popular with a mean intake of 15·3 g/d in men and 8·3 g/d in women. Halibut and trout species were the third and fourth most consumed fish reported by about 37 and 41 % of all participants. Among shellfish species, crab and prawn contributed to the top ten seafood species and were consumed by 25 and 23 % of FN responders, respectively.
Table 5 Daily intake of top ten most consumed seafood species and their contribution to EPA and DHA intake (consumers only) in First Nations males and females aged 19 years or over (n 1014) in British Columbia, Canada; First Nations Food Nutrition and Environment Study (FNFNES), 2008–2018
All estimates are weighted.
Total salmon and top ten most consumed species represented 46 and 64 % of total seafood intake, by weight, respectively.
Total salmon contributed 59 % of EPA+DHA intake among both males and females.
Top ten most consumed species contributed 69 % of EPA+DHA intake among males and 68 % among females.
Total salmon and the top ten most consumed species represented 46 and 64 % of the total seafood intake, respectively, by weight. Salmon was a major source of EPA+DHA in FN in BC, with a mean intake of 392·8 mg/d in men and 238·6 mg/d in women, contributing 59 % to the total EPA+DHA intake. The top ten most consumed seafood species made up 69 % of the total dietary intake of EPA+DHA. In general, males consumed more seafood than females did, and therefore had a significantly higher intake of EPA+DHA.
Table 6 presents the contribution of total seafood to EPA+DHA intake and the contribution to meeting the dietary recommendation of 500 mg/d for the general adult population without CVD, which is considered to be sufficient to obtain protective effects for primary prevention of CVD( Reference Vannice and Rasmussen 39 , Reference Kris-Etherton and Innis 40 ). There is currently, however, no Estimated Average Requirement or Adequate Intake for EPA+DHA. The proportion of FN males and females who had EPA+DHA intake >500 mg/d was estimated by gender and age groups since significant differences in seafood and thus EPA+DHA intake were found. Older participants (>50 years) reported significantly higher total seafood consumption compared with the younger individuals, especially among males (47·0 v. 95·0 g/d). In younger males and females, total seafood consumption was comparable (32·7 and 30·9 g/d, respectively). Mean EPA+DHA intake from total seafood exceeded the Recommended Intake (RI) of 500 mg/d in men aged >50 years (Table 4). Overall, the proportion of FN who met the RI for EPA+DHA of ≥500 mg/d from total seafood was 28 % and ranged from 22 to 58 % in different age and gender groups.
Table 6 Contributions of total seafood to EPA+DHA dietary recommendations in First Nations males and females aged 19 years or over (n 1103) in British Columbia, Canada; First Nations Food Nutrition and Environment Study (FNFNES), 2008–2018
RI, Recommended Intake for the general adult population (Dietitians of Canada and American Heart Association)( Reference Kris-Etherton and Innis 40 ).
Table 7 summarizes dietary exposure to MeHg, DDE and PCB from the top ten seafood species in FN in BC. Overall, dietary intake of the selected contaminants was very low and far below the established Tolerable Daily Intakes (TDI) in FN participants( 41 ). Males had higher MeHg, DDE and PCB intake than females due to their higher seafood consumption.
Table 7 Dietary intake of selected contaminants from the top ten seafood species (consumers only) in First Nations males and females aged 19 years or over (n 1014) in British Columbia, Canada; First Nations Food Nutrition and Environment Study (FNFNES), 2008–2018
MeHg, methylmercury; DDE, dichlorodiphenyldichloroethylene; PCB, polychlorinated biphenyls, TDI, Tolerable Daily Intake.
All estimates are weighted.
TDI for MeHg=0·47 µg/kg per d (total population), 0·2 µg/kg per d (women of childbearing age, 19–50 years); TDI for PCB=1 µg/kg per d; TDI for DDE=20 µg/kg per d.
A comparison of seafood consumption (grams per day and percentage of consumers) collected with the FFQ and the 24 h recalls is presented in Table S1 (see online supplementary material). According to the data collected with the FFQ, a significantly higher proportion of individuals reported consuming seafood species compared with the data collected with the 24 h recall. The consumption of sea mammals was not captured by the 24 h recall. Overall, the mean intake (grams per day) of seafood collected using the FFQ was higher than that from the 24 h recall.
The concentrations of EPA+DHA( 38 ) and selected contaminants( Reference Chan, Receveur and Sharp 11 ) in the top ten seafood species are presented in Table S2 (see online supplementary material).
Discussion
Seafood consumption patterns of FN living on reserve in BC varied significantly across different ecozones, reflecting geographical diversity of seafood species. The varieties of fish and seafood, quantity and frequency consumed depended on geographical location, cultural background and availability of different types of seafood. FN communities living in or near coastal BC ecozones consumed significantly higher amounts of marine foods, including fish species, shellfish and seaweed, compared with those living in the interior/inland regions, namely the Boreal Plain/Subarctic, the Montane Cordillera/Plateau and Subarctic, and the Taiga Plains ecozones. On the other hand, freshwater fish species were harvested and consumed by inland FN communities. Salmon represented the most important food, especially in the coastal communities( Reference Mos, Jack and Cullon 42 , Reference Jin, Teschke and Marion 43 ). In fact, salmon species were the most frequently consumed and were the major contributors to the top ten seafoods. Furthermore, salmon alone provided more than one-third of the total EPA+DHA intake from total marine foods. The continued heavy reliance and use of salmon reflects its status as a cultural keystone species and favourite food for FN( Reference Garibaldi and Turner 44 ). Crab and prawn were the most commonly consumed species reported in the shellfish category and were consumed most frequently in the coastal Pacific Maritime ecozone.
Higher seafood consumption was associated with other indicators commonly associated with a healthy lifestyle: high seafood consumers tended to eat more fruits and vegetables and had a lower smoking rate than the low seafood consumers. The increased physical activity with increased seafood consumption in males may indicate that those men who ate more seafood were more likely to be involved in traditional food-gathering activities including hunting, fishing and collecting seafood. Lower protein consumption in female high seafood consumers may be explained by the possible reduced intake of other protein sources (such as meat)( Reference Iso, Rexrode and Stampfer 45 ). Our findings on higher fruit and vegetable consumption, lower smoking rates and higher physical activity among high seafood consumers are in concordance with the findings from other studies and may indicate that seafood consumption is likely an element of a healthier lifestyle( Reference Wennberg, Tornevi and Johansson 46 , Reference Turunen, Männistö and Suominen 47 ). However, those studies were not performed with Indigenous peoples for whom fish harvesting is a traditional activity. A study among Norwegian women revealed that seafood consumption increased with increasing size of the household( Reference Myrland, Trondsen and Johnston 48 ), whereas other studies found that level and frequency of fish consumption were significantly positively correlated with income( Reference Can, Günlü and Can 49 , Reference Verbeke and Vackier 50 ). Regarding education level, prior studies reported a positive( Reference Wennberg, Tornevi and Johansson 46 , Reference Myrland, Trondsen and Johnston 48 , Reference Can, Günlü and Can 49 ) or no association( Reference Verbeke and Vackier 50 ) with frequency of fish consumption.
The majority of previous studies investigating determinants of fish/seafood consumption were conducted among general populations. To our knowledge, the only study involving an Indigenous population was conducted among the Nenets people residing in Arkhangelsk region in Russia( Reference Petrenya, Dobrodeeva and Brustad 51 ). That study reported that fish consumption was positively associated with monthly income and frequency of fishing( Reference Petrenya, Dobrodeeva and Brustad 51 ).
The prevalence of food insecurity was significantly lower in high seafood consumers compared with low seafood consumers among males, whereas no differences were noted in females. Additional estimations showed that the prevalence of food insecurity was significantly lower among males compared with females (27·4 v. 46·6 %, P=0·04; data not shown), indicating that male participants may under-report the level of food insecurity. In fact, a recent study among the general Canadian population revealed that in married households, higher food insecurity rates were reported when the respondent was female and neither respondent characteristics nor socio-economic factors accounted for the difference( Reference Matheson and Mcintyre 52 ). These discrepancies were explained by gender-related differences in the perception of food security status( Reference Jung, de Bairros and Pattussi 53 ). Females tend to exhibit greater sensitivity to household needs and well-being of others than males( Reference Matheson and Mcintyre 52 ). Females are usually responsible for the majority of tasks related to food (food purchasing, processing and preparation); therefore, they may have better information about food security problems of their households( Reference Jung, de Bairros and Pattussi 53 , Reference Ivers and Cullen 54 ). Since the food security questionnaire reflects ‘household’ food security status, it does not reflect the status of a specific individual within the household. In the total sample, there were no differences in the prevalence of food insecurity by seafood consumption categories (data not shown).
Age and gender differences in seafood consumption among FN in BC were noted. Males and older participants (>50 years) tended to eat a greater amount of total seafood compared with females and younger age groups (19–50 years). These findings may suggest that younger generations of FN are more affected by the nutrition transition than older FN. These dietary and lifestyle changes may have significant health implications for FN in the future, such as increasing rates of obesity and other chronic conditions( Reference Gagne, Blanchet and Lauzie 13 , Reference Kuhnlein, Receveur and Soueida 17 ).
In total, 28 % of FN in BC met the RI for EPA+DHA from consumption of seafood, whereas 72 % of FN had intake of EPA+DHA less than 500 mg/d. Among the older age group (>50 years), however, 58 % met the RI for EPA+DHA, which reflects higher seafood consumption (by weight). Overall, the EPA+DHA intake in FN in BC was much higher than that of the American population. In US adults, mean EPA and DHA intakes were 41 and 72 mg/d, respectively( Reference Papanikolaou, Brooks and Reider 55 , Reference Nordgren, Lyden and Anderson-Berry 56 ). In a representative sample of Quebecers, mean intake of EPA+DHA was 291 mg/d and 85 % of the participants had an intake below the RI( Reference Lucas, Asselin and Plourde 57 ). Suboptimal intakes of EPA+DHA were also reported in a study among Canadian pregnant women( Reference Friesen and Innis 58 ). Among the Inuit from Nunavik, mean intake of EPA+DHA was 2196 mg/d in males and 2031 mg/d in females which is three to five times higher than that in the FN in BC( Reference Dewailly, Blanchet and Lemieux 25 ). In the present study, EPA+DHA intake was based solely on fish and seafood consumption and therefore did not include other possible sources, including other types of traditional foods and store-bought foods, whose contribution is likely to be relatively less important.
Numerous health benefits of EPA+DHA have been reported by clinical and epidemiological studies. Increased EPA+DHA intake decreases CVD, sudden cardiac death and stroke( Reference Siriwardhana, Kalupahana and Moustaid-Moussa 59 ). In addition, EPA+DHA is beneficial for reducing inflammatory disorders, hypertension, insulin resistance and arthritis( Reference Mozaffarian and Wu 60 ). Recent research demonstrated a potential favourable effect of EPA+DHA on mental and neurological disorders( Reference Lucas, Dewailly and Blanchet 61 , Reference Zhang, Li and Hu 62 ). Furthermore, adequate intake of EPA and DHA during pregnancy and lactation is critical for proper brain development of infants( Reference Shahidi and Ambigaipalan 63 ). However, more intervention trials are needed to better understand the role of EPA and DHA in neurodevelopment( Reference Flock, Harris and Kris-Etherton 64 ). Growing evidence of the importance of EPA+DHA for cardiovascular health and cognitive development led to the recommendations for daily intake of EPA+DHA and fish by national and international health agencies and professional organizations( Reference Flock, Harris and Kris-Etherton 64 ). Most guidelines recommend from 200 to 1000 mg of EPA+DHA daily, with the optimal intake of 500 mg/d. The Dietitians of Canada recommend long-chain n-3 fatty acid intake of 500 mg/d for the general adult population( Reference Kris-Etherton and Innis 40 ). This amount is considered sufficient to obtain cardioprotective effects for primary prevention of CVD. Individuals with CVD are recommended to consume 1 g of EPA+DHA daily for secondary prevention of CVD, whereas patients with high TAG levels are recommended to consume 2–4 g of EPA+DHA daily, as capsules, under a physician’s supervision. With regard to fish consumption, the majority of guidelines including the American Heart Association recommend two servings of oily fish per week which provide about 500 mg of EPA+DHA per day( Reference Flock, Harris and Kris-Etherton 64 ). Nevertheless, in order to establish a dietary reference intake for EPA and DHA, more information is needed to define the intakes of EPA and DHA required to reduce the burden of chronic disease( Reference Flock, Harris and Kris-Etherton 64 ).
The mean intake of MeHg, PCB and DDE from total seafood did not exceed the TDI for MeHg (0·47 µg/kg per d for total population, 0·2 µg/kg per d for women of childbearing age) or the TDI for PCB (1 µg/kg per d) or the TDI for DDE (20 µg/kg per d). Despite the high consumption of seafood, the risk of dietary exposure to selected environmental contaminants was negligible in BC FN.
Differences in average intake (grams per day) of seafood calculated using the FFQ and the 24 h recall were found. Overall, the FFQ tended to overestimate seafood consumption compared with the 24 h recall. The FFQ collected information about seafood intake over the past four seasons, and thus captured all identified seafood species consumed by respondents in the past year. The 24 h recall gathered information about all foods and beverages consumed by respondents in the past 24 h. The 24 h recall is an adequate method to estimate the average usual dietary intakes of a group or a certain population( Reference Shim, Oh and Kim 65 ). Given that the 24 h recall was performed on one day in the autumn, it may not capture seasonal variability in seafood consumption patterns among FN individuals. Since the FFQ accounts for the seasonal variability of locally harvested seafood consumption in on-reserve FN, we preferred overestimating by the FFQ rather than underestimating by the 24 h recall.
The current study has some limitations. The EPA+DHA concentrations in each seafood species were obtained from the Canadian Nutrient File, considering the preparation method (i.e. baked or broiled, boiled or raw). The Canadian Nutrient File includes information for both commercial and wild seafood species. If no data on fatty acid composition for wild seafood species were available, data for commercial seafood species were used. Therefore, the EPA+DHA contents used in the study contain intrinsic error due to the regional and species variations in fatty acid contents as well as the likely differences between wild and commercial seafoods. Second, self-reported estimates on seafood consumption also contain intrinsic error leading to inaccuracy in estimated intake of EPA+DHA.
The present study is the first that explored fish consumption patterns, estimated dietary EPA+DHA intake, exposure to environmental chemicals from seafood, and examined dietary and lifestyle characteristics associated with seafood consumption in FN in BC. Strengths of the study include a large and representative sample of FN living on reserve. Also, seafood consumption was assessed using a traditional FFQ that was developed based on previous work conducted with Aboriginal people( Reference Chan, Receveur and Sharp 11 ). The FFQ captures the entire year’s intake and is exhaustive when it comes to seafood species. Finally, contaminant concentrations in locally harvested fish were measured in the study.
Conclusion
In BC FN communities, seafood continues to be an essential part of the contemporary diet, especially among older FN. Seafood consumption contributed significantly to intake of EPA+DHA and to reaching dietary recommendations and was associated with a healthier lifestyle. Seafood species mostly consumed were low in contaminants. Salmon remained the most consumed seafood and important source of essential nutrients. Given numerous health benefits, seafood consumption should be promoted in BC FN, especially among the younger generation to prevent development of chronic disease. Efforts towards sustainability of fishing should be directed to maintain and improve access to fisheries for FN.
Acknowledgements
Acknowledgements: The authors would like to express their gratitude to all participants for their cooperation and participation in the First Nations Food, Nutrition and Environment Study (FNFNES). They thank all First Nations community members who collected food and water samples, assisted in data collection, coordinated research activities, and arranged meetings and public gathering to share information. Financial support: FNFNES is funded by Health Canada and the communication of the results to the communities was also funded by the Canadian Institutes of Health Research (CIHR). H.M.C. is supported by the Canada Research Chair Program. The funding agencies had no role in the design, analysis or writing of this article. Conflict of interest: The authors have no potential conflicts of interest. Authorship: L.M. performed statistical analyses, interpreted the data and drafted the manuscript. All authors were involved in the design of the study, collected the data and provided feedback on the manuscript. Ethics of human subject participation: This survey was conducted following the CIHR guidelines regarding Aboriginal people, the Tri-Council policy statement on ethical conduct for research involving human subjects, and the document entitled ‘Indigenous people and participatory health research: Planning & management, preparing research agreements’ published by the WHO. The protocol was accepted by the Ethical Review Boards at Health Canada, the University of Northern British Columbia and the Université de Montréal. In addition, the Assembly of First Nations (AFN) Chiefs-in-Assembly passed resolutions in support of this research. Individual participation in the project was voluntary and based on informed written consent after an oral and written explanation of each project component.
Supplementary material
To view supplementary material for this article, please visit https://doi.org/10.1017/S136898001800215X


