


The increase in the prevalence of obesity observed in recent years in middle-income countries such as Mexico(Reference Olaiz-Fernández, Rivera-Dommarco and Shamah-Levy1) is a public health problem, as obesity is a risk factor for chronic disease. A decrease in energy expenditure due to a low physical activity level is a factor linked to the increase in obesity. At present, the majority of the population appears to have adopted less active lifestyles as the use of motorised transport, employment of mechanised equipment to perform occupational and domestic tasks, and time spent watching television and using computers have increased. For example, in high-income countries, it has been shown that during the 1970s the average amount of time spent watching television was 13 h/week, while in the 1990s it was 26 h(Reference Prentice and Jebb2).
Moderate and vigorous physical activity are associated with lower body fat, greater bone mineral density, better respiratory and immune system functioning, less peripheral vascular resistance, lower LDL cholesterol levels and higher HDL cholesterol levels and greater sensitivity to insulin, which is related to lower risk of CVD, diabetes, cancer and osteoporosis(Reference Tremblay, Shepard and Brawley3). Physical activity also exerts positive effects on mental health, reducing depressive symptoms and increasing self-esteem(Reference Tremblay, Shepard and Brawley3).
Different methods have been used to evaluate physical activity, and are grouped into subjective (observation, questionnaires and registries) and objective (doubly-labelled water, indirect calorimetry, heart rate and motion sensor monitoring) modes of evaluation. Questionnaires comprise the most frequently used technique in population studies due to their low cost and feasibility. The International Physical Activity Questionnaire (IPAQ)(4) assesses physical activity during the prior 7 d in adult populations. This has been recommended for utilisation in epidemiological studies to compare physical activity among different populations(Reference Craig, Marshall and Sjostrom5, Reference Rutten, Ziemainz and Schena6).
There is research in high-income countries regarding the prevalence of physical activity and its correlates(Reference Varo, Martinez-Gonzalez and Irala-Estevez7–Reference De Bourdeaudhuij, Teixeira and Cardon10). However, national representative data from Latin American countries are limited(Reference Hallal, Victoria and Wells11–Reference Monteiro, Conde and Matsudo13). Owing to differences in nutrition(Reference Popkin14), findings from high-income countries may not apply to middle-income countries. In addition, the interactions among sociodemographic factors associated with physical activity have been not been well analysed(Reference Grzywacz and Marks15). For example, in middle-income countries, a negative association of socio-economic status with obesity has been observed in women, but not in men(Reference Monteiro, Moura and Conde16). This pattern may be the same for physical activity. Likewise, the relationships among gender, socio-economic position and physical activity may be different in rural contexts than in urban; women residing in rural zones and those with low socio-economic status may engage in sports less frequently, but likely have more active occupations.
In Mexico, there are no data on physical activity patterns that are representative at the national level. Some surveys have analysed physical activity in certain segments of the population: women of reproductive age(Reference Hernandez, de Haene and Barquera12) and those belonging to a social security institution (Instituto Mexicano del Seguro Social)(Reference Acosta-Cazares, Aranda-Álvarez and Morales-Reyes17); these cover 32 % of the Mexican population. In each of these surveys, the analysis has focused on recreational and sport activities; however, other forms of activity (i.e. occupation or walking) were not assessed.
The present study had the following aims: estimate, using the IPAQ, the physical activity level of a representative sample of the adult population of Mexico and establish the sociodemographic variables that could be linked with active lifestyles. This allows identification of groups with a lower probability of engaging in physical activity, which may be useful in the design of programmes and policies leading to the promotion of an active lifestyle among these groups.
Materials and methods
Data from the Mexican National Performance Assessment Survey (ENED, Encuesta Nacional de Evaluación del Desempeño) were analysed(Reference Palma-Coca and Olaiz-Fernández18). A sample of 38 746 adults aged >18 years old was studied. A probabilistic, stratified (city or metropolitan area, urban suburb, or rural area), by conglomerates and multistage (census tracts, households, and participants) sampling was used. Fieldwork was conducted from November 2002 through April 2003 and the non-response rate was 3·1 %. The ethics committee of the National Institute of Public Health approved the survey and written informed consent was obtained from participants. The field activities of this survey have been described elsewhere(Reference Palma-Coca and Olaiz-Fernández18).
Gender and age of the participants interviewed were analysed as independent variables. Four age groups (18–30, 31–45, 46–60 and ≥61 years) were formed. Household expenses were used as a proxy of household income, and therefore as a socio-economic status indicator. The monthly expenses of households on the following items were investigated: food, fuels, alcoholic beverages, household services, education, health services, insurance and other expenses. The different expenses were summed and four groups were formed according to family expense quartiles (very low: ≤USD 100·6; low: USD 100·7–182·5; medium: USD 182·6–306·10; and high: USD 306·11–59 846·7). Size of town was categorised as rural (<2500 inhabitants), urban (2500–99 999) and city (100 000 or more).
Occupations were grouped into (i) unemployed; (ii) professional and technician (i.e. legislator, high-level public servant and company director), professional (engineer, physician, professor and member of the clergy), or professional, technician or professional associate (inspector, financial agent); (iii) service-oriented employee, including employee (secretary, cashier) and service, sales employee (cook, travel agent), artisan, businessperson and business operator: artisan or business owner (carpenter, painter, jeweler and butcher), or machine operator or setter in a plant (equipment setter, sewing machine operator and conductor); (iv) manual or domestic worker: manual worker (salesperson in unofficial economy, ticket salesperson) or domestic worker; and (v) agriculture and fishing: agriculture or fishing worker. For this occupation category, it was not possible to establish who was a farmworker or owner. In addition, one difficulty with the occupation variable was that one-half of the population reported being unemployed. Thus, the occupation variable was not incorporated into the ordinal regression models. However, physical activity-level distribution was estimated according to occupation because the latter could provide information on the type of physical activity that persons performed (occupational v. recreational).
In the ENED, the short version of the IPAQ was applied. The frequency (d/week) and time spent (h/d and min/d) on walking and moderate- and vigorous-intensity physical activities were obtained. To analyse these data, the data-coding and editing procedures suggested by the IPAQ Group were used(4): responses of ‘15’ to a question on hours were analysed as minutes; cases in which the sum of time spent on walking and moderate or vigorous physical activities was >960 min, the equivalent of 16 h of physical activity per d, were excluded. Only activities with a duration of >10 min were included. The time spent on the three physical activities was truncated to a maximum of 180 min, and it was verified that there were no values >7 d/week.
To create physical activity levels, we observed the following criteria(4): (i) high activity level: vigorous-intensity activity ≥3 d/week reaching ≥1500 metabolic equivalents (MET)/min/week of total physical activity or ≥7 d of some combination of walking and moderate or vigorous activity, achieving ≥3000 MET/min/week of total physical activity; (ii) moderate activity level: ≥3 d of vigorous activity of ≥20 min/d or ≥5 d of an activity of moderate intensity and/or walking ≥30 min/d or ≥5 d of some combination of walking, moderate or vigorous activity or vigorous activity achieving ≥600 MET/min/week; and (iii) low activity level: criteria (i) and (ii) were not met.
Statistical analysis was performed using the survey commands of Statistical Package for the Social Sciences statistical software package version 15·0 (SPSS Inc., Chicago, IL, USA), which takes into account the complex design of ENED (probabilistic, stratified, multistage and by-clusters sampling) and to use sampling weights. The distribution of physical activity levels according to sociodemographic variables was estimated (Table 1). The distribution of responses to the IPAQ questions (median and quartiles) on the three physical activity levels was then established. Owing to the fact that there was an elevated frequency of high activity level (59·3 %) in the population, it was estimated which type of activity contributed to a high level of physical activity.
Table 1 Population characteristics and physical activity-level distribution according to sociodemographic variables

*(i) High activity level: vigorous-intensity activity ≥3 d a week reaching ≥1500 metabolic equivalents (MET)-min/week of total physical activity or ≥7 d of some combination of walking and moderate or vigorous activity, achieving ≥3000 MET/min/week of total physical activity; (ii) moderate activity level: ≥3 d of vigorous activity of ≥20 min/d or ≥5 d of an activity of moderate intensity and/or walking ≥30 min/d or ≥5 d of some combination of walking, moderate or vigorous activity or vigorous activity achieving ≥600 MET/min/week; and (iii) low activity level: criteria (i) and (ii) were not met.
Ordinal regression models were fitted to assess the association of physical activity levels with sociodemographic factors. The ordinal regression models estimate a link function from the actual cumulative probabilities of each category in the outcome variable (i.e. physical activity level). Because of the skewed distribution of the physical activity level (see Table 1), the complementary log–log link function was chosen. A positive (negative) coefficient from these models corresponds to an increasing (decreasing) probability of being in one of the higher cumulative outcome categories. To assesses the interactions among predictors(Reference Rothman and Greenland19), the regression models were stratified by gender and size of town.
Results
There was a slight predominance of men, and the age ranges with the highest frequencies in the sample were 18–30 and 31–45 years. One half of the population did not work; among those who did work, the most common occupations were service employees, artisans, businesspersons and business operators. The majority of the sample resided in cities (Table 1).
Nearly 60 % of the participants were classified as having a high activity level, and the remainder had medium or low activity levels (Table 1). Men and women had a similar distribution across the three physical activity levels. High activity level decreased inversely with age: from ∼60 % in persons <45 years old to 45·1 % in those >61 years old. The opposite tendency was observed with low activity level. There were few differences in physical activity levels according to socio-economic status.
Adults who worked in agriculture and fishing had the greatest percentage of participants in the high activity level, whereas those in lower-intensity occupational activities (unemployed, professionals, technicians and service employees) showed a greater proportion at low and medium activity levels. In comparison with persons living in urban localities or in cities, people in rural localities had the highest proportion of high activity level, but lower proportions in low and medium ones.
In evaluating time spent on an activity, it was observed that the sample engaged in walking 7 d a week with a median time of 30 min/d (Table 2). Moderate-intensity activity was engaged in 5–7 d/week with a 60–180 min duration. Vigorous-intensity physical activity was only present in the highest quartile, in which the frequency was 2 d a week for 30 min. Among all groups’ demographic variables (e.g. age, gender, socio-economic position, occupation and size of town), the median and third quartile of frequency spent on walking was 7 d/week. Men spent more time walking than women. Median frequency and time spent on moderate activity were greater in women than in men. In men, third-quartile frequency and time spent on vigorous-intensity physical activity were 4 d/week and 120 min/d, respectively. In women, the third quartile was zero in both variables.
Table 2 Quartiles (Q) of frequency (d/week) and time (min/d) of walking and moderate- and vigorous-intensity activitiesFootnote * according to sociodemographic variables
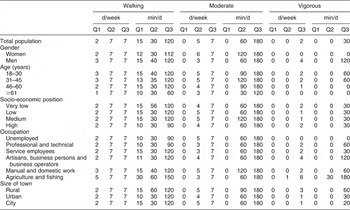
* Values estimated from the items of International Physical Activity Questionnaire. The fourth quartile for d/week and min/d were 7 and 180 min, respectively, in all groups.
Median time spent in moderate-intensity physical activity was greater in the group of 18–30-year-olds than in the group aged ≥61 years. The median number of days spent on moderate-intensity physical activity was greater in participants aged ≤45 years in comparison to individuals aged >46 years old. Adults aged ≥61 years engaged in fewer days a week and less time per d in moderate-intensity activities. In all age groups, median frequency and time spent on vigorous-intensity activities were zero. Frequency in the third quartile of time spent on this activity was 2 d/week and 60 min/d in groups aged ≤45 years.
Adults of very low socio-economic status dedicated more time to walking. No linear pattern of frequency and time spent on moderate and intense activity was identified according to socio-economic groups.
Participants working in agriculture and fishing spent the most time walking, followed by those carrying out manual or domestic work. Median frequency in moderate-intensity physical activity ranged from 3–5 d; median time spent on this activity was 60 min in unemployed persons and in those engaging in manual or domestic work. Vigorous-intensity physical activity was engaged in more frequently and for longer durations by participants engaged in agriculture and fishing.
Adults residing in rural localities spent twice as much time on walking as those living in urban areas or cities. Moderate-intensity physical activity was more frequent in rural localities and in cities, with more time for walking in rural localities. Vigorous-intensity physical activity was engaged in more d/week in rural localities, with a median duration of 60 min.
The results of the ordinal regression models considering physical activity levels as dependent variables are shown in Tables 3 and 4. Increased age was associated with a lower probability of engaging in physical activity. People from rural and urban areas had a higher probability of engaging in physical activity than those from cities; there were no differences among genders. Women of low socio-economic status had a lower probability of engaging in physical activity than women of high socio-economic status, while among the men there was no difference.
Table 3 Ordinal regression models stratified by gender (dependent variable: physical activity)
Coef., coefficient; Ref., reference group.
Table 4 Ordinal regression models stratified by size of town (dependent variable: physical activity)

Coef., coefficient; Ref., reference group.
Among locations, probability of engaging in physical activity was negatively correlated with age (see Table 4). In rural areas, men had a higher probability of engaging in physical activity than women; the opposite trend was observed in cities. The probability of engaging in physical activity in rural areas was higher in people from the third quartile of family expenses than those of the fourth quartile. However, in urban localities and cities, respondents with low family expenses had a lower probability of engaging in physical activity.
Discussion
Prevalence and measurement of physical activity
With ENED data, we observed that six of every ten Mexicans had a high activity level. The high prevalence of physical activity found in the present study differs from the results of other investigations in Mexican adults. In people with social security, 24 % of men and 12·4 % of women achieved the recommended amount of sports or recreational physical activity(Reference Acosta-Cazares, Aranda-Álvarez and Morales-Reyes17), whereas 15·9 % of reproductive-aged women regularly practised a sport or physical activity(Reference Hernandez, de Haene and Barquera12).
The discrepancies between estimates reported in the present study and those observed in other studies may be due to only sports or recreational activities being evaluated in the latter study, while the IPAQ utilised in the ENED evaluated all types of activity. Thus, in the other studies physical activity may be underestimated. In addition, the cut-off points employed to classify the sample may be inadequate or may not take into account individual differences.
In the present study, most Mexicans reported walking at least 30 min/d and engaging in moderate-intensity activities for 5–7 d/week with a duration of 60 min or more. These two activities contributed to achieving the recommendations of physical activity in most of the sample, i.e. respondents engaged in moderate-intensity activities or walking five times a week for at least 30 min(20). Although walking was the main activity implied in the high level of physical activity in Mexican adults, the speed or intensity of walking is a factor that could overestimate physical activity; energy expenditure in walking varies from 2·0 to 8·0 MET(Reference Ainsworth, Haskell and Whitt21). Likewise, individual and socio-economic factors could affect the time reported in moderate–vigorous activities and walking. It has been noted that an individual’s perception, purpose of activity and socio-economic status may influence the interpretation of these activities, causing respondents to over-report time spent on each activity(Reference Burton and Turrell22).
In earlier studies using IPAQ, it has been observed that time spent on each activity varies among different populations. In Europe, time spent on walking was 85 min for ∼5 d/week, moderate-intensity activity was engaged in for ∼2 d/week for 45 min and vigorous-intensity activity was engaged in for ∼1 d/week for 40 min(Reference Rutten, Ziemainz and Schena6). Our data show that Mexicans spent more time on walking per d than Europeans, but median minutes were fewer (30 min) in Mexicans. However, the Mexican sample spent more time on moderate-intensity activities than Europeans. With regard to duration of vigorous-intensity activities, the European sample engaged in these slightly more than Mexicans. In other studies on adults from Belgium and Switzerland(Reference Rzewnicki, Auweele and De Bourdeaudhij23, Reference Mader, Martin and Schutz24), IPAQ showed that these groups spent less time on moderate-intensity activities (23 min and 51 min, respectively) than the Mexican sample. However, in those countries, the mean time spent on vigorous-intensity activities was 30 min, whereas in Mexico this activity was only reported in the higher quartile. These results show that Mexicans engage in more moderate-intensity activities than those from other countries, but that they do not engage in enough vigorous physical activity.
It has been observed that in questionnaires used to evaluate physical activity participants tend to overestimate vigorous-intensity activity(Reference Rasmussen, Matthiessen and Biltoft-Jensen25), but underestimate moderate-or low-intensity activities(Reference Hagstromer, Oja and Sjostrom26). Low- or moderate-intensity activities are engaged in for different durations throughout the day, which may be difficult to recall in adults; vigorous-intensity activities, such as exercise, are pursued in a structured way with more stable durations and are easier to recall(Reference Hagstromer, Oja and Sjostrom26). In validation studies, it has been found that IPAQ can overestimate by 200 % the duration of moderate-intensity activities (by 225 additional min/week), as well as vigorous-intensity activities (by thrirty-one additional min/week) in women(Reference Johnson-Kozlow, Sallis and Gilpin27), but can underestimate the energy expenditure by 27 % (500 MET/min/d) in vigorous-intensity activities in both genders(Reference Maddison, Ni and Jiang28). However, at low physical activity levels, there is agreement between the estimation of energy expenditure derived by IPAQ and that determined using the doubly-labelled water technique(Reference Maddison, Ni and Jiang28).
Sociodemographic factors related to physical activity
Almost all the evidence indicates that women tend to practise sports or recreational activities less frequently than men(Reference Crespo, Ainsworth and Keteyian8, Reference Van der Horst, Paw and Twisk29, Reference Salles-Costa, Heilborn and Werneck30). Although Mexican women spend more time in moderate-intensity activities and men in vigorous-intensity activities, differences between the genders vary according to other characteristics, such as age, size of town and socio-economic position. Women in rural areas were less active than men, but in cities women were more active than men. This result may be linked to the fact that men in rural areas have mainly agricultural occupations, while women spend more time on domestic tasks and other agricultural tasks that require less physical effort. Conversely, in cities men are employed in the service and commerce sectors, and women perform household tasks(Reference Livingstone, Robson and McCarthy31).
In a Swedish study using IPAQ(Reference Ekelund, Sepp and Brage32), it was found that men spent more time walking and in vigorous-intensity activities than women (12 min v. 8·6 min/d; 8·6 min v. 3·6 min/d, respectively). Conversely, women spent more time on moderate-intensity activities than men (20·4 min v. 12·1 min/d). In the present study, Mexican men and women reported more time spent on each activity, but only men reported vigorous-intensity activity. In obese men and women from Europe(Reference Tehard, Saris and Astrup33), it was observed that time spent on moderate- (23–25 min/d) and vigorous-intensity activity (12–19 min/d) assessed by IPAQ was lower than in Mexican men and women. The reported time spent on walking was similar between obese men from Europe and Mexico (40 min/d), but obese European women spent 17 min more time on this activity than Mexican women (64 v. 47 min/d). This confirms that Mexican adults tend to participate less in activities with high energy expenditure, and thus it may be necessary to recommend an increase in time spent on vigorous-intensity activities to obtain a positive effect on health status.
In high-income(Reference Varo, Martinez-Gonzalez and Irala-Estevez7, Reference Crespo, Ainsworth and Keteyian8, Reference Burton and Turrell22, Reference Stahl, Rutten and Nutbeam34) and middle-income(Reference Monteiro, Conde and Matsudo13, Reference Salles-Costa, Heilborn and Werneck30) countries, it has been consistently observed that persons with higher socio-economic status have a greater probability of engaging in recreational activities. This finding was also observed in Mexican women, where those of high socio-economic status had a higher probability of being physically active. In contrast, in men there were no differences. It is possible that the differences in women can be attributed to recreational activities, whereas in men these may be the product of occupational activities. It has been proposed that increased physical activity in women with higher socio-economic status is probably because of a concern with body image and health status(Reference Salles-Costa, Heilborn and Werneck30). It is interesting to note that in middle-income countries, the negative relationship between overweight and socio-economic status has been identified in women, but in men the relationship is either positive or absent(Reference Monteiro, Moura and Conde16).
Size of town is another variable that moderated the relationship between socio-economic status and physical activity; in rural localities the socio-economic differences were minimal, whereas socio-economic inequalities in physical activity are clearer in urban towns and cities. This finding is relevant because in Mexico ∼70 % of the population resides in urban areas. In cities, people of low socio-economic status engage in physical activity with less frequency because they live in areas with less infrastructure that would be conducive to engaging in physical activity (i.e. parks, gymnasiums and sidewalks). There is limited public security, which curtails outdoor activities, or there is little time to practise sport or engage in other recreational activities(Reference Grzywacz and Marks15, Reference Burton and Turrell22, Reference Stahl, Rutten and Nutbeam34).
Limitations
In addition to the limitations imposed by the use of the IAPQ previously described in other studies, another restriction of our analysis lies in the lack of information regarding time spent on inactivity. Despite the fact that there is a question to evaluate sitting time in the IPAQ short version, it is believed that this version possesses a low sensitivity for estimating this information(Reference Ekelund, Sepp and Brage32). In other middle-income countries, the prevalence of inactivity has been reported as 41·1 %(Reference Hallal, Victoria and Wells11), whereas in high-income countries this is >60 %(Reference Burton and Turrell22). In general terms, independent of the measurement instrument, there is subestimation of inactivity(Reference Mader, Martin and Schutz24). In future investigations, it would be necessary to distinguish different kinds of activities (occupational, recreational, at home and transportation) and inactivity (sitting, resting, sleeping and watching television). This could establish more clearly the level of physical activity or inactivity and its effect on health state.
It has been suggested that(Reference Livingstone, Robson and Wallace35) measurement instruments of physical activity tend to underestimate domestic activities compared with those involving vigorous-intensity activities. The short version of IPAQ does not establish in detail time spent on domestic activities; thus, it is unclear how the respondents interpret the questions. For example, the use of mechanised equipment reduces the intensity level of household chores(Reference Lanningham-Foster, Nysse and Levine36).
Conclusions
The present study provides the first estimate of physical activity at the national level in the Mexican adult population utilising an internationally validated and reproducible questionnaire and evaluating all physical activity types. Nearly 60 % of the sample had a high level of physical activity, which in the majority of cases could be the result of walking most days for 30 min . Nonetheless, a minority of the population carries out vigorous activities daily. It is necessary, as in other countries where the IPAQ has been used, to validate this questionnaire with more accurate methods to establish its precision in the evaluation of physical activity in the Mexican population.
The association of physical activity with gender and socio-economic position varied according to other factors such as size of town of residence. In rural zones, women engaged in physical activity less frequently than men, while in cities women were more active. In women, higher socio-economic position was associated with less physical activity, but in men there were no differences. Therefore, the complexity of socio-economic and gender inequalities must be considered in the design of policies and programmes to promote physical activity.
Acknowledgements
Sources of funding: The reported analysis received no specific grant from any funding agency in the public, commercial or not-for-profit sectors. Author contributions: L.O.H. and N.R.I. wrote the manuscript. L.OH. conducted the statistical analysis. Acknowledgments: The authors thank Dr Neil Armstrong for his comments on earlier versions of this manuscript. Conflict of interest: The authors declare that they do not have any conflicts of interest.


