


Dietary risk factors, including low vegetable and fruit intake, are among the leading risk factors for cardiovascular and circulatory disease, cancers, diabetes, and other non-communicable diseases( Reference Forouzanfar and Alexander 1 ). The Global Burden of Diseases, Injuries and Risk Factors Study 2015 also singled out high BMI as presenting both a large and increasing risk for global disease burden( Reference Forouzanfar and Alexander 1 ).
Increases in dietary risk factors and BMI risk are linked to economic development and processes of urbanisation, accompanied by a shift in diets to include more fats, sugars, energy-dense and processed foods, and decreasing physical activity( Reference Forouzanfar and Alexander 1 , Reference Popkin 2 ). However, as cities grow and become more densely populated, recent evidence suggests that urban planning can play a protective role in reducing risk exposures and non-communicable diseases by supporting the development of health-promoting built environments( Reference Giles-Corti, Vernez-Moudon and Reis 3 , 4 ). Spatial access to food outlets, such as supermarkets and fast-food chains, is an aspect of the built environment hypothesised to influence dietary intake, BMI and non-communicable diseases( Reference Caspi, Sorensen and Subramanian 5 , Reference Zenk, Thatcher and Reina 6 ). Many studies have investigated how the location and number of food outlets in a local area influence people’s health and whether spatial inequities in food outlet access contribute to dietary and health inequities( Reference Black, Moon and Baird 7 ); however, the current evidence is limited in several ways.
First, a key challenge is the geographic scale around an individual’s home at which the food environment may influence people’s dietary and health outcomes. Few studies provide a rationale for choice of geographic scale( Reference Caspi, Sorensen and Subramanian 5 , Reference Lyseen, Hansen and Harder 8 ) and it is often acknowledged as a study limitation( Reference Ball, Timperio and Crawford 9 ). It has been shown that associations of food outlet access with dietary and health outcomes vary depending on how an individual’s local food environment is geographically defined( Reference Barnes, Colabianchi and Hibbert 10 , Reference Fan, Hanson and Zick 11 ). Administrative boundaries, such as a census block or postcode, and circular or radial network buffers around a household( Reference Charreire, Casey and Salze 12 ) are commonly used to model an individual’s local food environment, with buffer sizes typically ranging from 400 to 4000 m( Reference Caspi, Sorensen and Subramanian 5 ). Road network buffers around the household( Reference Charreire, Casey and Salze 12 ) have also been applied, better representing the route an individual travels when shopping for food. A US study found that fast-food restaurants within a 1 km radial buffer of a household at census tract or postcode scale were detrimental to the BMI of men, however significant associations were not found at the smallest geographic scale (census block). Access to full-service restaurants, convenience stores and supermarkets was also investigated, finding significant associations with obesity risk at different levels of geographic scale for different food outlet types( Reference Fan, Hanson and Zick 11 ). Another study examining the relationship between supermarket access and area-level socio-economic characteristics found that associations differed depending on the geographic scale used to define a neighbourhood( Reference Barnes, Colabianchi and Hibbert 10 ). Despite its importance for informing urban planning policy such as zoning regulations, geographic scale is understudied and not well understood in food environment research( Reference Barnes, Colabianchi and Hibbert 10 ).
Second, spatial access to food outlets differs across socio-economic areas and is impacted by an individual’s transport mode( Reference Morland 13 ). Distances people travel to purchase food is influenced by their ability to access public or private transport( Reference Morland 13 ) and studies have shown that living proximally to healthy food outlets may be more important for people of low socio-economic status( Reference Feng, Glass and Curriero 14 , Reference Powell and Han 15 ). ‘Food deserts’, or local areas that have poor access to healthy and affordable food, may contribute to inequities in diet, BMI and non-communicable diseases( Reference Beaulac, Kristjansson and Cummins 16 ). In the USA, ‘food deserts’ in disadvantaged neighbourhoods are well documented( Reference Beaulac, Kristjansson and Cummins 16 , Reference Walker, Keane and Burke 17 ) and access to a car is identified as a determinant of household access to healthy and affordable food( Reference Ver Ploeg 18 ). In other high-income countries such as Australia and the UK, the evidence for food deserts is equivocal( Reference Beaulac, Kristjansson and Cummins 16 , Reference Cummins and Macintyre 19 ). ‘Deprivation amplification’ describes individual or household disadvantage compounded by area-level or neighbourhood disadvantage( Reference Macintyre 20 ). When individuals of low socio-economic status are living in food deserts, they are exposed to a double disadvantage as their individual-level disadvantage is amplified by the area-level disadvantage of poor healthy food access( Reference Beaulac, Kristjansson and Cummins 16 ). If they also lack access to public transport, the area-level disadvantage is compounded further. Understanding where poor healthy food and low public transport access overlaps with area-level socio-economic disadvantage may inform efforts to reduce place-based inequities.
Several Australian studies have investigated spatial access to supermarkets across socio-economic areas( Reference Ball, Timperio and Crawford 9 , Reference Winkler, Turrell and Patterson 21 ); however, these have not considered transport mode. A study conducted in forty-five suburbs in Melbourne, Australia found that participants in advantaged areas had more supermarkets within a 2 km road network buffer of their home and lived closer to the nearest supermarket than participants in disadvantaged areas( Reference Ball, Timperio and Crawford 9 ). In contrast, a Brisbane, Australia study found medium socio-economic areas had more supermarkets within a 2·5 km radial buffer of a census district centroid than advantaged or disadvantaged areas, and that disadvantaged areas had closest access to the nearest supermarket using a straight-line distance from centroid( Reference Winkler, Turrell and Patterson 21 ). Another study in outer Melbourne modelled travel time to supermarkets by car, bus and walking, and estimated the proportion of residents with good access using census population data. The majority of residents (>80 %) were found to be within an 8–10 min car journey to a supermarket, considered to be good access; and advantaged areas had closer access to supermarkets( Reference Burns and Inglis 22 ). While socio-economic areas and transport mode were considered, the study area was limited to one municipality and did not include supermarkets just outside the municipal boundary where residents are also likely to shop. Together, these studies highlight the considerable heterogeneity of food outlet access measures used to represent an individuals’ food environment.
Third, there is limited evidence about the implementation of urban planning policy in relation to the food environment. Despite calls for policy evaluation to build the evidence base, few urban planning policies are evaluated for their impact on health risks and even fewer for their impact on health inequities( Reference Friel, Akerman and Hancock 23 , Reference Cobb, Appel and Franco 24 ).
Finally, few studies have assessed built environment attributes, dietary intake, physical activity and weight status simultaneously( Reference Giskes, van Lenthe and Avendano-Pabon 25 , Reference Drewnowski, Aggarwal and Tang 26 ). The current study was informed by a conceptual framework that hypothesises the pathway through which urban planning policies influence built environment attributes in local areas, which in turn impact individual and psychosocial factors that influence dietary intake through to weight status and long-term health outcomes( Reference Murphy, Badland and Koohsari 27 ).
The context for the study was Melbourne, Australia; however, the approach and findings have potential wider application for other cities. With 75 % of the world’s population expected to be living in cities by 2050( Reference Giles-Corti, Vernez-Moudon and Reis 3 ), it is important to understand how urban planning can support healthier food environments across diverse socio-economic areas within cities. Melbourne, the capital of Victoria, is experiencing rapid growth and urbanisation on its perimeter, with the population expected to increase from 4·5 million in 2015 to 8·0 million in 2051( 28 ). Victorian planning guidelines for urban growth areas specify that 80–90 % of households should be located within 1 km of a town centre large enough to allow for provision of a supermarket( 29 ).
The aims of the current study were to: (i) investigate measures of supermarket access at a range of geographic scales to identify distances and food outlet densities most sensitive to optimal fruit and vegetable intake and BMI across strata of area-level socio-economic disadvantage; (ii) assess the spatial distribution of supermarkets across urban Melbourne by area-level socio-economic disadvantage and public and private transport access; and (iii) evaluate the implementation of an urban planning policy that provides guidance on spatial access to supermarkets.
Methods
The present study used cross-sectional data obtained from the Preventive Health Survey (PHS), a self-report population health data set with 9806 respondents collected in Victoria, Australia in 2012–13 by the Department of Health and Human Services. Data were cluster sampled from twenty-three local government areas (LGA) across Victoria. Primary approach letters for the PHS were mailed out on the Department of Health and Human Services’ letterhead with a participant information sheet, followed up with a computer-assisted telephone interview survey. The aim of the PHS was to assess the prevalence of nutrition, physical activity and smoking behaviours among adults (≥18 years) and the attitudes, beliefs and social norms that influence these behaviours( 30 ). In the present study, data from the twelve LGA in metropolitan Melbourne were selected, specifically those participants who resided in the Major Urban and Other Urban Sections of State, an Australian Bureau of Statistics’ classification that represents urban centres with a population of 1000 persons to 100 000 or more( 31 ). Of the 9806 PHS respondents, 6707 (68·4 %) could be geocoded to self-reported residential addresses. Of these, 3141 respondents lived in urban areas of the metropolitan Melbourne region. Thirteen respondents lived in areas that did not have an Index of Relative Socio-Economic Disadvantage (IRSD) score assigned and therefore were removed from the analysis, leaving a final sample of 3128 participants. The PHS received ethics approval from Department of Health and Human Services and the relevant university ethics committee.
Outcome variables
The outcome variables were self-reported vegetable intake, fruit intake and BMI. Participants were asked how many servings of vegetables and fruit they typically eat per day. Self-reported height and weight data were collected. For the BMI analysis, 239 participants with missing height and/or weight data, sixteen pregnant participants and twelve participants with extreme BMI (≥50 kg/m2) were excluded, consistent with previous studies( Reference Kim, Stein and Martorell 32 , Reference Larson 33 ).
Covariates
All covariates were identified a priori from associations found in previous studies and the conceptual framework. These were age, gender, education and income( 34 ), as well as the psychosocial and behavioural covariates detailed in the following sections. Participants with missing age and/or education data were removed from the dietary intake (n 57) and BMI (n 36) analyses.
Psychosocial covariates
For the dietary intake analysis, knowledge, self-efficacy, habit and social norm covariates were included in the models. Evidence suggests that knowledge and self-efficacy are predictors of adult fruit and vegetable intake( Reference Shaikh, Yaroch and Nebeling 35 , Reference Guillaumie, Godin and Vezina-Im 36 ). Participants were asked, ‘To maintain good health, at least how many serves of vegetables (or fruit) do health experts recommend you should eat per day?’ and ‘How confident are you that you could: eat at least 5 serves of vegetables (2 serves of fruit) on most days?’ The responses were collapsed into correct knowledge/not correct knowledge and confident/not confident. Habit is also a predictor of adult vegetable and fruit intake( Reference Guillaumie, Godin and Vezina-Im 36 , Reference Tak, te Velde and Kamphuis 37 ). Participant responses to ‘When you eat vegetable (or fruit), it’s usually in the same place and at the same time of day’ were collapsed into agree/not agree. Vegetable and fruit intake are significantly associated with injunctive and descriptive social norms for healthy eating. Injunctive norms refer to an individual’s beliefs about what is acceptable in his/her community and descriptive norms refer to an individual’s perception of the most usual behaviours of others( Reference Ball, Jeffery and Abbott 38 ). Participant responses to ‘The people who are important to you think that you eat enough vegetable (or fruit) each day’ and ‘Most people in my local area eat enough vegetable (or fruit) each day’ were collapsed into agree/not agree.
Behavioural covariates
For the BMI analysis, fast-food intake, sweet drink intake, smoking status and physical activity were treated as covariates in the models. Frequency of fast-food consumption, frequency of sweet drink consumption and smoking status (current smoker/not a current smoker) were included. Participants were asked about the number of times they did walking, moderate physical activity and vigorous physical activity, and the average session length for each. All responses were truncated at 180 min/d, following data truncation protocols of previous studies( 39 ), and missing data were excluded (n 113). A physical activity variable for total activity per week was created from the truncated data by summing walking, moderate and vigorous physical activity (vigorous minutes were doubled prior to combining) minutes per week, then categorising into no activity, <150 min/week and ≥150 min/week. Following guidelines that physical activity should be accrued on most days of the week( 40 ), a categorical variable was created: sedentary (0 min/week); insufficiently active (<150 min or ≥150 min and <5 sessions); and sufficiently active (≥150 min and ≥5 sessions).
Local food environment exposure variables
The primary exposure of interest was spatial access to supermarkets; however, measures for both supermarket and fast-food chain access were included in all models simultaneously to account for spatial co-occurrence of both outlet types( Reference Lamichhane, Warren and Puett 41 , Reference Barnes, Freedman and Bell 42 ). Supermarkets provide a wide range of affordable and quality fruit and vegetables( Reference Laraia, Hendrickson and Zhang 43 ), foods for a healthy diet( Reference Block and Kouba 44 ), and access to a supermarket is associated with healthier weight( Reference Zenk, Thatcher and Reina 6 ). Access to unhealthy food outlets can adversely affect fruit and vegetable intake through increased opportunity to purchase unhealthy foods, increased exposure to unhealthy food promotion, shifts in social norms and food preferences, and lower cost of fast food per energy unit compared with fruit and vegetables( Reference Laraia, Hendrickson and Zhang 43 , Reference Thornton, Bentley and Kavanagh 45 ).
Food outlet locations
A commercial data set of geocoded supermarket outlets in metropolitan Melbourne was purchased( 46 ). The branded supermarkets (Aldi, Coles, Costco, Foodworks, IGA, NQR and Woolworths) were verified by cross-checking against the supermarket company website and/or with Google Street View. Independent supermarkets were verified using Google Street View. Supermarket outlets were included in the data set if they existed in 2013, corresponding to the time when the PHS was collected, and comprised 742 outlets within 10 km of the metropolitan Melbourne boundary. Geocoded fast-food outlet data for McDonalds, Dominos, Subway, Hungry Jacks, Red Rooster and KFC were sourced from either www.zenbu.org or White/Yellow Pages listings and manually geocoded. All outlets were checked against company websites and/or with Google Street View. The fast-food chain data set comprised 648 outlets within 10 km of the metropolitan Melbourne boundary.
Previous studies have shown density of supermarkets to be significantly associated with fruit and vegetable intake at 2000, 3000 and 4000 m buffers( Reference Thornton, Crawford and Ball 47 , Reference Thornton, Pearce and Macdonald 48 ) and protective of BMI at 2000 m buffer( Reference Bodor, Rice and Farley 49 ). Density of fast-food outlets has shown significant associations with obesity risk at 1000 m buffer( Reference Fan, Hanson and Zick 11 ). Travel-mode survey data( 50 ) showed that the median distance respondents in Melbourne walked to a supermarket was 660 m, the median distance they drove was 2·7 km, and the median distance they travelled by all modes including public transport was 2·2 km. Informed by these studies, we selected 800, 1000, 1600, 2000 and 3000 m as geographical scales to calculate food outlet access measures.
Food outlet density, proximity and presence measures were calculated for each participant using GIS (geographic information system) software. The OD Matrix tool in the Network Analyst extension was used to calculate the distance to the closest supermarket and fast-food outlet, and the supermarket and fast-food density around each participant’s home, using road network buffers ranging from 800 to 3000 m. These buffer sizes reflected the range of distances people may travel to purchase food by walking, public and private transport. Road network data were sourced from Vicmap Transport( 51 ) and a pedestrian road network was created by including walking and bike paths for the analyses at 800, 1000 and 1600 m buffers but removing freeways. Fast-food outlets at freeway service centres and at Melbourne Airport were excluded from these analyses because they are not accessible by pedestrians. A car road network was used at the 2000 and 3000 m buffers. Proximity measures were calculated along both the pedestrian and car road networks.
Statistical analysis
Population-weighted means and se for participant’s demographics, outcome variables and covariates were reported. Data were stratified using the IRSD, which provides an area-level score for variables associated with disadvantage, including low income, unemployment, disability, single-parent households, low English-language proficiency and low levels of educational attainment. The IRSD aggregates the socio-economic census data of individuals within a geographic area( 52 ). When investigating area-level effects with an aggregated exposure such as IRSD, it is necessary to adjust for the corresponding individual-level socio-economic variables( Reference Subramanian, Glymour and Kawachi 53 , Reference Badland, Turrell and Giles-Corti 54 ); therefore, we adjusted for educational attainment and household income. To achieve an approximately even participant sample in each stratum, ‘high disadvantage’ comprised IRSD deciles 1–3 (n 1079); ‘mid disadvantage’ comprised IRSD deciles 4–6 (n 1082); and ‘low disadvantage’ comprised IRSD deciles 7–10 (n 967). Tests of statistical significance between strata were calculated to compare means and proportions.
Generalised estimating equations were used to model the associations between dietary intake, BMI and the food outlet access measures. The clustered nature of the data was taken into account by adjusting for clustering at the LGA level. Separate models were fitted for each outcome (i.e. vegetable intake, fruit intake, BMI). Univariate associations between each covariate and the outcome were assessed before final inclusion in the model. Following this analysis fruit intake was removed from the BMI model because it was not a significant predictor. Multicollinearity of covariates and exposure variables was assessed by calculating the variance inflation factor. No multicollinearity was present, with all variance inflation factors <2·00. Statistical significance was assessed at α<0·05. Analyses were conducted using the statistical software package Stata version 13.0.
Spatial analysis
Statistical areas level 1 (SA1) and mesh blocks (MB) are geographical areas defined by the Australian Bureau of Statistics. The SA1 administrative unit comprises approximately 400 persons( 55 ) and a MB, the smallest geographical area, contains approximately thirty to sixty dwellings( 56 ). Using the population-weighted centroid for each MB, the point where distance to all households was smallest( Reference Thornton, Pearce and Kavanagh 57 ), the proportion of all MB within 1 km of a supermarket was calculated for all SA1 across the study area. This was represented visually in ArcGIS version 10.3.1 to depict quintiles of supermarket access across urban Melbourne. Public transport access was calculated as the proportion of MB in each SA1 within 400 m of a bus stop, or 600 m of a tram stop, or 800 m of a train station, distances found in Victorian urban planning policy to support compact and walkable neighbourhoods( 58 ). Private transport access was calculated using Australian Bureau of Statistics’ vehicle ownership data at the SA1 level( 59 ). Both modes were collapsed into tertiles with the low access categories used in the analysis. Using GIS, supermarket access at 1 km was visualised with layers of area-level disadvantage( 52 ), low public transport access and low car ownership.
Results
The majority of participants were female (61 %), secondary educated (75 %), employed (52 %) and with an annual household income less than $AU 50 000 (46 %; Table 1). The mean age was 54·1 (se 0·31) years. Participants from high disadvantaged areas had a lower mean daily intake of vegetables (P=0·001) and a higher mean BMI (P=0·003) compared with those from less disadvantaged areas; however, there was no difference in fruit intake. Participants from high disadvantaged areas had a poorer knowledge of daily vegetable (P=0·002) and fruit intake guidelines (P<0·001); poorer self-efficacy for meeting daily vegetable intake (P<0·001); less healthful habit strength for both vegetable and fruit intake (P<0·001); and social norms related to poorer vegetable and fruit intake (P<0·001). Trends were also found for sweet drink consumption (P=0·048), physical activity (P<0·001) and smoking status (P<0·001) in the expected direction, with participants in high disadvantaged areas having less healthful behaviours.
Table 1 Descriptive statistics of participants by area-level disadvantage; adults (n 3128) from twelve local government areas across Melbourne, Australia, Preventive Health Survey 2012–13

RDI, recommended daily intake.
* P values determined by the adjusted Wald test for continuous variables and by the χ 2 test for categorical variables.
Descriptions of geographic measures of supermarket and fast-food chain access by area-level disadvantage are presented in Table 2. Participants in high disadvantaged areas had better access (P<0·001) to both supermarkets and fast-food outlets for all density measures compared with less disadvantaged areas. Participants in high disadvantaged areas also lived closer to the nearest supermarket (P<0·001) and fast-food chain (P<0·001) than those in less disadvantaged areas. Overall, 32 % of study participants had access to a supermarket within 1 km, ranging from 41 % in high disadvantaged areas to 23 % in low disadvantaged areas.
Table 2 Geographic measures of supermarket and fast-food chain access by area-level disadvantage among adults (n 3128) from twelve local government areas across Melbourne, Australia, Preventive Health Survey 2012–13

IQR, interquartile range.
* P values determined by ANOVA for food outlet density and Kruskal–Wallis test for food outlet proximity.
Associations of supermarket access with dietary intake and BMI across area-level disadvantage
Supermarket density and proximity were not associated with vegetable intake or fruit intake across most access measures and socio-economic areas. A statistically significant association was found for supermarket proximity and vegetable intake, and for supermarket density within the 800 m buffer and fruit intake; however, in both cases the effect size was too small (approximately 0·05 daily servings) to be of practical significance (see online supplementary material, Supplementary Table 1).
Supermarket access was protective of BMI for participants in the high disadvantaged areas within 800 m (P=0·040) and 1000 m (P=0·032) pedestrian road network buffers, but not for participants in mid or low disadvantaged areas. For each additional supermarket within the 800 m buffer, mean BMI decreased by 0·34 (95 % CI −0·66, −0·02) kg/m2 and within the 1000 m buffer, mean BMI decreased by 0·30 (95 % CI −0·57, −0·03) kg/m2. There were no significant associations within the 1600 m pedestrian road network buffer (Table 3). Associations between supermarket access and BMI along car road network buffers within 2000 and 3000 m were not significant across any stratum of disadvantage (see online supplementary material, Supplemental Table 1).
Table 3 Generalised estimating equations models of associations between BMI and measures of supermarket access among adults (n 2712) from twelve local government areas across Melbourne, Australia, Preventive Health Survey 2012–13

* Adjusted for age, sex, education level, income, vegetable intake, frequency of sweet drink consumption, frequency of fast-food consumption, physical activity, smoking, fast-food chain access and clustering at the local government area level.
Spatial distribution of supermarkets and transport mode
Figure 1 depicts the percentage of dwellings within each SA1 of urban Melbourne that have access to a supermarket within 1 km. In urban Melbourne, 43 % of dwellings were within 1 km of a supermarket. In growth area LGA, only 26 % of dwellings were within 1 km of a supermarket. Figure 2 shows areas of high disadvantage in urban Melbourne that experience poor supermarket (beyond 1 km) and low public transport or car access. Overall, 12 % of dwellings across Melbourne were in areas of high disadvantage and beyond 1 km to a supermarket. For growth area LGA, 19 % of dwellings experienced this double disadvantage. Approximately half the dwellings in two of Melbourne’s older outer-ring LGA had the double disadvantage of poor supermarket access and high area-level disadvantage (data not shown). When public transport access was considered, 2 % of all dwellings across urban Melbourne were in high disadvantaged areas and experienced poor supermarket and low public transport access, reaching a high of 12 % of dwellings in one outer-ring LGA. For growth areas, 4 % of dwellings were in geographic areas of multiple disadvantages with high area-level disadvantage, poor supermarket access and public transport access. In urban Melbourne, 2 % of all dwellings were in high disadvantaged areas and had poor supermarket and low car access.
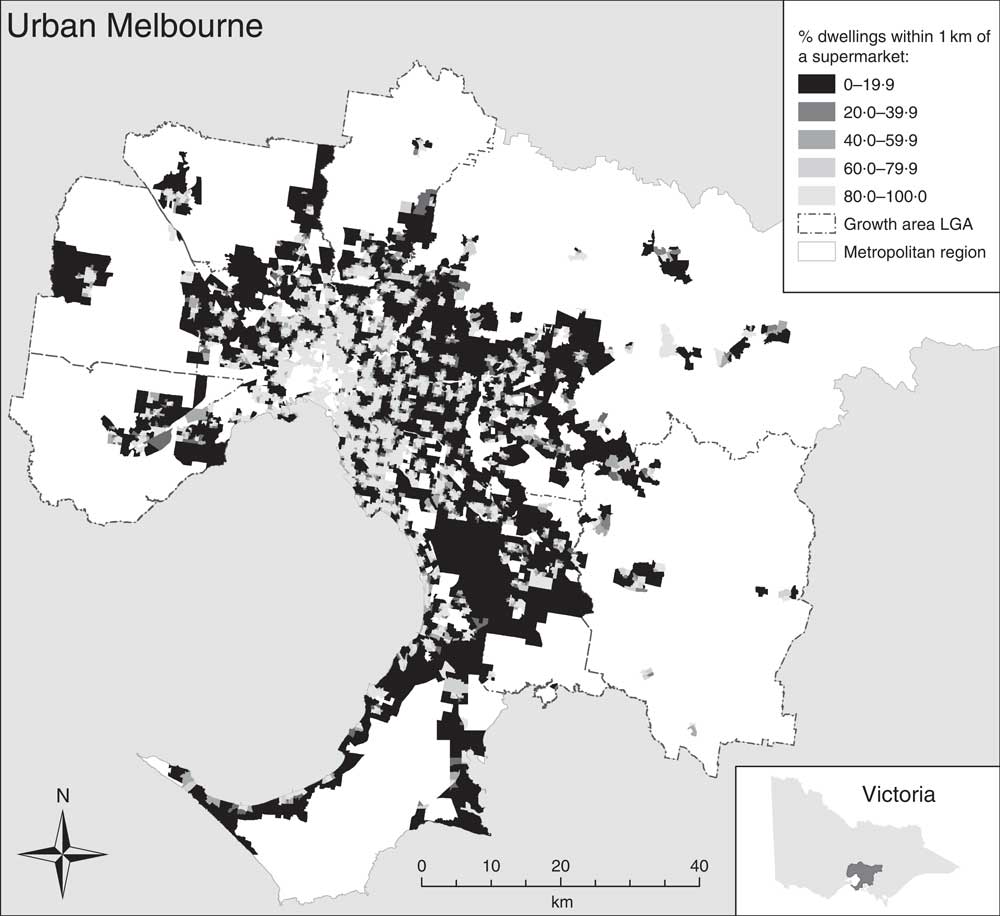
Fig. 1 Spatial distribution of supermarket access at SA1 level across urban Melbourne, Australia: percentage of dwellings within 1 km road network distance to the nearest supermarket (SA1, statistical areas level 1; LGA, local government area)
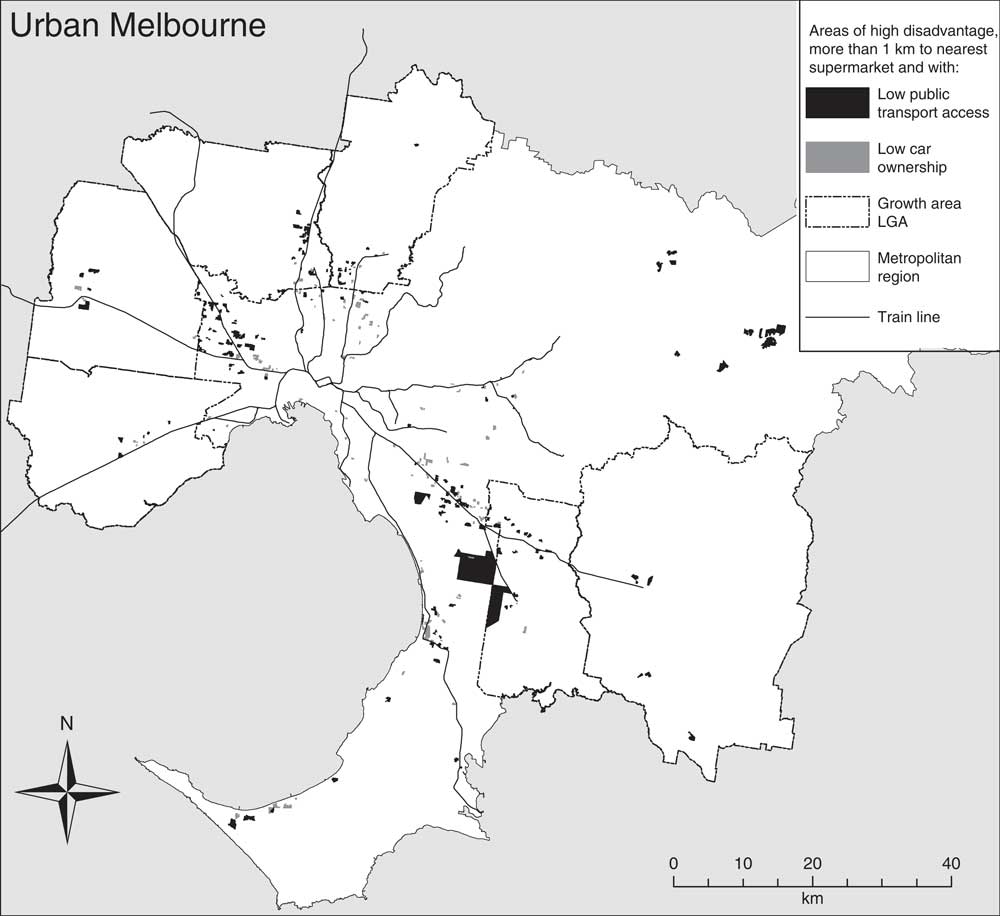
Fig. 2 Geographic areas of high disadvantage across urban Melbourne, Australia where distance to the nearest supermarket by road network is more than 1 km and with low public transport access or low car ownership
Sensitivity analysis
Sensitivity analyses on significant results in the BMI model were conducted to explore: (i) whether significant associations within the 800 and 1000 m buffers persisted if BMI was modelled as a categorical variable, obese (≥30·00 kg/m2) compared with normal-weight and overweight (18·50–29·99 kg/m2); and (ii) whether significant results within the 1000 m buffer were due to the influence of supermarkets within the 800 m buffer. First, when BMI was modelled as a categorical variable, supermarket density was associated with an approximately 15 % lower odds of obesity within both 800 m (OR=0·86; 95 % CI 0·78, 0·95) and 1000 m (OR=0·85; 95 % CI 0·76, 0·96) pedestrian road network buffers for participants living in high disadvantaged areas. Second, a ‘donut-buffer’ exposure measure was created that counted the supermarkets within 801–1000 m of participants’ address, following the method described in a previous study( Reference Gunn, King and Mavoa 60 ). The protective effect of supermarkets for people in disadvantaged areas persisted for participants within the 800 m pedestrian road network buffer of a supermarket but was not found for the 801–1000 m donut-buffer (see online supplementary material, Supplemental Table 2).
Discussion
The current study examined dietary intake, BMI and supermarket access at a range of geographic scales across areas of socio-economic disadvantage in urban Melbourne, Australia. Participants in high disadvantaged areas had lower vegetable intake and higher BMI compared with those in less disadvantaged areas, consistent with previous studies that find a social gradient in health risks and outcomes( 61 ). Participants in high disadvantaged areas had better access to supermarkets and fast-food outlets than those in less disadvantaged areas, a result that contrasts with the two earlier Melbourne studies where participants in disadvantaged areas had poorer supermarket access( Reference Ball, Timperio and Crawford 9 , Reference Burns and Inglis 22 ). However, given the present study was conducted across a larger study area and comprised 742 supermarkets, compared with fifteen and seventy-four supermarkets in the previous studies( Reference Ball, Timperio and Crawford 9 , Reference Burns and Inglis 22 ), our findings may more comprehensively and accurately represent supermarket access in urban Melbourne.
Supermarket density at 800 and 1000 m was protective of BMI for participants in high disadvantaged areas but not for those in mid or low disadvantaged areas. These results highlight the importance of investigating geographic scale and considering its differential impact across communities of socio-economic disadvantage. The effect size was greatest at the 800 m network buffer, which approximates a walkable distance of 10 min for adults( Reference Christian, Bull and Middleton 62 ) and is close to the median distance we identified a priori that people in Melbourne walk to supermarkets( 50 ). Sensitivity analysis suggests that supermarkets within the 800 m buffer may also be responsible for the significant association between supermarkets and BMI at the larger 1000 m buffer. Other studies have noted that proximal access to supermarkets may be more important for people in disadvantaged areas because they are less mobile and have access to fewer resources, including income, transport( Reference Powell and Han 15 ) and time( Reference Jabs and Devine 63 ). Our findings support the hypothesis that close access to supermarkets in disadvantaged areas provides opportunities to regularly purchase affordable fresh foods while reducing reliance on transport modes other than walking.
Counterintuitively, supermarket access was not associated with vegetable and fruit intake at a level of practical significance at any geographic scale or stratum of disadvantage. These results are consistent with a previous review that found supermarket access was consistently associated with lower BMI but not dietary intake( Reference Giskes, van Lenthe and Avendano-Pabon 25 ). It is possible that the null findings may be explained by the complexities in measuring dietary intake when it relies on participants’ accurate recall( Reference Giskes, van Lenthe and Avendano-Pabon 25 , Reference Laraia, Hendrickson and Zhang 43 ). Further, a larger sample and more comprehensive measures of a healthy diet may be required to detect associations. For example, a recent study of more than 9000 adults found significant associations between supermarket access and diet quality( Reference Mackenbach, Burgoine and Lakerveld 64 ). Future research could also include additional measures of dietary intake consistent with dietary guidelines including grains, lean meat and dairy( 65 ). However, the BMI analysis produced an expected result, possibly because the model comprehensively captured and adjusted for multiple influences impacting weight status, including intakes of fast foods and sweet drinks, smoking status and physical activity( Reference Giskes, van Lenthe and Avendano-Pabon 25 ). While the present study was concerned primarily with the influence of supermarket access on dietary intake and BMI, the gradient in the knowledge and self-efficacy (vegetables) covariates across socio-economic strata is important to note (Table 1), representing an opportunity for targeted public health interventions in disadvantaged areas, such as skill development and social marketing, to reduce inequities. Additionally, while knowledge, self-efficacy, habit strength (vegetable) and injunctive norms were consistently associated with dietary intake across socio-economic strata, habit strength (fruit) and descriptive norms were weak predictors of dietary intake (data not shown). In summary, the current investigation of supermarket access found that BMI was sensitive to both geographic scale and socio-economic disadvantage, and identified walkable distances of 800 and 1000 m as protective of BMI for participants in disadvantaged areas. Notably, the 1000 m buffer corresponds to the distance to supermarkets recommended in Victorian urban planning policy( 29 ). This threshold informed subsequent analysis of supermarket access.
Spatial analysis of the distribution of supermarket access across Melbourne using a 1 km distance threshold was investigated and small geographic areas of double disadvantage were identified where high area-level disadvantage was compounded by poor supermarket access. While most households were not vulnerable, a sizeable proportion of dwellings – 12 % or 187 000 households across urban Melbourne, and more than 60 000 households in growth area LGA – were in high disadvantaged areas and experienced poor supermarket access. When public transport opportunities were considered, most striking was the multiple disadvantages observed in older outer-ring municipalities. In addition, if frequency of public transport (particularly bus services) had been included, actual access to supermarkets would likely be worse( Reference Bader, Purciel and Yousefzadeh 66 ) given low public transport service levels in outer areas of Melbourne( Reference Currie, Richardson and Smyth 67 ).
The WHO calls on policy makers to understand and assess determinants of health inequities within cities, of global importance as cities experience rapid urbanisation and growth on urban fringes( 68 ). Our study evaluated the implementation of an urban planning policy providing guidance on supermarket access. In growth area LGA, only 26 % of dwellings were within 1 km of a supermarket, far less than the 80–90 % of dwellings suggested in the policy guideline( 29 ). We showed that access to health-promoting resources such as supermarkets and public transport was not evenly distributed across Melbourne, and identified geographic areas of disadvantage where inequities in access overlap. The socio-spatial patterning suggests that policy implementation should be prioritised in high disadvantaged areas across urban Melbourne, not just those within growth areas. The study highlights the utility of spatial research for identifying areas of multiple disadvantages where communities are most vulnerable and provides fine-grained data to inform urban planning policy and practice for healthier food environments.
We offer two key recommendations based on our study. First, we highlighted the importance of geographic scale in food environment research. The heterogeneity of food access measures in the literature is vast and few are theoretically or conceptually informed. It is important to identify the most appropriate geographic scale for optimal health outcomes that also considers transport mode and socio-economic areas. Second, our study showed that supermarket access had a differential impact on BMI across socio-economic strata, suggesting the importance of equity analyses in future food environment studies. The present study makes an important and timely contribution to the evidence on urban health, equity and food environments and demonstrates the potential of urban planning policy to improve health and reduce health inequities.
Our analysis had several strengths. First, we considered access to both supermarkets and fast-food chains simultaneously to account for spatial co-occurrence or clustering of fast-food outlets around supermarkets( Reference Lamichhane, Warren and Puett 41 , Reference Barnes, Freedman and Bell 42 ). Second, a rigorous approach to food outlet verification was adopted; validating commercial business lists with comprehensive cross-checking against company websites, White/Yellow Pages listings and Google Street View. Sourcing accurate and comprehensive spatial data across large geographic areas is noted as a limitation in many studies( Reference Moore and Diez-Roux 69 ). Third, food outlet exposure data and health outcome data were contemporaneous( Reference Thornton and Kavanagh 70 ). However, there were limitations to the data used in our study. The food environment exposure variables did not include greengrocers, therefore underestimating the true food environment where people purchase vegetables and fruit; and supermarkets were used as a proxy of healthy food access even though unhealthy foods can be purchased there. Neither did we analyse in-store food environments (e.g. price, promotion of food) and other food environment exposures (e.g. near workplaces or outdoor advertising) that are also likely to influence dietary intake and BMI. Third, MB population-weighted centroids were used to calculate the spatial distribution of supermarkets and public transport access. While variation in MB size is reduced by considering only urban areas in the metropolitan region, spatial uncertainly exists. Using the interquartile range as the measure of spread, the variation in the spatial extent of the MB area was 2·09 ha. The mean and median MB area were 4·72 and 2·94 ha, respectively (data not shown). Other data limitations include self-reported rather than objectively measured health data, and cross-sectional survey data that are unable to determine causality.
Conclusion
The current study found that the local food environment differentially impacted BMI of people living in disadvantaged areas. Replication of these findings in other rapidly growing cities could assist in developing urban planning guidelines aimed at improving access to healthy food outlets across socio-economic areas. The importance of the study is that it provides evidence to guide policy interventions and suggests a way forward to reduce inequities by prioritising implementation of healthy food and public transport access policies in disadvantaged areas. The study offers useful insights into methodology and findings for other food environments studies in urban settings.
Acknowledgements
Acknowledgements: The authors acknowledge the contribution of Rebecca Roberts for creating spatial measures in this analysis and Lillian Murphy for assistance with food outlet data verification. The authors acknowledge the Department of Health and Human Services Preventive Health Survey (PHS 2012–13), Melbourne, Victoria. Disclaimer: The opinions and analysis in this document are those of the authors and are not those of the Department of Health and Human Services Victoria, the Victorian Government, the Secretary to the Department of Health and Human Services, or the Minister for Health. Financial support: This work was supported by the National Health and Medical Research Council (NHMRC) Centre for Excellence in Healthy Liveable Communities (grant number 1061404). M.M. is supported by the Australian Government Research Training Program Scholarship; B.G.-C. is supported by an NHMRC Senior Principal Research Fellowship (grant number 1107672); H.B. is supported by an RMIT University Vice Chancellor’s Senior Research Fellowship. M.J.K. is supported by a JSPS Postdoctoral Fellowship for Research in Japan (grant number 17716). The NHMRC had no role in the design, analysis or writing of this article. Conflict of interest: None. Authorship: M.M. formulated the research question and study design, conducted the statistical and spatial analysis, and drafted the manuscript. M.J.K., H.B. and B.G.-C. contributed to the formulation of the research question and study design, data analysis and manuscript preparation. Ethics of human subject participation: This research received ethics approval from the Victorian Department of Health (No. 02/12) and The University of Melbourne Human Research Ethics Committee (Ethics ID 1441599.1).
Supplementary material
To view supplementary material for this article, please visit https://doi.org/10.1017/S1368980017002336


