


The disproportionate burden of chronic disease among resource-limited populations with barriers to healthy food access is a major public health concern( Reference Larson, Story and Nelson 1 ). Food access, income and education have been shown to be interrelated factors in obesity risk( Reference Dubowitz, Zenk and Ghosh-Dastidar 2 , Reference Ollberding, Nigg and Geller 3 ). However, current food desert research suggests that simply increasing supermarket locations is insufficient to alter dietary behaviour( Reference Dubowitz, Zenk and Ghosh-Dastidar 2 , Reference Burgoine, Mackenbach and Lakerveld 4 ). The overall food environment in the neighbourhood may affect consumption more than supermarket distance( Reference Fan, Hanson and Zick 5 ). Social norms, cultural preferences, time constraints, transportation access and competition from less-healthy food sources may also shape residents’ perceptions of their available food choices( Reference Pitt, Gallegos and Comans 6 – Reference Caspi, Kawachi and Subramanian 9 ). Thus, food access may be viewed as a multidimensional construct, encompassing availability, accessibility, affordability, accommodation and acceptability( Reference Caspi, Kawachi and Subramanian 9 ). Barriers related to any of these factors contribute to access disparities.
Interest in farmers’ market interventions to improve neighbourhood food access has grown rapidly in the past decade( Reference Young, Karpyn and Uy 10 , Reference Cole, McNees and Kinney 11 ) Farmers’ markets may combine geographic flexibility, price sensitivity, cultural and community linkages in ways that address multiple dimensions of access( Reference Sadler 12 – Reference Evans, Jennings and Smiley 14 ).
Tailoring farmers’ markets to address the access needs of low-income and ethnic minority communities, however, can be challenging( Reference Inda, Washburn and Beckham 15 ). Market managers need to understand neighbourhood demographics and engage community members, to ensure the market addresses their needs and preferences( Reference Colasanti, Conner and Smalley 16 ). Although most consumers view farmers’ markets positively as healthy food sources, price sensitivity for market produce varies strongly by income( Reference Freedman, Vaudrin and Schneider 17 ). For resource-constrained consumers, the ability to use federal food benefits at the market, and interventions that incentivize fruit/vegetable purchasing, can substantially impact accessibility( Reference Jones and Bhatia 13 , Reference Bertmann, Ohri-Vachaspati and Buman 18 , Reference Freedman, Flocke and Shon 19 ).
Farmers’ markets, however, are small businesses, not designed primarily as public health interventions( Reference Hodgins and Fraser 20 ). The infrastructure required to use federal food benefits at the market may be challenging for market owners to support( Reference Buttenheim, Havassy and Fang 21 ). While owners and managers value providing affordable healthy foods to all community members, market business plans may emphasize messaging and products that attract more affluent consumers( Reference Guthman, Morris and Allen 22 ). Racial, cultural and economic differences between rural farmers and low-income urban consumers can contribute to a perception that these markets are affluent or ‘white’ social spaces, reducing their accessibility to low-income and ethnic minority residents( Reference Larimore 23 ).
Working with farmers’ market programmes to build market access across these critical dimensions can be resource-intensive. Given limited resources, farmers’ market intervention efforts need to be strategic.
Study objectives
The goal of the present study was to develop and test a methodology to identify those markets in a geographic service area with the greatest impact on improving healthy food access for a region’s low-income population overall.
Study setting
The study area for this research, Honolulu County, Hawaii, USA, contains 953 000 residents within 5511 km2 (2128 miles2). Hawaii is a majority-minority state, with only 19 % of the state population meeting the Census definition of ‘non-Hispanic White alone’ and 23 % being mixed race. Asians (61·3 %), White (40 %), and Native Hawaiian or Pacific Islander (25 %) are the most common ethnicities reported( 24 ). Nearly a quarter (23·1 %) have incomes below 200 % of the federal poverty level (FPL) and approximately 30 000 households receive Supplemental Nutrition Assistance Program (SNAP) benefits( 24 ).
In Hawaii, 82 % of all farms are family farms and the majority (60 %) are minority-owned businesses( 25 ). There are fifty-five farmers’ markets within the county of Honolulu, nine of which accept electronic benefit transfer (EBT). While there are no data on the ethnic makeup of farmers who participate in farmers’ markets, it appears that the majority of participating farm vendors are drawn from Hawaii’s Native Hawaiian or South-East Asian immigrant communities. The markets themselves are managed run by diverse organizations, including private for-profit businesses, city and state agencies, community health centres and social-service non-profits.
Four of the nine markets offering EBT access are County-run. The remainder are supported by non-profits; two of these also offer EBT double-bucks incentive programmes.
Methods
A spatial analysis was conducted using ESRI’s geospatial processing program, ArcGIS version 10.6 (ESRI, Redlands, CA, USA). The current study did not require the approval of the University of Hawai‘i at Mānoa Institutional Review Board, since it involved only analysis of environmental and summary demographic data retrieved from public websites.
The goals of the analysis were to identify, for Honolulu County:
1. The number and percentage of low-income residents residing within either a 0·8 km (0.5mile) walk (urban areas) or an 8·0 km (5mile) drive (rural areas) of a farmers’ market.
2. The number and percentage of SNAP participants residing within either a 0·8 km (0.5mile) walk (urban areas) or an 8·0 km (5mile) drive (rural areas) of a farmers’ market with EBT.
3. The extent to which the percentage of low-income residents with access to a farmers’ market would increase if at least one farmers’ market were accessible to the ten block groups with the largest numbers of low-income individuals.
4. The extent to which the percentage of SNAP households with access to a farmers’ market with EBT would increase if at least one market with EBT were accessible to the ten block groups in the county with the largest numbers of SNAP households.
Data collection
A basemap and shapefiles displaying the geographic outlines of Honolulu County and census block group boundaries were downloaded from the US Census Bureau( 26 ). A GIS (geographic information system) layer containing farmers’ market locations as point data was retrieved from the State of Hawaii’s Office of Planning GIS website( 27 ). Because farmers’ markets change frequently, information contained in this layer’s attribute table was cross-checked against farmers’ market data obtained from the US Department of Agriculture, State and County websites, listings of farmers’ markets in local newspapers, and individual market webpages and advertising materials. New markets were geocoded and added to the layer and altered market locations were geocoded and used to replace outdated point data. Next, a field was added that identified presence/absence of an EBT terminal at each location. The resulting layer reflects the location and EBT status of all markets identified in Honolulu County as of May 2017.
Demographic data were then added to the analysis. Census block groups were chosen as the level of analysis as the smallest geographic census unit that provides both a point location identifying the weighted centre-of-population and aggregated sociodemographic data for the unit. A GIS file locating the census block group centre-of-population points was downloaded from the US Census Bureau( 28 ) and developed into a layer. American Community Survey 5-year estimates (2011–2015) of the number of individuals in each block group below 200 % of the FPL, and the number of households with SNAP benefits, were downloaded from the US Census Bureau and joined to the attribute table for this layer.
Because the distance one must travel to be considered to have access varies between urban and rural areas, a census-designated places shapefile was downloaded and used to identify urban v. rural areas. Rural areas were defined as all places outside urban areas with 50 000 or more people( 29 ).
A network data set, StreetMap USA, comprised of a TIGER 2000-based streets data set enhanced by ESRI, was downloaded from ESRI and used for the network analysis.
Data analysis
For the first analysis, a 0·8 km (0·5mile) buffer zone (walking distance) was calculated around markets located in urban areas, using an ArcGIS geoprocessing tool that creates buffer polygons a specified distance around input features. An 8·0 km (5mile) (driving distance) network analysis was calculated around markets located in rural areas, using the Service Area function of the ArcGIS Network Analyst extension, which calculates drive-time or distance along roads and creates polygons around input locations to the specified distance. The number of low-income individuals residing in a census block group whose centre-of-population did not fall within a market buffer zones was identified; these individuals were defined as lacking access to a market.
For the second analysis, the number of SNAP households within a census block group whose centre-of-population did not fall within the buffer zone of a market with EBT was identified; these households were defined as lacking access to a market with EBT.
For the third analysis, the ten block groups with the most low-income individuals were identified. A 0·8 km (0·5mile) circular buffer was mapped around the centre-of-population point for urban block group, and an 8·0 km (5mile) network analysis was calculated and mapped around the centre-of-population point for rural block groups. Lack of a market within the block’s access buffer was used to identify high-poverty block groups without access. The number of low-income individuals residing in the high-poverty block groups lacking farmers’ market access was used to determine the additional reach that could be obtained by targeting farmers’ market efforts at the ten highest-poverty block groups.
For the fourth analysis, the ten block groups with the highest number of SNAP households were identified, defined as urban or rural areas, and the 0·8 km (0·5mile) circular access buffers and 8·0 km (5mile) network analyses access buffers were mapped for these block groups. Block groups containing no market with EBT within the access buffer were identified as lacking access to a farmers’ market with EBT. The number of SNAP households residing in a top-ten block group without EBT access was used to determine the additional reach that could be obtained by targeting farmers’ market promotion efforts to ensure that there was a market with EBT services within reach of the ten block groups with the most SNAP households.
Results
The first analysis examined existing access of low-income individuals (below 200 % of the FPL) within the county of Honolulu to farmers’ markets (Fig. 1). In the county as a whole, three-quarters (74 %) of low-income individuals (below 200 % of the FPL) live within a reasonable distance (0·8 km (0·5mile) for urban areas; 8·0 km (5 miles) for rural areas) of a farmers’ market.
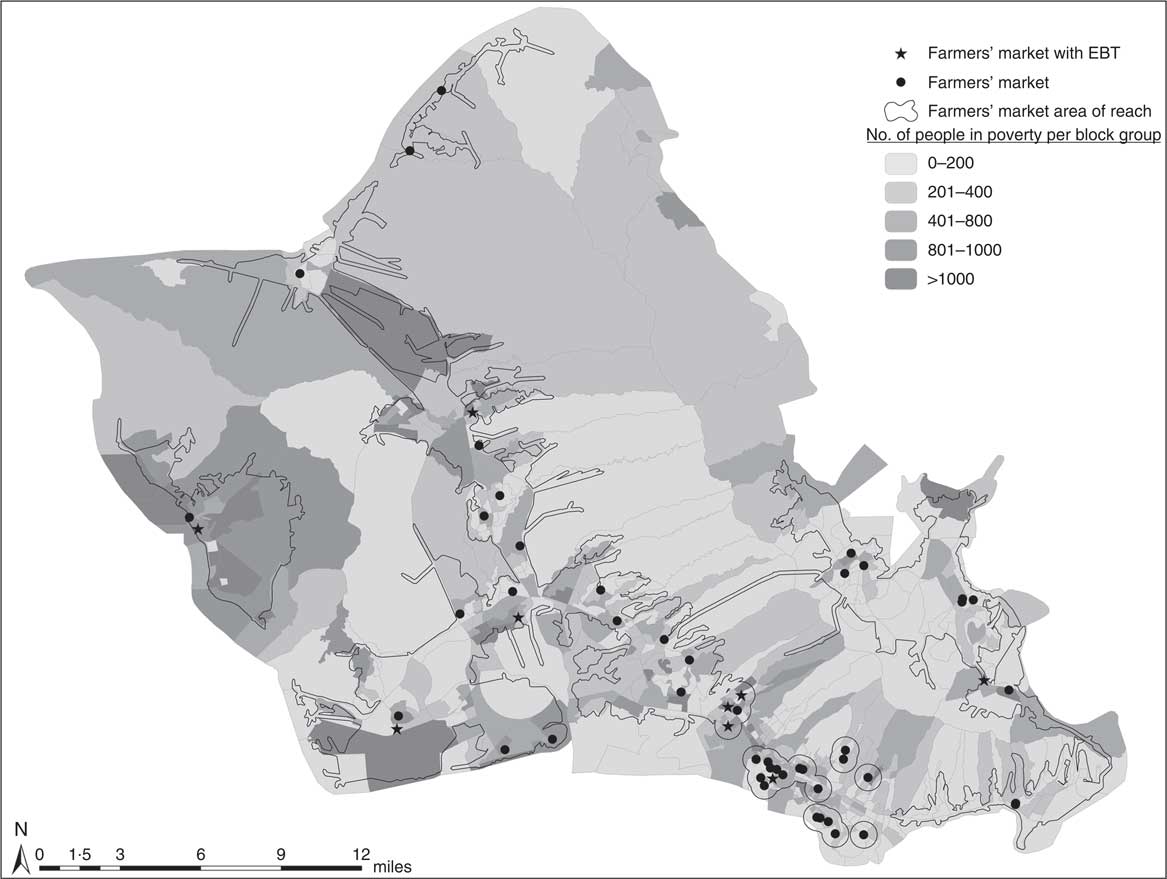
Fig. 1 Location and access boundaries of farmers’ markets and number of low-income individuals in census block groups, Honolulu County, Hawaii, USA, May 2017 (EBT, electronic benefit transfer; 1mile=1·6 km)
The second analysis examined existing access of SNAP participant households within Honolulu County to farmers’ markets that have EBT terminals where they can use their SNAP benefits to purchase food (Fig. 2). Less than half (44 %) of SNAP-participating households have access to farmers’ market with an EBT terminal.
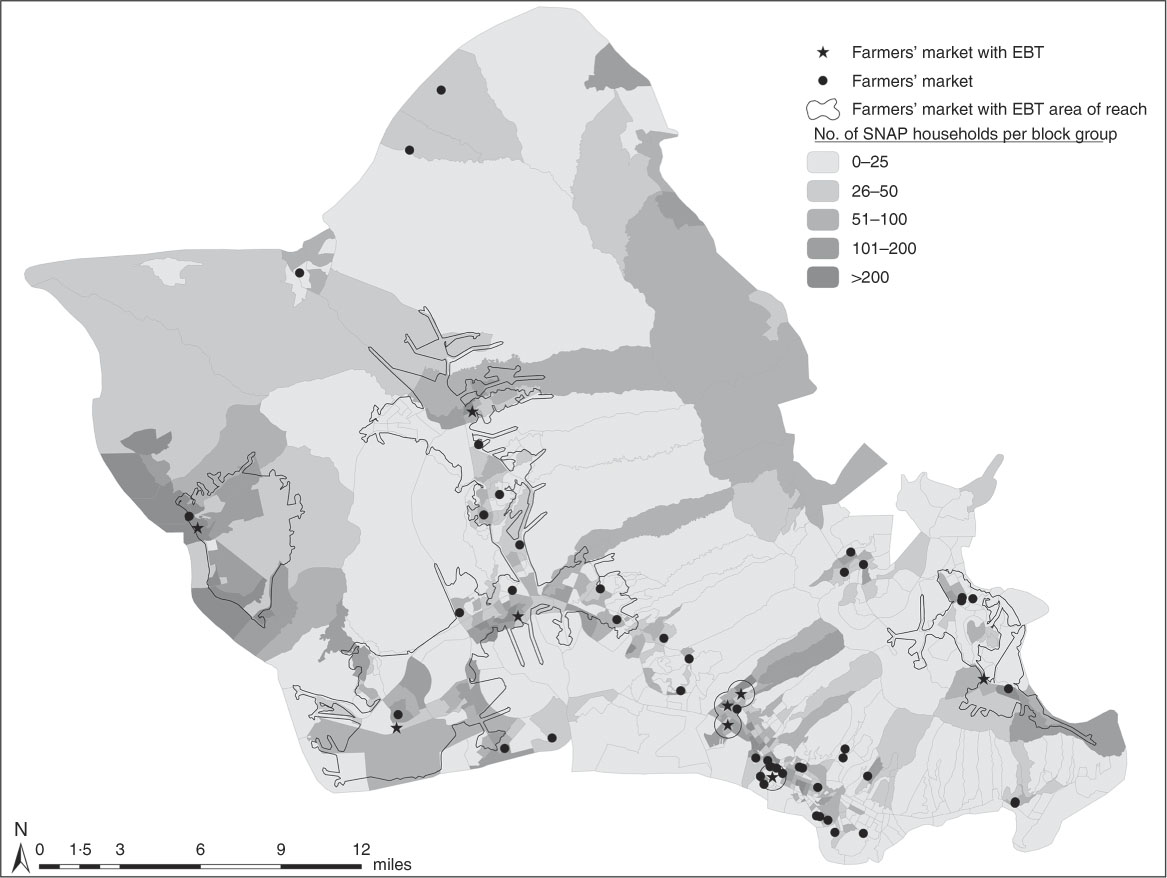
Fig. 2 Location and access boundaries of farmers’ markets with EBT and number of SNAP participants in census block groups, Honolulu County, Hawaii, USA, May 2017 (EBT, electronic benefit transfer; SNAP, Supplemental Nutrition Assistance Program; 1 mile=1·6 km)
The third analysis looked at the impact of targeting market promotion at areas where low-income individuals are most concentrated. Two of the ten block groups have no farmers’ market within reasonable reach. Placing a farmers’ market accessible to these two block groups increases the percentage of low-income residents with access by only 4 %. (No figure provided for this analysis, since it made no substantive difference in access.)
Finally, the ten block groups with the most SNAP-participating households were identified and analysed (Fig. 3). Six have no farmers’ market that accepts EBT within reasonable reach. If one market accessible to each of these six block groups were to start accepting EBT, the access to farmers’ markets with EBT for the county’s SNAP participants would increase by 23 % (going from 44 % to 67 %).
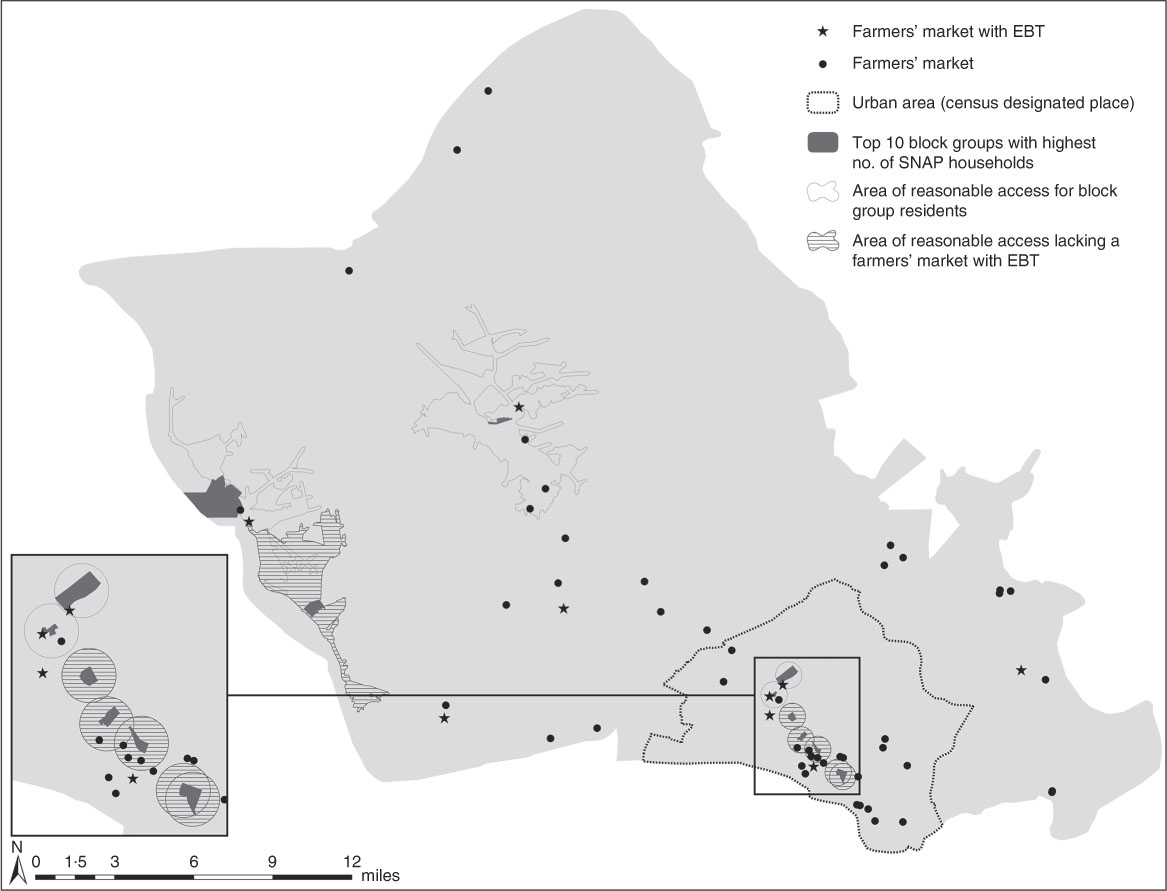
Fig. 3 Location of farmers’ markets with EBT and access boundaries of the ten census block groups with the most SNAP participants, Honolulu County, Hawaii, USA, May 2017 (EBT, electronic benefit transfer; SNAP, Supplemental Nutrition Assistance Program; 1mile=1·6 km)
Discussion
Farmers’ markets are appealing tools for programmes interested in improving healthy food access for low-income communities. However, markets that serve low-income communities, particularly those that provide EBT access or other financial incentives for market utilization, may need ongoing assistance with logistics, market promotion and community engagement( Reference Jones and Bhatia 13 , Reference Buttenheim, Havassy and Fang 21 ).
In the study area, EBT access at farmers’ markets was developed and supported by multiple organizations, each focused on their own missions and clients. Our study results suggest that this scattershot approach can result in substantial regional inefficiencies in EBT access at farmers’ markets. While distance to a market is only one of many factors that shapes household food access, it is an important element of the foodscape( Reference Black, Moon and Baird 30 ). Providing EBT access is a resource-heavy investment for markets; poor placement may cause market managers and programme administrators to question whether these services are worth the investment( Reference Hodgins and Fraser 20 ).
Our analysis suggests that viewing a county’s markets regionally, as a geographic system, and using this information to guide agencies in locating farmers’ market EBT services strategically could substantially improve access overall for the county’s low-income residents. In our study area, refocusing EBT-promotion efforts to target the six markets identified through this analysis could make a substantial impact in reducing access disparities for the County’s SNAP-participating households.
This type of analysis could help nutrition programme administrators and state or county agencies to strategize market partnerships, supporting programme sustainability and ensuring that resources are used to best effect. Double-bucks initiatives aimed at increasing the usage of SNAP benefits for the purchase of local fresh produce may particularly benefit from this type of strategic analysis in market selection, due to their relatively higher cost( Reference Jones and Bhatia 13 ).
Acknowledgements
Acknowledgements: The authors would like to gratefully acknowledge the Chronic Disease Prevention and Health Promotion Branch of the Hawaii State Department of Health, for its support of this research project. Financial support: The research received no specific grant from any funding agency in the public, commercial or not-for-profit sector. Conflict of interest: No known conflicts of interest exist. Authorship: O.V.B. developed the research concept, research questions and study methodology, and oversaw the manuscript preparation process, including overseeing the development of the literature review, directing the spatial analysis and map development, drafting the discussion and conclusion sections, and performing final editing/revision of all sections of the manuscript. G.W. participated in the study methodology development, conducted the spatial analysis of the data and GIS mapping of the results, and drafted the literature review, methodology and results sections. D.K. and D.S. participated in the analysis and interpretation of study results from the practitioner perspective, assisted in the drafting of the discussion section, and reviewed/edited the manuscript. D.C.N.-H. participated in the study methodology and map development, provided critical review/editing of all sections of the manuscript, and assisted in the preparation of the manuscript for submission. Ethics of human subject participation: Not applicable.


