


1 INTRODUCTION
The UTMOSTFootnote 1 is a major upgrade of the Molonglo Observatory Synthesis Telescope (MOST), which consists of two EW-aligned cylindrical paraboloid reflectors with a collecting area of 18 000 m2, situated in a valley 40 km east of Australia’s capital city, Canberra. The length of each cylindrical arm is 778 m, separated by a 15-m gap. It is a synthesis interferometer which was originally part of the transit instrument known as the Mills Cross (Robertson Reference Robertson1991), and is sensitive to right-hand (IEEE) circularly polarised radiation only. The telescope played a pivotal role in the early years of radio pulsar astronomy due to its large collecting area and compact design. Discoveries included the first association of a pulsar (in Vela) with a supernova remnant (Large, Vaughan, & Mills Reference Large, Vaughan and Mills1968) and 155 new pulsars from the prolific second Molonglo pulsar survey (Manchester et al. Reference Manchester, Lyne, Taylor, Durdin, Large and Little1978).
The MOST re-used some of the electronics and analogue systems from the Molonglo Cross and became a synthesis imaging facility. It processed a single 3-MHz channel of data streamed from each of 88 18.29-m elements of the telescope, operating at a central frequency of 843 MHz. Images were produced by the back projection of fan beams formed in real time using an analogue, hard-wired beamformer.
As a synthesis array, the MOST produced many important surveys and catalogues, including the Sydney University Molonglo Sky Survey (SUMSS; Bock, Large, & Sadler Reference Bock, Large and Sadler1999; Mauch et al. Reference Mauch, Murphy, Buttery, Curran, Hunstead, Piestrzynski, Robertson and Sadler2003), two Galactic Plane Surveys, MGPS-1 (Green et al. Reference Green, Cram, Large and Ye1999) and MGPS-2 (Murphy et al. Reference Murphy, Mauch, Green, Hunstead, Piestrzynska, Kels and Sztajer2007; Green, Reeves, & Murphy Reference Green, Reeves and Murphy2014), the MOST Supernova Remnant Catalogue (MSC; Whiteoak & Green Reference Whiteoak and Green1996), and the Molonglo Southern 4 Jy Survey (Burgess & Hunstead Reference Burgess and Hunstead2006) (the Southern counterpart to the Northern 3CR catalogue). It was particularly useful for rapid follow-up observations of transient sources. For example, it detected the prompt radio emission from supernova SN1987A (Turtle et al. Reference Turtle1987) and discovered radio emission from the micro-quasar GRO 1655-40 (della Valle, Campbell-Wilson, & Hunstead Reference della Valle, Campbell-Wilson and Hunstead1994). A systematic monitoring campaign of SN 1987A led to its re-detection as a radio supernova remnant (Staveley-Smith et al. Reference Staveley-Smith1992).
1.1. The SKAMP upgrades
In 2004, staged upgrades were proposed for the MOST as part of the ‘Square Kilometre Array Molonglo Pathfinder’ (SKAMP) project, to give the instrument its third major lease of scientific life. The first upgrade, SKAMP-1 (Adams, Bunton, & Kesteven Reference Adams, Bunton and Kesteven2004), replaced the analogue beamformer with an 8-bit digital correlator while retaining the same bandwidth and field of view. The second upgrade, SKAMP-2 (de Souza et al. Reference de Souza, Bunton, Campbell-Wilson, Cappallo and Kincaid2007), increased the system bandwidth from 3 to 30 MHz and the instantaneous field of view by a factor of 2 (by processing all 352 radio frequency outputs from the 352 independent outputs of the telescope rather than pre-combining them into 176 pairs). This involved laying over 200 km of optical fibre to 88 new 4-input digital receivers (RX boxes) in the field. Each RX box received its inputs from one 18-m element and the digital optical transmission from the RX boxes replaced the analogue coax cable used in MOST. Transmission of clocks to the RX boxes was also upgraded to optical fibre. The SKAMP-2 optical fibre outputs (from the 88 RX boxes) feed 22 polyphase filterbanks (PFBs) in the main control room. Each PFB is built on an ATCA board using Xilinx Virtex 4 FPGAs (Field Programmable Gate Arrays).
In late 2013, a new system design (the UTMOST) was proposed that could add greater flexibility to the signal processing chain by using software and commodity off-the-shelf servers and graphics processing units (GPUs) instead of the Field Programmable Gate Arrays proposed for use in SKAMP-2. Signals to the GPUs would be provided by the MOST cylindrical reflector and feed, and the SKAMP-2 RX boxes and FPGA filterbanks.
1.2. Radio astronomy in software
An emerging trend in radio astronomy over the past decade is the replacement of custom chips with commodity, off-the-shelf (COTS) signal processors such as GPUs and software. While less energy efficient than correlators using Application Specific Integrated Circuits (ASICs) or Field Programmable Gate Arrays (FPGAs), software correlators and signal processors are particularly inexpensive to develop. Changes to the configuration and operational modes are easy to implement after construction, as this is predominantly achieved in software. Examples of software correlators (or ‘coherent dedispersers’) currently in use for pulsar observations are CPSR2 (Bailes Reference Bailes2009) and GUPPI (DuPlain et al. Reference DuPlain, Ransom, Demorest, Brandt, Ford, Shelton, Bridger and Radziwill2008). Further, it has become straightforward to publish and distribute software instruments such as the pulsar processor dspsr (van Straten & Bailes Reference van Straten and Bailes2011) via online repositories, for installation by other users. Other examples of software baseband processing instruments are the VLBI correlator DiFX (Deller et al. Reference Deller, Tingay, Bailes and West2007) and xGPU (Clark, Plante, & Greenhill Reference Clark, Plante and Greenhill2012) a GPU-based correlator for ‘large-N’ interferometers such as the Murchison Widefield Array (MWA) (Tingay et al. Reference Tingay2013) and the Large-Aperture Experiment to Detect the Dark Ages (LEDA) (Greenhill et al. Reference Greenhill, Kocz, Barsdell and Clark2014).
A software backend for the MOST/SKAMP was proposed in early 2013, when its potential to become a powerful Fast Radio Burst (FRB) discovery engine working commensally with other observing modes was realised. The UTMOST retains the digital receivers and PFBs of the original SKAMP-2 system, but performs the rest of the signal processing on commodity CPUs and GPUs. The UTMOST Software Correlator has been designed to provide great processing flexibility and has commensal modes that enable simultaneous mapping, pulsar coherent de-dispersion, burst-searching, and baseband dump modes whilst employing novel interference mitigation strategies.
This paper describes the scientific capability and design of the UTMOST, the Swinburne University of Technology CPU/GPU backend solution for the MOST. In Section 2, we provide a brief description of all system components and their technical specifications. The site is subject to interference from domestic mobile phones and communications towers, and a simple technique to detect and attenuate their signals is described in Section 3. Examples of the major observing modes are provided in Section 4, the initial science programmes are described in Section 5, and our summary and future prospects are given in Section 6.
2 UTMOST SYSTEM DESIGN
The MOST consists of two parabolic cylinders 11.6-m wide and 778-m long separated by a 15-m gap. Parabolic cylinders enable a linear scaling of cost with collecting area but make the steering of the beam along its axis rather complex. The MOST uses 352 modules each comprising 22 ring antennas of circumference λ (36 cm) for operation at the central frequency of the 843 MHz feed. These ring antennas are coherently summed in resonant cavities along the focal line of the paraboloid, before being fed to 352 Low Noise Amplifiers (LNAs) (Robertson Reference Robertson1991). The signals from each LNA are filtered and down-converted before being 8-bit complex sampled in the field at 100 Megasamples s−1 (i.e. 200 × 106 B s−1). This is equivalent to Nyquist sampling a bandwidth of 100 MHz at a rate of 200 Msamples s−1. They are transmitted via multicore multimode fibre to digital PFBs in a central building 100-m north of the junction between the two arms of the telescope. Here the data stream is processed by the UTMOST software correlator backend. A block diagram of the system is shown in Figure 1 and the basic telescope parameters provided in Tables 1 and 2. Each of these stages is now described in more detail.
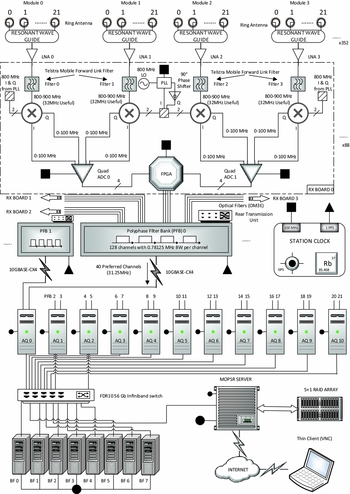
Figure 1. The UTMOST block diagram. From the ring antennas to the LNAs the system is identical to that used on the MOST. The SKAMP-2 upgrade includes the RX boxes and the polyphase filterbank (PFB), at which point the UTMOST backend taps off data via 10 Gb UDP packets using the CX-4 ports on the PFBs. The UTMOST uses commodity off-the-shelf computing hardware (marked ‘AQ’ and ‘BF’ nodes in the figure) and highly flexible software algorithms to achieve its signal processing requirements. AQ denotes the system’s ‘data acquisition’ nodes and BF the system’s ‘beam forming’ nodes.
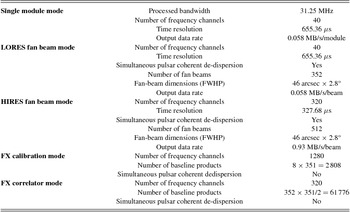
Table 1. UTMOST telescope parameters.

Table 2. Frequency resolution, time resolution, number of fan beams, and coherent de-dispersion properties for the UTMOST’s operational modes.
2.1. The front-end feeds
In order to steer the primary beam, each telescope section in the East–West direction uses an ingenious system of resonant ring antennas which are sensitive to right-hand (IEEE) circularly polarised radiation. The ring antennas are differentially rotated to steer the phased-array beam and coherently add incident radiation in groups of 22 antennas spanning 4.57 m of telescope length, producing 352 independent outputs called modules (176 on each arm). In the North–South direction, steering is comparatively simple, as each telescope arm can be mechanically tilted from the zenith, enabling observation of all parts of the sky south of declination δ = +17°.
The gain of each module is approximately G = 0.01 K Jy−1, where we include an effective aperture factor η = 0.5. The system temperature in the best performing modules is estimated, from observations of point source calibrators, to be T sys ~ 100 K. The ratio G/T sys presently can vary considerably (by up to an order of magnitude) from module to module, as legacy sources of self-generated RFI are still being identified and removed in the ongoing overhaul of the entire system. Currently, in a typical observation, the best modules achieve a system equivalent flux density (SEFD) of ~10 kJy, while a typical performance figure for the whole instrument is SEFD = 110 Jy, due to the combination of many factors, including incorrect phasing, ring antenna misalignment, self-induced RFI and cross-talk, RX box performance, and deformations in the telescope structure. Despite this range in performance, substantial verification science has been carried out during the upgrade (see Section 5).
The LNAs contribute ~20 K (as measured in the laboratory) to the total system temperature, with the remainder coming from a variety of sources including mesh leakage, spillover, and cable feeds. The effective gain of each module varies in a complex manner as it is steered East–West, a function termed the ‘meridian distance gain curve’ (Gaensler & Hunstead Reference Gaensler and Hunstead2000). This arises endemically in parabolic antennas because of multiple reflections along the cylinder which attenuate the signal to give an effective gain of <0.01 K Jy−1 per module. When added coherently on the meridian, the 352 modules of the antenna should combine to produce a gain of 3.5 K Jy−1 and an SEFD of ~30 Jy.
Four adjacent modules feed the independent RF signals from their LNAs via coaxial cable to one of 88 RX boxes. Prior to the RX boxes, the UTMOST signal chain is identical to the MOST. The MOST operated by coherently combining adjacent modules, whereas SKAMP-2 retains the independent inputs from each group of 22 ring antennas and brings back the digitised signals on optical fibre.
2.2. The digital receiver RX boxes and 3G filters
The 88 RX boxes apply a pair of commercially sourced analogue filters to each of the four inputs in series to filter out local telecommunications 3G and 4G up-links and produce four band-limited signals, currently from 819.971 to 851.221 MHz. These are down-converted with an 850 MHz local oscillator, and the complex signals are transmitted via four optical fibres using SerDes format (achieved on a Lattice FPGA) to the central processing building.
2.3. The polyphase filterbanks
Optical fibres carrying the digitised signal from sets of four RX boxes at a time (i.e. 16 inputs) are aggregated in the central processing building in a Rear Transmission Module (RTM), which transmits the data to PFBs. The PFBs have a CX-4 port, which is used to send 8k UDP ethernet packets to industry standard (copper) 10 Gb network interface cards (NICs). The PFBs use the SKAMP-2 hardware with firmware modified to bypass the cross connect, ‘corner-turn’ and fine filterbank operation. Only the 128 coarse filterbanks remain, providing data with a 781-kHz channel spacing. The original SKAMP-2 filterbanks were oversampled by a factor of 32/27, to reduce signal loss at the coarse channel edges. Two extra modes are implemented for UTMOST: a critically sampled 128-channel filterbank and a pass-through mode. Selection of the mode is programmable. The pass-through mode proved pivotal in debugging the more complex modes during system implementation, but the default run mode is the critically sampled one. The over-sampled mode is reserved for future use, and may help eliminate loss of sensitivity between frequency channels, at the cost of a slightly increased data rate. The filterbank modes use 12-tap polyphase filters and time-tag the data using the station 1PPS clock (1 pulse per second) as a reference. The data samples are requantised to 8-bit real, 8-bit imaginary. Currently, in ‘LORES’ mode, the system produces 128 channels, each 781 kHz wide, and 40 of these are passed to the data acquisition servers. In ‘HIRES’ mode, it produces 1280 channels, each 97 kHz wide, 320 of which are passed through to the data acquisition servers. In critically sampled mode, the data rate is 8 Gb s−1 per PFB.
To this stage in the system, the hardware is just the SKAMP-2 design. In UTMOST, the I/O FPGA has been reprogrammed to send the data to the servers via CX-4 ports using 10-Gb ethernet. The radio astronomy signal processing problem then becomes solely a computing one, and can be addressed in high-level programming languages.
2.4. The AQ servers
The data acquisition (AQ) servers are comprised of 11 COTS server-class machines each with a 6-core Intel CPU, 64 GB of RAM, a 128-GB SSD drive, a dual-port 10-Gb ethernet NIC, a 56-Gb Mellanox Infiniband card, and a GTX 690 graphics card (GPU).
The psrdada software libraryFootnote 2 is used to catch the 5 120-byte UDP packets. The UDP packets are taken from the NIC and placed in a ring buffer in the DDR3 memory of the server, from where they are moved via the PCIe bus to the GTX 690 GPU’s memory. A finite impulse response filter (FIR), comprising 25 taps using Hamming window coefficients, is applied in the GPU to compensate for fractional sample delays (both systemic and geometric), and an analysis of the spectral kurtosis of the incoming signal is applied to help detect deviations from RFI-free statistics (see Section 3 on RFI).
Each coarse PFB is synchronised to the observatory reference clock, which supplies a frequency standard and 1PPS signal. The coarse PFB uses these references to synchronise headers within the UDP packet timestamps to UTC time. The AQ servers parse the timestamps to insert the data into the ring buffer. The FIR filter is updated every 16 384 samples (or every 167.78 ms). The data are processed by the AQ GPUs in blocks of 16 384 samples, which sets the update rate. This is a convenient size for efficient data processing, while allowing us to exceed the update rate required to ensure appropriately delayed voltages for coherent beam formation.
Instrumental delays, phase offsets, and weights are retained for each antenna from the most recent calibration solution, which is typically performed with bright, unresolved, radio sources (generally brighter than 10 Jy). For calibration, eight modules are chosen from the array as reference antennas. These modules are chosen to be well-functioning high SNR units and are spread roughly uniformly along the array. The eight reference antennas are cross-correlated with all 352 modules, forming 8 × 352 integrated cross-power spectra. The inverse Fourier transform of the cross-power spectra yields the ‘lag function’, from which the instrumental delays and phase offsets are computed relative to a (arbitrary) reference antenna. Triplets of antenna pairs, on longer baselines (>50 m) are used to compute the closure delay and phase to reduce impact of local noise and RFI affecting the calibration solution. The weighting scheme for each antenna, used during tied-array beam forming, is computed as the inverse of its measured S/N, normalised to the array maximum. These delays and weights are applied by the AQ GPU pipeline, subsequent to applying geometric delays for the calibration source’s (known) position. Each server handles a total data rate of 16 Gb s−1.
Suspect data, as flagged by a measure of the spectral kurtosis, are replaced by Gaussian random noise of the same power as the input signal. This eliminates the worst of the 3G/4G phone transmissions. The fraction of flagged data as a function of time and frequency is retained so that down-stream data products can be adjusted if necessary for the impact on the system sensitivity. In the ‘single module’ mode of the instrument, it is possible to write out filterbank data to disk for subsequent processing. These data can be folded at the topocentric pulse period of a pulsar to test that any given module is working prior to any correlation attempts. We also search the known mobile phone handset transmission bands within our 820–851 MHz bandwidth for excess power, using a threshold determined from the binomial distribution and the number of frequency channels being monitored (Nita & Gary Reference Nita and Gary2010a). In high-frequency resolution mode (HIRES), the phone bands span a sufficiently large number of channels to make this an effective strategy: it is not used in our low-frequency resolution mode (LORES) as the number of channels is too low.
2.5. Frequency multiplexing
Radio interferometers combine the same frequency channels from different telescopes to form interference fringes. This is a high-bandwidth, computationally demanding task. In a standard hardware correlator (e.g. Escoffier et al. Reference Escoffier2007) this is usually done by constructing identical correlator ‘blocks’, each of which process some fraction of the total bandwidth after passage through a ‘corner-turn’ device. This device takes a series of time-major order data and brings together frequency-major order data for cross-correlation. In the UTMOST system, this task is performed on the servers using remote direct memory access (RDMA) transfers via FDR10 56 Gb infiniband using VMA Mellanox infiniband libraries. RDMA has the advantage that it does not impact on the CPUs during transfers. The choice of RDMA chunk size is driven by the GPU memory capacity on the AQ servers. Larger chunk sizes are more efficient. For LORES mode, this is 98 304 samples, and for HIRES mode it is 16 384 samples.
Post-cornerturn data are sent to the so-called ‘BF’ servers (described in detail in the next section) for both correlation and beam-forming modes. The major advantage of a software correlator with its appropriate ring buffers is that we can eliminate the need to achieve the challenging and time-consuming process of synchronisation in the Field Programmable Gate Arrays.
2.6. Beam former (BF) servers
After the corner-turn, the data are aligned in time in the RAM of the beam-forming servers, and the same frequency channels from every module are co-located. At this point, the servers can perform one of five operations: (i) detect and sum each voltage to form a single incoherent primary beam; (ii) add the complex voltages to form coherent tied-array beams (i.e. ‘fan beams’); (iii) cross-correlate each input against the others (an ‘X’ mode) to form interference fringes; (iv) produce fine channels that are themselves correlated for a limited subset of baselines (an ‘FX’ spectral-line mode); and (v) create multiple fan beams on the sky. The technical details of these operational modes are shown in Table 2 and discussed fully in Section 4.
The BF servers consist of eight COTS machines consisting of an 8-core Intel CPU, 4 ‘Titan X’ GPUs, 128 GB of RAM, a 440 GB SSD drive, and a single-port FDR 56-Gb ethernet (NIC), and were installed in 2015 May.
In the first operational mode, a power time series from the incoherent primary beam is written to a filterbank file, and is invaluable for RFI monitoring. In the other modes, voltages from a tied-array beam can be detected and written to a filterbank file for offline processing, or incoherently or coherently de-dispersed and folded into a pulsar profile. Coherent de-dispersion is performed upon the voltage tied-array beam using dspsr (van Straten & Bailes Reference van Straten and Bailes2011).
Pulsar folding and timing with a tied-array beam requires only minor compute resources, as the workload is distributed (in frequency) across the BF servers. These tasks are easily performed on CPUs. Pulsar timing is described in detail in Section 5.1.
Map making has been performed from fringes using standard packages such as Miriad and CASA (see Section 4.2.3). Maps have also been made from the time series data produced in filterbank format from the multiple fan beams but this is at an early stage of development (see Section 4.2.1).
2.7. Real-time data quality control
A software correlator like the UTMOST provides many opportunities for inspection of data and quality control in real time. For example, the Lattice FPGA on the RX boards can send data snippets (of a few kB) via Gb ethernet to the AQ machines, which can be plotted in real time as system bandpasses, time series, and data histograms on the observer’s web interface. Once per second, the UDP capture system sends 512 voltage measurements per channel to a ring buffer from which a range of plots can be produced, again available for scrutiny via a web interface.
At the other extreme, we are able to record long (10 to 120 s real time) bursts of the PFB raw voltages to the SSD drives of the AQ computers for subsequent offline processing. The software backend can either operate in real time on the real voltage streams or in an offline mode on the recorded voltages. The usefulness of this mode in debugging the software cannot be understated. A real-time correlator cannot usually play data back, and thus cannot perform ‘difference’ experiments or confirm the validity of new features on proven input data sets. During the commissioning phases of the UTMOST correlator, raw data captured in this way proved invaluable in debugging the system: it could be played back an arbitrary number of times.
3 RADIO FREQUENCY INTERFERENCE (RFI) EXCISION
Detecting, excising, and/or avoiding RFI has always been a major issue in radio astronomy and is becoming increasingly pervasive. UTMOST operates in a part of the spectrum used by two Australian telecommunications companies, and we often detect RFI from handsets, emitting typically in bandwidths of ~4 MHz, with greatly varying strength.
Tests early in the upgrade showed that it is rare that two or more 4-MHz handset bands are detectable at any given time, but that for about 10% of the time RFI from a single handset can be seen, most typically during the morning, late afternoon, and evening. Nevertheless, handset emission can be detected at any time, even during the much quieter hours from midnight to dawn. Handsets typically emit pulses of ~20 ms duration—these are used to register with the out-of-band base station towers operated by the phone companies. The nearest base stations in frequency to our operating bands are the 3G service at 890 MHz and the 4G service at 800 MHz. The ability to excise this highly prevalent RFI was crucial, or the science would be seriously compromised.
As with most radio observations, our system is noise-dominated, and good data are expected to be statistically well described by Gaussian random noise. Mobile phone transmissions lead to non-Gaussian distortions in the voltages and can be recognised by measuring the spectral kurtosis of the voltage stream to search for sudden deviations in the total power (Nita & Gary Reference Nita and Gary2010b). Since single modules operating at the target system temperature of ~100 K have an SEFD of about 10 kJy, it is extremely unlikely that genuine celestial signals will be deleted erroneously if we eliminate data with a significant spectral kurtosis statistic.
In Figure 2, we show the pulsar profile from an observation of the Vela pulsar where the raw voltages were written to disk and processed in two ways. In the right panel, our ‘standard’ RFI rejection procedure was enacted. On a module by module basis, the spectral kurtosis of the input voltages were assessed for deviations from Gaussianity. If above a threshold, the voltages were replaced by random noise generated in the GPU with the same standard deviation and mean as the uncorrupted data. The data were then coherently summed to form the pulsar profile. In the left panel, all of the input data were similarly summed and processed but without any RFI rejection algorithms. The UTMOST thus offers two levels of protection against RFI. Large impulsive bursts are removed on a module by module basis, and the weaker interfering signals are de-phased by the addition of the 352 input voltages.

Figure 2. Data taken on a single module of the Vela pulsar with a phone call occurring during the observation. In the left panel, the data were processed without RFI rejection, while in the right panel, the same data were processed using standard UTMOST RFI rejection procedures.
Our kurtosis and power-based detection methods currently search for interference on timescales from 1–20 ms. The procedure operates live on coarse frequency channels on the 352 modules of the telescope, but nevertheless only requires a fraction of the available GPU cycles on the GTX 690s, which are mainly used for delay computations.
This RFI rejection methodology is used when calibrating the instrument. Phone calls from certain distances/angles can still badly affect some segments of the data, but on the whole, calibration is still possible almost 100% of the time.
It might be assumed that all dispersed pulses detected with an interferometer were celestial, but it is clear that over limited bandwidths (typically the phone bands) some combinations of angle, distance, and mobile phone velocity produced dispersed pulses in some of the fan beams. These usually appear in a large number of fan beams or rapidly traverse the fan beams making them reasonably easy to separate from far-field signals (see Section 5.2).
Research is underway to determine if spatial filtering techniques (e.g. Barnbaum & Bradley Reference Barnbaum and Bradley1998) can be used to subtract the phone transmissions, possibly in real time, and to determine whether such sources of RFI can be used to phase calibrate.
4 OBSERVING MODES
In this section, we describe the major science modes in which UTMOST can currently operate. All of these modes are defined in software and trivial to switch between: such flexibility of the software has been key to the rapid commissioning.
4.1. Single module mode
In single module mode, bright pulsars can be detected by incoherently summing folded profiles from each of the 352 modules of the telescope. With the advent of our capability to form a tied-array beam using an arbitrary number of modules (see ‘Tied-Array Beam Mode’ below), incoherent timing mode was effectively superseded. We nevertheless retain the capability to observe in this mode, as it is a quick method of characterising the response of each module independently of phased-array modes. This has proved very useful during the commissioning phases, for example, as a means of identifying poorly performing modules. Table 2 shows the technical details about this and further modes described below.
4.2. Frequency multiplexed modes
We have been able to produce a tied-array beam using all 352 antennas and 40 frequency channels since the installation of the BF servers in 2015 May (Section 2.6). Tied-array beams can be formed at an arbitrary sky position to track a source, or it can be set to an arbitrary (fixed) position and allow objects to drift through the beam. Pulsars can also be folded live, according to their current ephemerides, while operating the tied-array beam (cf. Section 5.1). To date, more than 300 pulsars have been detected and timed in this mode, and more than 100 have been seen with individual pulse detections. We almost always operate this mode concurrently with fan-beam mode, to search for single pulses over the entire primary beam.
4.2.1. LORES fan-beam mode
Tiling of the primary beam is achieved with a set of 352 narrow ‘fan beams’, arranged uniformly and parallel to the meridian. These are generated by simply rotating the complex voltages to phase on to a set of locations on the sky, and as such are just instances of 352 ‘tied-array beams’. Their spacing can be arbitrarily set, and is typically set up to overlap near their half-power points (≈46 arcsec). In the direction parallel to the meridian, fan beams have the same extent as the primary beam (i.e. full-width half-power of 2.8°). Twice this number of fan beams has been trialled successfully, so that options exist to tile the primary beam more densely, or to cover a larger area of sky. More fan beams still would require additional hardware capacity.
Fan-beam mode has been extensively tested with pulsars, by allowing them to transit the primary beam, and was used in 2015 and 2016 to search for FRBs and single pulses from pulsars (Section 5.2). In Figure 3, a single pulse is shown that was detected in our pipeline from the bright pulsar PSR J1745–3040. Fan-beam mode can also be used to construct maps of the sky, in the same manner used for the SUMSS survey. A pipeline for the construction of maps from fan-beam mode data remains at an early stage of development. From 2016 November, we have also been able to form tied-array beams and fold on and time up to four pulsars in the primary beam area, fully commensally with fan-beam mode.

Figure 3. A single pulse from the pulsar PSR J1745–3040 detected in fan-beam mode at a trial width of 10 ms with a detection significance of 17 sigma. The trial dispersion measure was within 0.1 pc cm−3 of the pulsar’s catalogued value of 88.5 pc cm−3.
4.2.2. HIRES fan-beam mode
A high-frequency resolution and higher spatial resolution version of the fan-beam mode has been available since 2016 November. This ‘HIRES’ mode has eight times the frequency resolution, so that the effects of dispersion smearing are substantially reduced (the DM smearing is now only ~1.2 ms for DM = 1000 pc cm−3). Our three FRBs (Caleb et al. Reference Caleb2017) were found in the lower resolution mode prior to implementing this system. It has been the standard operational mode for FRB searches and pulsar timing since 2016 November.
4.2.3. FX calibration and correlation modes
The UTMOST has two main software correlator modes. In the FX mode, an FFT further channelises the input data to approx. 24 kHz wide, then eight reference modules are cross-multiplied with all 352 modules (cf. Section 2.4). This is primarily used for phasing the array when the calibration is very uncertain. In the X mode, all 352 modules are cross-correlated with each other, forming 352 × 351/2 baselines, but at the coarse frequency resolution of the PFBs. This mode uses Clark’s xGPU code (Clark et al. Reference Clark, Plante and Greenhill2012).
The output data products from the FX and X modes are averaged in time, usually between 20 and 60 s. The different numbers of output channels in FX and X modes also influence the total data rate, which on average is 10.0 MB s−1.
The number of floating-point operations required to cross-correlate 352 antennas is 8 FLOPS × 31.25 MHz × 67 716 baselines, or 15.44 Tflops. There are 32 TitanX GPUs in the BF nodes, such that spreading our 31.25 MHz across them means each one is only required to do 0.976 MHz of bandwidth, or perform at about 0.486 TFLOPS. Our GPUs have a theoretical performance of 6.144 TFLOPS, so there is ample headroom. We note that, in practice, a GPU code can rarely run at the theoretical peak performance, as real-world constraints impose themselves. Tests show that on our BF modes, where we get xGPU to process as much bandwidth as possible on a single GPU, TitanXs can process about 6.86 MHz each, at 3.39 TFLOPs, or at approximately 55% of the theoretical maximum of 6.144 TFLOPS. In daily operations, each BF server processes 3.9 MHz of bandwidth, with each GPU processing 0.976 MHz of bandwidth.
At our operating frequency of 843 MHz, and with a 1.6-km maximum baseline length, the bandwidth decorrelation for the 700-kHz channels is less than 1% over the 2.8° FWHP of the primary beam.
In Figure 4, we show the first synthesis map made with the UTMOST, showing a 1°1 field centred on the bright Southern radio source Fornax A. The data were taken in 2014 November and the image is compromised by the need to delete the short spacings (≲ 100 m) and some frequencies due to RFI. Only 25% of the telescope’s collecting area was used. Significant improvements have since been achieved and we can now correlate and take data in such modes from all 352 modules.

Figure 4. Fornax A, from a 9-h observation of the source made in 2014 November. Only 25% of the telescope collecting area and a small fraction of the bandwidth were used to produce this image. A nearby phase calibrator was observed every 2 h. The image noise is ~5 mJy beam−1 and is dominated by remaining artefacts rather than thermal noise. The contour levels are at −25, 25, 50, 75 . . . mJy beam−1. Short spacings were deleted to improve the image quality as these were compromised by RFI.
5 MAJOR SCIENCE GOALS AND SYSTEM PERFORMANCE
A major scientific driver for the UTMOST project is to discover FRBs, but as we will demonstrate, this does not need to come at the cost of other scientific objectives. Most, if not all of the science modes being implemented, will eventually operate commensally with our FRB search modes.
5.1. Pulsar timing
At present, the UTMOST typically times a single pulsar in the primary beam of the telescope, but we can time up to four pulsars at once. In a 24-h run, the UTMOST can obtain useful pulsar arrival times from ~100 sources and in a complete week, ~300 individual sources.
Detecting only right-hand circular polarisation limits the accuracy of arrival times on pulsars with complex and/or highly polarised profiles, as their profile is a function of meridian angle. On the bright and highly polarised millisecond pulsar PSR J0437–4715 timing residuals are clearly divergent at large hour angles, but nevertheless accurate to ~5 μs. The best pulsar for timing is the bright millisecond pulsar PSR J2241–5236, whose narrow pulse profile (see Figure 5) has permitted ~2 μs rms residuals (Figure 6). Our pulsar timing programme will be reported in Jankowski et al. (in preparation).

Figure 5. Pulse profile for the millisecond pulsar PSR J2241–5236 in a 60 min observation with the UTMOST telescope. The bandwidth is 31.25 MHz and the pulsar has been coherently de-dispersed.

Figure 6. Pulse timing residuals for the binary millisecond pulsar PSR J2241–5236 observed with the UTMOST. Despite the relatively poor effective system temperature, sub-microsecond residuals are not uncommon on this pulsar whose flux density varies considerably due to interstellar scintillation.
During the commissioning of UTMOST, seven glitches in pulsar pulse arrival times have been discovered (Jankowski et al. Reference Jankowski2015a, Reference Jankowski2015b, Reference Jankowski2016). This is an excellent illustration of the power of timing on near daily cadence at a facility like UTMOST.
A key achievement of the system is that both the source selection and the duration of the observation are largely automatic, governed by a series of Python scripts—the ‘Dynamic Scheduler’. For the fully commissioned system, the goal is to time several hundred pulsars per day. The Dynamic Scheduling system, commissioned in 2016 June, has increased the observing efficiency substantially, in terms of total numbers of pulsars observed to a particular accuracy. The scheduler can decide, on the basis of the accuracy of the timing measurement of the pulsar, or its signal-to-noise ratio, when to terminate the observation and move on to the next pulsar (lists of which are requested as pulsar observations near completion). Substantial increases in observing efficiency are anticipated as this system matures.
5.2. FRB search programme
FRBs are radio transients which are bright (~1 to 100 Jy ms), have high dispersion measures (300 to 2 500 pc cm−3) and short durations (of order a few ms) and a high sky rate of ≈2.5 × 10³ events/sky/day above a fluence of ≈2 Jy ms at 1.4 GHz (Keane & Petroff Reference Keane and Petroff2015). Only 25 bursts have been published to date, most of which have been found in pulsar search programmes operating at the Parkes radio telescope over the last decade. FRBs have considerable potential for probing the properties of the ionised Intergalactic Medium, and are of course highly intriguing in their own right (Macquart et al. Reference Macquart, Keane, Grainge, McQuinn, Fender, Hessels, Deller, Bhat, Breton, Chatterjee, Law, Lorimer, Ofek, Pietka, Spitler, Stappers and Trott2015). An FRB has been found to repeat (Spitler et al. Reference Spitler2016) and has been subsequently associated with a dwarf galaxy (Tendulkar et al. Reference Tendulkar2017) at a redshift of z ≈ 0.2.
UTMOST is operating an ongoing FRB search programme concurrently with other science modes [typically during pulsar timing, but also independently when the telescope is parked, similarly to the SUPERB project being operated at Parkes (Keane et al. Reference Keane2017)]. Our search methods and validation tests, and our first two search programmes for FRBs (at low sensitivity due to the ongoing commissioning) are described in Caleb et al. (Reference Caleb2016a).
A third survey, carried out from 2016 February to November, yielded three FRBs (Caleb et al. Reference Caleb2017), while the system was at only about 15% of its theoretical sensitivity. The detection of FRBs while commissioning the system is very encouraging for the future of the FRB search programme. If all modules performed at their optimal (SEFD of 10 kJy), we might expect to detect an FRB every week or so. This would constrain the spectral index distribution of the events and their cosmological distribution (e.g. Caleb et al. Reference Caleb2016b).
6 SUMMARY AND PROSPECTS
We have described the UTMOST, a new powerful backend for the Molonglo radio telescope. It is a hybrid solution to signal processing requirements, replacing a frequency multiplexer, a correlator, and fine filterbanks of the SKAMP-2 system, with software and commodity off-the-shelf hardware. The solution was inexpensive, rapidly deployed, and highly flexible compared to traditional approaches. In many senses, the telescope is robotic, using software to select both sources and the duration of the observation, based upon predefined rules and near real-time feedback from the data.
The telescope now has twice the field of view and ten times the bandwidth of the original MOST. The FX software correlator is superior to the MOST’s single-channel fan-beam multiplication interferometer (designed in the 1970s), and includes novel interference rejection algorithms.
Inherent to the solution is the capacity to run commensal modes. UTMOST can simultaneously make images, coherently dedisperse pulsars, perform real-time searches of coherent fan beams for dispersed single pulses out to dispersion measures of several 1 000 pc cm−3, excise radio frequency interference in real time, and offer a range of new diagnostic information on system performance. The record and playback capability facilitates rapid debugging of new modes. Pulsar timing and FRB searches have commenced, as well as searches for rotating radio transients and 1- and 2-D synthesis imaging.
ACKNOWLEDGEMENTS
We acknowledge the Australian Research Council grants CE110001020 (CAASTRO) and the Laureate Fellowship FL150100148. The Molonglo Observatory is owned and operated by the University of Sydney with support from the School of Physics and the University. We thank the referee for many insightful comments and suggestions. We acknowledge many varied contributions and advice from Jay Banyer, Mike Kesteven, Ron Koenig, Tom Landecker, Greg Madsen, Joseph Pathikulangara, Kathryn Plant, Ludi de Souza, Darshan Thakkar, Glen Torr, Jamie Tsai, John Tuthill, and Ding Yan. The late Professor George Collins allocated strategic funds for the purchase of the supercomputer in use at the facility from Swinburne University and was a passionate advocate for the project. The CSIRO Astronomy and Space Sciences division provided support for modifications to the SKAMP-2 design.


