


1. Introduction
Stem cells divide to regenerate themselves and to generate all of the cell- and tissue-types in a multicellular organism, such as plants. The continued ability to sustain stem cells within their micro-environment, the stem cell niche (SCN), is an important developmental characteristic that ensures proper tissue growth. The Arabidopsis thaliana root SCN contains four stem cell populations, the columella stem cells (CSCs), the cortex endodermis initial (CEI) cells, the vascular initial cells and the epidermal/lateral root cap initials, which form the entire root as a result of consecutive cell divisions (Dinneny & Benfey, Reference Dinneny and Benfey2008; Fisher & Sozzani, Reference Fisher and Sozzani2016). The different populations of stem cells are maintained by the quiescent center (QC) through the generation of short-range signals that repress cell differentiation (Clark, Fisher, et al., Reference Clark, Fisher, Berckmans, Van den Broeck, Nelson, Nguyen, Bustillo-Avendaño, Zebell, Moreno-Risueno, Simon, Gallagher and Sozzani2020; Pi et al., Reference Pi, Aichinger, van der Graaff, Llavata-Peris, Weijers, Hennig, Groot and Laux2015; van den Berg et al., Reference van den Berg, Willemsen, Hendriks, Weisbeek and Scheres1997). A known QC-derived signal is the homeobox transcription factor (TF) WUSCHEL-RELATED HOMEOBOX 5 (WOX5), which is specifically expressed in the QC and represses the differentiation of the CSCs (Petricka et al., Reference Petricka, Winter and Benfey2012; Sarkar et al., Reference Sarkar, Luijten, Miyashima, Lenhard, Hashimoto, Nakajima, Scheres, Heidstra and Laux2007). Specifically, non-cell-autonomous WOX5 maintenance of CSCs takes place through the repression of the differentiation factor CYCLING DOF FACTOR 4 (Pi et al., Reference Pi, Aichinger, van der Graaff, Llavata-Peris, Weijers, Hennig, Groot and Laux2015). wox5-1 mutants have increased QC divisions in roots and a decreased number of columella cell layers (Forzani et al., Reference Forzani, Aichinger, Sornay, Willemsen, Laux, Dewitte and Murray2014). In the QC cells, WOX5 controls divisions by restricting CYCD3;3 expression (Forzani et al., Reference Forzani, Aichinger, Sornay, Willemsen, Laux, Dewitte and Murray2014). Although the regulatory modules within the CSCs and QC are well characterized (Forzani et al., Reference Forzani, Aichinger, Sornay, Willemsen, Laux, Dewitte and Murray2014; Stahl et al., Reference Stahl, Grabowski, Bleckmann, Kühnemuth, Weidtkamp-Peters, Pinto, Kirschner, Schmid, Wink and Hülsewede2013), the molecular mechanisms by which WOX5 promotes stem cell fate of CEIs remain unknown.
Several proteins have been shown to positively regulate WOX5, such as ANGUSTIFOLIA (AN3)/GRF-INTERACTING FACTOR 1 (GIF1). AN3 is expressed in the root meristem with a high peak in expression in the SCN and QC and plays a role in maintaining QC identity (Ercoli et al., Reference Ercoli, Ferela, Debernardi, Perrone, Rodriguez and Palatnik2018). However, whether AN3 function is dependent on WOX5 and whether AN3 has a regulatory role outside the QC in the SCN is not understood. Additionally, AN3 was shown to regulate the expression of SCARECROW (SCR) (Ercoli et al., Reference Ercoli, Ferela, Debernardi, Perrone, Rodriguez and Palatnik2018), which along with SHORTROOT (SHR) regulates the expression of the D-type Cyclin CYCLIND6;1 (CYCD6;1) to control the CEI divisions to generate the cortical and endodermal tissue layers (Cruz-Ramírez et al., Reference Cruz-Ramírez, Díaz-Triviño, Blilou, Grieneisen, Sozzani, Zamioudis, Miskolczi, Nieuwland, Benjamins, Dhonukshe, Caballero-Pérez, Horvath, Long, Mähönen, Zhang, Xu, Murray, Benfey, Bako and Scheres2012; Gallagher & Benfey, Reference Gallagher and Benfey2009; Long et al., Reference Long, Smet, Cruz-Ramírez, Castelijns, de Jonge, Mähönen, Bouchet, Perez, Akhmanova, Scheres and Blilou2015; Nakajima et al., Reference Nakajima, Sena, Nawy and Benfey2001; Sozzani et al., Reference Sozzani, Cui, Moreno-Risueno, Busch, Van Norman, Vernoux, Brady, Dewitte, Murray and Benfey2010). Specifically, SHR moves from the vasculature to the CEI, where it forms a complex with SCR to transcriptionally regulate CYCD6;1.
The regulatory interactions between the different cell types of the root SCN are complex and non-intuitive, so computational tools are essential to understanding systemic behaviour. Developmental processes such as auxin flow within the root and lateral shoot branching have been mathematically modelled to better understand and predict system-level behaviour (Canher et al., Reference Canher, Heyman, Savina, Devendran, Eekhout, Vercauteren, Prinsen, Matosevich, Xu, Mironova and De Veylder2020; Prusinkiewicz et al., Reference Prusinkiewicz, Crawford, Smith, Ljung, Bennett, Ongaro and Leyser2009). Some models implement different scales of the system to simulate, understand and predict system-level behaviour as a whole. For example, a mathematical model that simulates and predicts the induction of shoot branching during plant development included on a molecular scale auxin flux across metamers (i.e., smaller segments of the stem) and on an organ scale the formation of metamers of the stem and lateral branches (Prusinkiewicz et al., Reference Prusinkiewicz, Crawford, Smith, Ljung, Bennett, Ongaro and Leyser2009). Modeling systems and allowing exchange of information across different scales can also be achieved by combining agent-based models (ABM) with continuous models, such as ordinary differential equations (ODEs) or partial differential equations (Cilfone et al., Reference Cilfone, Kirschner and Linderman2015). ABMs consist of autonomous ‘agents’ that dynamically interact and show responsive behaviour through a set of simple rules. ABMs have, for example, been used to simulate plant-herbivore interactions (Radny & Meyer, Reference Radny and Meyer2018). However, within the molecular plant biology field, these models are not widely used, despite their capacity to capture system-level behaviour. On the other hand, continuous models such as ODEs have been applied to infer gene regulatory networks (Krouk et al., Reference Krouk, Mirowski, LeCun, Shasha and Coruzzi2010; Yao et al., Reference Yao, Hsu and Chen2011) and predict dynamic gene expression patterns (Clark, Fisher, et al., Reference Clark, Fisher, Berckmans, Van den Broeck, Nelson, Nguyen, Bustillo-Avendaño, Zebell, Moreno-Risueno, Simon, Gallagher and Sozzani2020). These models are computationally intensive and lack the capability to capture system-level behaviour but can model complex dynamic responses over time. Hybrid models are created when, for example, continuous models are used within a discrete ABM to describe a part of the system. These hybrid models are usually multi-scale models, given that the continuous models often describe a dynamical response on a different spatiotemporal scale than the ABM (Cilfone et al., Reference Cilfone, Kirschner and Linderman2015).
In this study, we combine cell-type-specific gene expression data and experimental data with network inference and parametric models to better understand how WOX5, AN3, SCR, and SHR coordinately regulate CEI stem cell divisions. We transcriptionally profiled CEI cells in wild-type and wox5-1 roots, as well as QC cells and non-stem cells. We found that AN3 was among the most CEI-enriched genes. Additionally, the loss-of-function of wox5 or an3 resulted in an extended expression pattern of the CEI stem cell marker CYCD6;1 into the cortex and endodermal cells. We built an ODE and agent-based hybrid model linking cell behaviour, specifically cell division, to gene expression dynamics represented by ODEs of WOX5, AN3, SCR, SHR, and CYCD6;1. Our hybrid model allowed for the exchange of information between a cellular scale (i.e., division of stem cells) and a molecular scale (i.e., regulatory interactions at single cell level). In the hybrid model, the mobile proteins, WOX5 and SHR, regulated the expression of downstream proteins non-cell autonomously in specific cell-types. The communication between cell types and dynamic expression patterns modelled experimentally validated temporal stem cell divisions.
2. Results
2.1. WUSCHEL-RELATED HOMEOBOX 5 regulates cortex endodermis initial-specific genes
The functional role of WOX5 in the QC and CSC has been extensively reported while its role in stem cell populations remains largely unknown. WOX5 is specifically expressed in the QC cells, however, the protein moves to the CSCs and the vasculature initials and has been shown to have a non-cell autonomous role in these cells (Clark et al., Reference Clark, Buckner, Fisher, Nelson, Nguyen, Simmons, de Luis Balaguer, Butler-Smith, Sheldon, Bergmann, Williams and Sozzani2019; Pi et al., Reference Pi, Aichinger, van der Graaff, Llavata-Peris, Weijers, Hennig, Groot and Laux2015). To determine whether WOX5 is also able to move from the QC cells to the QC-neighbouring CEI cells and regulate downstream targets, we used scanning fluorescence correlation spectroscopy (scanning FCS). Five-day-old wox5xpWOX5:WOX5-GFP plants were analysed with scanning FCS to evaluate the directional movement of WOX5 proteins between these two cell types. Line scans were taken over time from a region spanning the CEI and adjacent QC (Figure 1a). This analysis resulted in a quantitative assessment of movement and allowed us to calculate the movement index (MI). We found that WOX5 moved bidirectionally between the QC and the CEI (MI = 0.90 ± 0.04 from QC to CEI, MI = 0.83 ± 0.05 from CEI to QC, n = 20) (Supplemental Table 1). As a comparison, within the SCN, free GFP and immobile 3xGFP have a moving index of ~0.7 and ~0.25, respectively (Clark et al., Reference Clark, Hinde, Winter, Fisher, Crosti, Blilou, Gratton, Benfey and Sozzani2016).

Figure 1. Characterization of WUSCHEL-RELATED HOMEOBOX 5 (WOX5) in the cortex endodermis initial (CEI). (a) (Top left) Confocal image of a region in the wox5xpWOX5:WOX5-GFP root that spans the quiescent center (QC) and CEI and is used for pair correlation function (pCF). The location and direction of the line scan (orange dashed line) are marked onto the image. (Bottom left) pCF carpet image of the top image. Orange, dashed region represents an arch in the pCF carpet, which indicates movement across the cell wall. (Right) Movement index of wox5xpWOX5:WOX5-GFP between the QC and CEI. (b) Confocal image of wox5xpCYCD6;1:GUS-GFP roots. (c) The number of CEI and CEI-like cells expressing pCYCD6;1:GUS-GFP. (d) Percentage of divided and undivided CEI cells in pCYCD6;1:GUS-GFP and wox5xpCYCD6;1:GUS-GFP roots. Data are presented as mean ± SEM (standard error of mean). * = p < .05 (c, d: Wilcoxon Chi-square test).
To explore the potential functional role of WOX5 in CEI, we examined the expression pattern of the CEI-marker pCYCD6;1:GUS-GFP in wox5. The marker showed an expression pattern that extended into the cortex and endodermal cells (Figure 1b,c). This expanded expression of CYCD6;1 suggests that the 4–5 cells proximal of the CEI, further referred to as CEI-like cells, have gained stem cell-like characteristics and also indicates that WOX5 controls CYCD6;1 expression to the CEI (Figure 1b,c). We then explored the role of WOX5 in limiting CYCD6;1 expression and, thus, controlling CEI divisions. To this end, we quantified the number of undivided and divided CEI cells in 4-, 5- and 6-day-old wox5 and wild-type roots. This quantification showed that wox5xpCYCD6;1:GUS-GFP roots had an increase of 23.43% and 25.33% divided CEI cells (p = .0495, Wilcoxon test) compared to the wild type (WT) at 4 and 6 days, respectively (Figure 1d). Taken together, these results support a functional non-cell autonomous role for WOX5 in the CEI.
2.2. Network inference and node importance analysis to identify functional candidates
To unravel the transcriptional events regulating the extended expression pattern of CYCD6;1 in the wox5 mutant background, a transcriptome analysis was performed on FACS-sorted GFP positive cells from pCYCD6;1:GUS-GFP, wox5xpCYCD6;1:GUS-GFP and pWOX5:GFP, and the meristematic cells from pWOX5-GFP that do not express the marker (referred to as non-stem cells) (Supplemental Table 2). Compared to the cells not expressing the pWOX5-GFP marker, 163 genes were differentially expressed (FDR < 0.05) in wild-type CEI cells and 213 genes in the CEI and CEI-like cells from the wox5 mutant. In total, the union of these two analyses identified 330 differentially expressed genes (DEGs) in CEI and CEI-like cells, of which 159 DEGs (48.18%) have previously been shown to be expressed in the SCN and 53 genes were enriched in the CEI (Clark et al., Reference Clark, Buckner, Fisher, Nelson, Nguyen, Simmons, de Luis Balaguer, Butler-Smith, Sheldon, Bergmann, Williams and Sozzani2019). We hypothesized that the regulatory genes underlying CYCD6;1 expression should be differentially expressed in the CEI cells (CYCD6;1 expressing cells) of the wild-type and wox5 roots and thus focused on the genes overlapping between these two sets of DEGs (Figure 2a). In total, 46 genes overlapped between the CEI and CEI-like cells, which equals an enrichment of 35.8 (p < 4.431e-59, Exact hypergeometric probability). To identify key regulatory proteins among these 46 genes, we predicted causal relations between the TFs and downstream genes with high accuracy and constructed a gene regulatory network. We inferred the causal relations by leveraging our transcriptome data with a regression tree algorithm RTP-STAR (Figure 2b) (Huynh-Thu et al., Reference Huynh-Thu, Irrthum, Wehenkel and Geurts2010; Spurney et al., Reference Spurney, Van den Broeck, Clark, Fisher, de Luis Balaguer and Sozzani2020; Van den Broeck et al., Reference Van den Broeck, Gordon, Inzé, Williams and Sozzani2020). The inferred network contained 20 nodes, of which four are TFs (Figure 2b). These four TFs are as follows: WIP DOMAIN PROTEIN 4, which is shown to be important for root initiation, INDOLE-3-ACETIC ACID INDUCIBLE 33, AN3/GIF1, which is a known regulator of cell proliferation, and an unknown TF (AT1G75710). Among the inferred AN3 targets, we confirmed with TChAP data that three targets (AT1G75710, FLA10 and GBSS1) were directly bound by AN3 (Vercruyssen et al., Reference Vercruyssen, Verkest, Gonzalez, Heyndrickx, Eeckhout, Han, Jégu, Archacki, Van Leene, Andriankaja, De Bodt, Abeel, Coppens, Dhondt, De Milde, Vermeersch, Maleux, Gevaert, Jerzmanowski and Inzé2014). Network inference allowed us to identify potential functionally important genes, however, we still needed to pinpoint the biological important genes within the network.
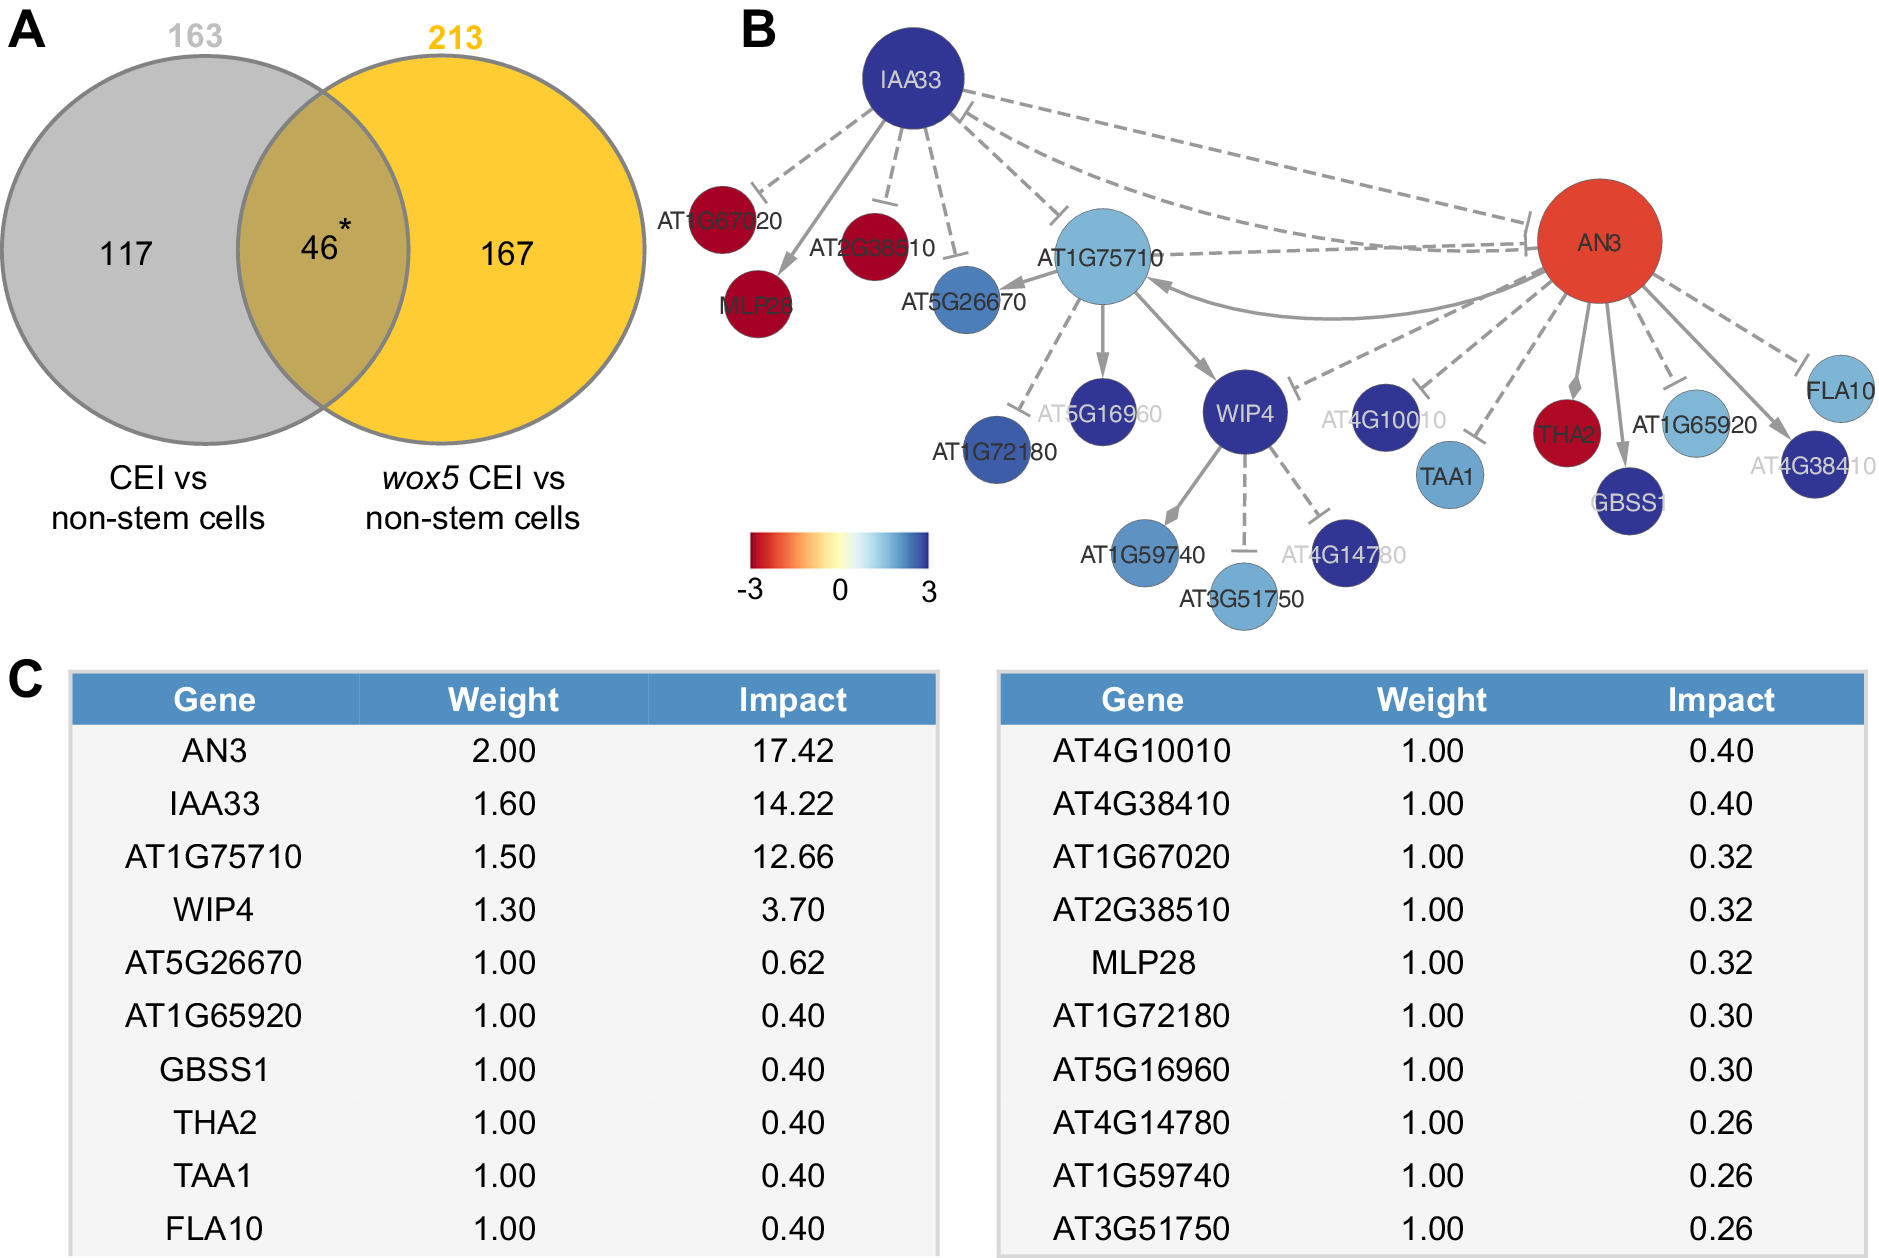
Figure 2. Network analysis of cortex endodermis initial (CEI)-expressed genes. (a) The overlap between genes differentially expressed between CEI cells and non-stem cells in the wild-type and the wox5 background. * = p < .001 (Exact hypergeometric probability). (b) Causal interactions between 46 differentially expressed genes that are enriched in the CEI cells. Solid triangle-arrows, solid diamond-arrows and dashed T-arrows represent activating, undetermined and repressing regulations, respectively. The size of the nodes correlates with the outdegree of that node. The colour of the nodes corresponds to the log2 fold change in expression in the wox5 CEI cells compared to the non-stem cells. (c) Tabular output from the Node Analyzer application presenting the weight (calculated based on outdegree) and impact (see Section 4) of each gene.
To identify which genes could cause the largest impact on network stability when perturbed, we performed a node importance analysis. To calculate the impact of each gene, each node received a weight depending on its outdegree (i.e., number of outgoing edges), then for each node, the sum of the weighted outgoing first neighbours and the sum of the weighted incoming first neighbours were taken. Both sums were in turn weighted, specifically, the sum of the outgoing neighbours was weighted by Average Shortest Path Length (ASPL), and the sum of the incoming neighbours was weighted according to the proportion of end-nodes within the network, which is in this network 20% (see Section 4). We next developed an R-based Shiny application (Node Analyzer) that calculates the weights and impacts of each gene within a network (Shannon et al., Reference Shannon, Markiel, Ozier, Baliga, Wang, Ramage, Amin, Schwikowski and Ideker2003) (see Section 4) (Supplemental Figure 1). Node Analyzer allowed us to rank the 20 genes in the network and select key genes. The most impactful gene within our network is AN3, a transcriptional co-activator that is involved in cell proliferation during leaf and flower development (Figure 2c).
2.3. ANGUSTIFOLIA 3 contributes to the regulation of cortex endodermis initial divisions
It was previously shown that AN3/GIF1 and its closest homologs, GIF2 and GIF3, were expressed in the root stem cell niche (Ercoli et al., Reference Ercoli, Ferela, Debernardi, Perrone, Rodriguez and Palatnik2018). A triple mutant (gif1/2/3) displayed a disorganized QC and increased root length as a result of an increased root meristem size (Ercoli et al., Reference Ercoli, Ferela, Debernardi, Perrone, Rodriguez and Palatnik2018). We confirmed the growth repressing role of AN3 in the roots, as an3 and 35S:AN3-GFP roots showed an increased and reduced root length compared to the WT, respectively (Supplemental Figure 2a). We observed a disorganized stem cell niche in 56% (25/45 roots) of an3 mutant roots (Supplemental Figure 2b). Additionally, an3 mutants contained starch granules in the cells that are normally CSC, suggesting that AN3 plays a role in CSC maintenance (Supplemental Figure 2c). To determine whether AN3 also plays a role in CEI divisions, we quantified the number of undivided and divided CEI cells in 4-, 5- and 6-day-old an3 and WT roots. Six-day-old an3 roots had 19.22% fewer undivided CEI cells compared to WT (p = .103, Wilcoxon test), suggesting that more CEI divisions occur in the an3 mutant (Figure 3a). Additionally, when an3 is crossed with the CEI-marker pCYCD6;1:GUS-GFP, an extended expression pattern is observed (Figure 3b,c). Taken together, these results support a role for AN3 in the regulation of CEI divisions.

Figure 3. Phenotypic analysis of angustifolia (3). (a) Percentage of divided and undivided cortex endodermis initial (CEI) cells in wild-type (Col) and an3 roots. (b) The number of endodermal and cortex cells expressing pCYCD6;1:GUS-GFP in wild-type (Col) and an3xpCYCD6;1:GUS-GFP roots. (c) Confocal image of an an3xpCYCD6;1:GUS-GFP root. Data are presented as mean ± SEM. * = p < .05 (a, b: Wilcoxon Chi-square test).
2.4. A hybrid model to dynamically simulate and predict stem cell divisions
If AN3 and WOX5 are indeed key regulators for CEI divisions, we would expect that their temporal expression influences CEI divisions in a cell-type specific manner. To gain insight into the system-level regulation of CEI stem cell divisions, we modelled the expression of CYCD6;1 and its direct and indirect upstream regulators: SHR, SCR, WOX5, and AN3 (Figures 1c and 3b) (Sozzani et al., Reference Sozzani, Cui, Moreno-Risueno, Busch, Van Norman, Vernoux, Brady, Dewitte, Murray and Benfey2010). For this, we developed a hybrid model that combines agent-based modeling aspects with ODEs. Specifically, we included four different cell types or ‘agents’ (QC, CEI, vascular initial, and endodermal cell) and constructed ODEs of the genes for each cell type that are able to recapitulate the dynamics of the upstream regulatory interactions at a molecular scale. The cells/agents interact through the movement of SHR and WOX5 and change state (i.e., divide) upon changes in the expression of specific proteins. For example, when CYCD6;1 exceeds a certain abundance, the CEI will divide. Each time a cell divides (an agent changes state), corresponding protein abundances are halved. As such, we were able to exchange information bidirectionally, from molecular to cellular scale and from cellular to molecular scale. To implement this hybrid model, we used SimBiology that models, simulates, and analyzes dynamic systems, allows for rapid model optimization, and provides an intuitive visualization of the model (The MathWorks, 2019).
To analyse the temporal expression dynamics of CYCD6;1 linked to CEI divisions, and to understand the regulatory role of WOX5 and AN3 in controlling the CYCD6;1 dynamics, we used ODEs to generate a quantitative model that describes the dynamics of four key transcriptional regulators of CYCD6;1, namely WOX5, AN3, SHR and SCR. In our ODE systems, each ODE included a degradation term and a production term that depended on its upstream regulations. The included regulations are depicted in Figure 4 and are as follows: (a) the inhibition of SHR by WOX5 in the vasculature (Clark, Fisher, et al., Reference Clark, Fisher, Berckmans, Van den Broeck, Nelson, Nguyen, Bustillo-Avendaño, Zebell, Moreno-Risueno, Simon, Gallagher and Sozzani2020), (b) the activation of SCR by the SHR/SCR complex in the endodermis, CEI and QC (Heidstra et al., Reference Heidstra, Welch and Scheres2004; Helariutta et al., Reference Helariutta, Fukaki, Wysocka-Diller, Nakajima, Jung, Sena, Hauser and Benfey2000), (c) the activation of SCR by AN3 (Ercoli et al., Reference Ercoli, Ferela, Debernardi, Perrone, Rodriguez and Palatnik2018), and (d) the activation of CYCD6;1 by the SHR/SCR complex in the CEI (Figure 4a) (Sozzani et al., Reference Sozzani, Cui, Moreno-Risueno, Busch, Van Norman, Vernoux, Brady, Dewitte, Murray and Benfey2010). As the upstream transcriptional regulations of WOX5 and AN3 are unknown, we modelled their expression based on previously published data of WOX5 and AN3 expression over time in the SCN (Clark et al., Reference Clark, Buckner, Fisher, Nelson, Nguyen, Simmons, de Luis Balaguer, Butler-Smith, Sheldon, Bergmann, Williams and Sozzani2019). Additionally, we included ODEs that model the movement of WOX5 from the QC to the vasculature initials (Supplemental Table 3), different diffusion rates of SHR from the vascular initials to the endodermis and QC (Clark, Fisher, et al., Reference Clark, Fisher, Berckmans, Van den Broeck, Nelson, Nguyen, Bustillo-Avendaño, Zebell, Moreno-Risueno, Simon, Gallagher and Sozzani2020), the SHR/SCR complex formation, and the oligomeric states of WOX5 and AN3. The oligomeric states of AN3 and WOX5 were experimentally determined using scanning FCS (Supplemental Figure 3). Specifically, we performed Number and Brightness (N&B) on an3 or wox5 roots expressing pAN3:AN3-GFP or pWOX5:WOX5-GFP translational fusion, respectively. We found that both AN3 and WOX5 primarily exist as a monomer (98.67 and 96.01%, respectively) with a very small amount of dimerization (1.33 and 3.99%, respectively) (Supplemental Figure 3). Thus, we fixed the oligomeric state of AN3 and WOX5 as monomers in our ODE model. As SHR and SCR dimers show a similar expression pattern as the monomers (Clark, Fisher, et al., Reference Clark, Fisher, Berckmans, Van den Broeck, Nelson, Nguyen, Bustillo-Avendaño, Zebell, Moreno-Risueno, Simon, Gallagher and Sozzani2020), we simplified the model and reduced the number of parameters by modeling the SHR and SCR monomer and dimer as one variable. Despite this simplification and the experimental estimation of several parameters, the number of parameters in the hybrid model still reaches over 30 as a result of its multi-scale nature spanning both cellular and molecular interactions. To further reduce the number of parameters that needed to be estimated, the most influential parameters were identified with a sensitivity analysis (Sobol', Reference Sobol'2001) (Supplemental Table 4, Supplemental Figure 4).
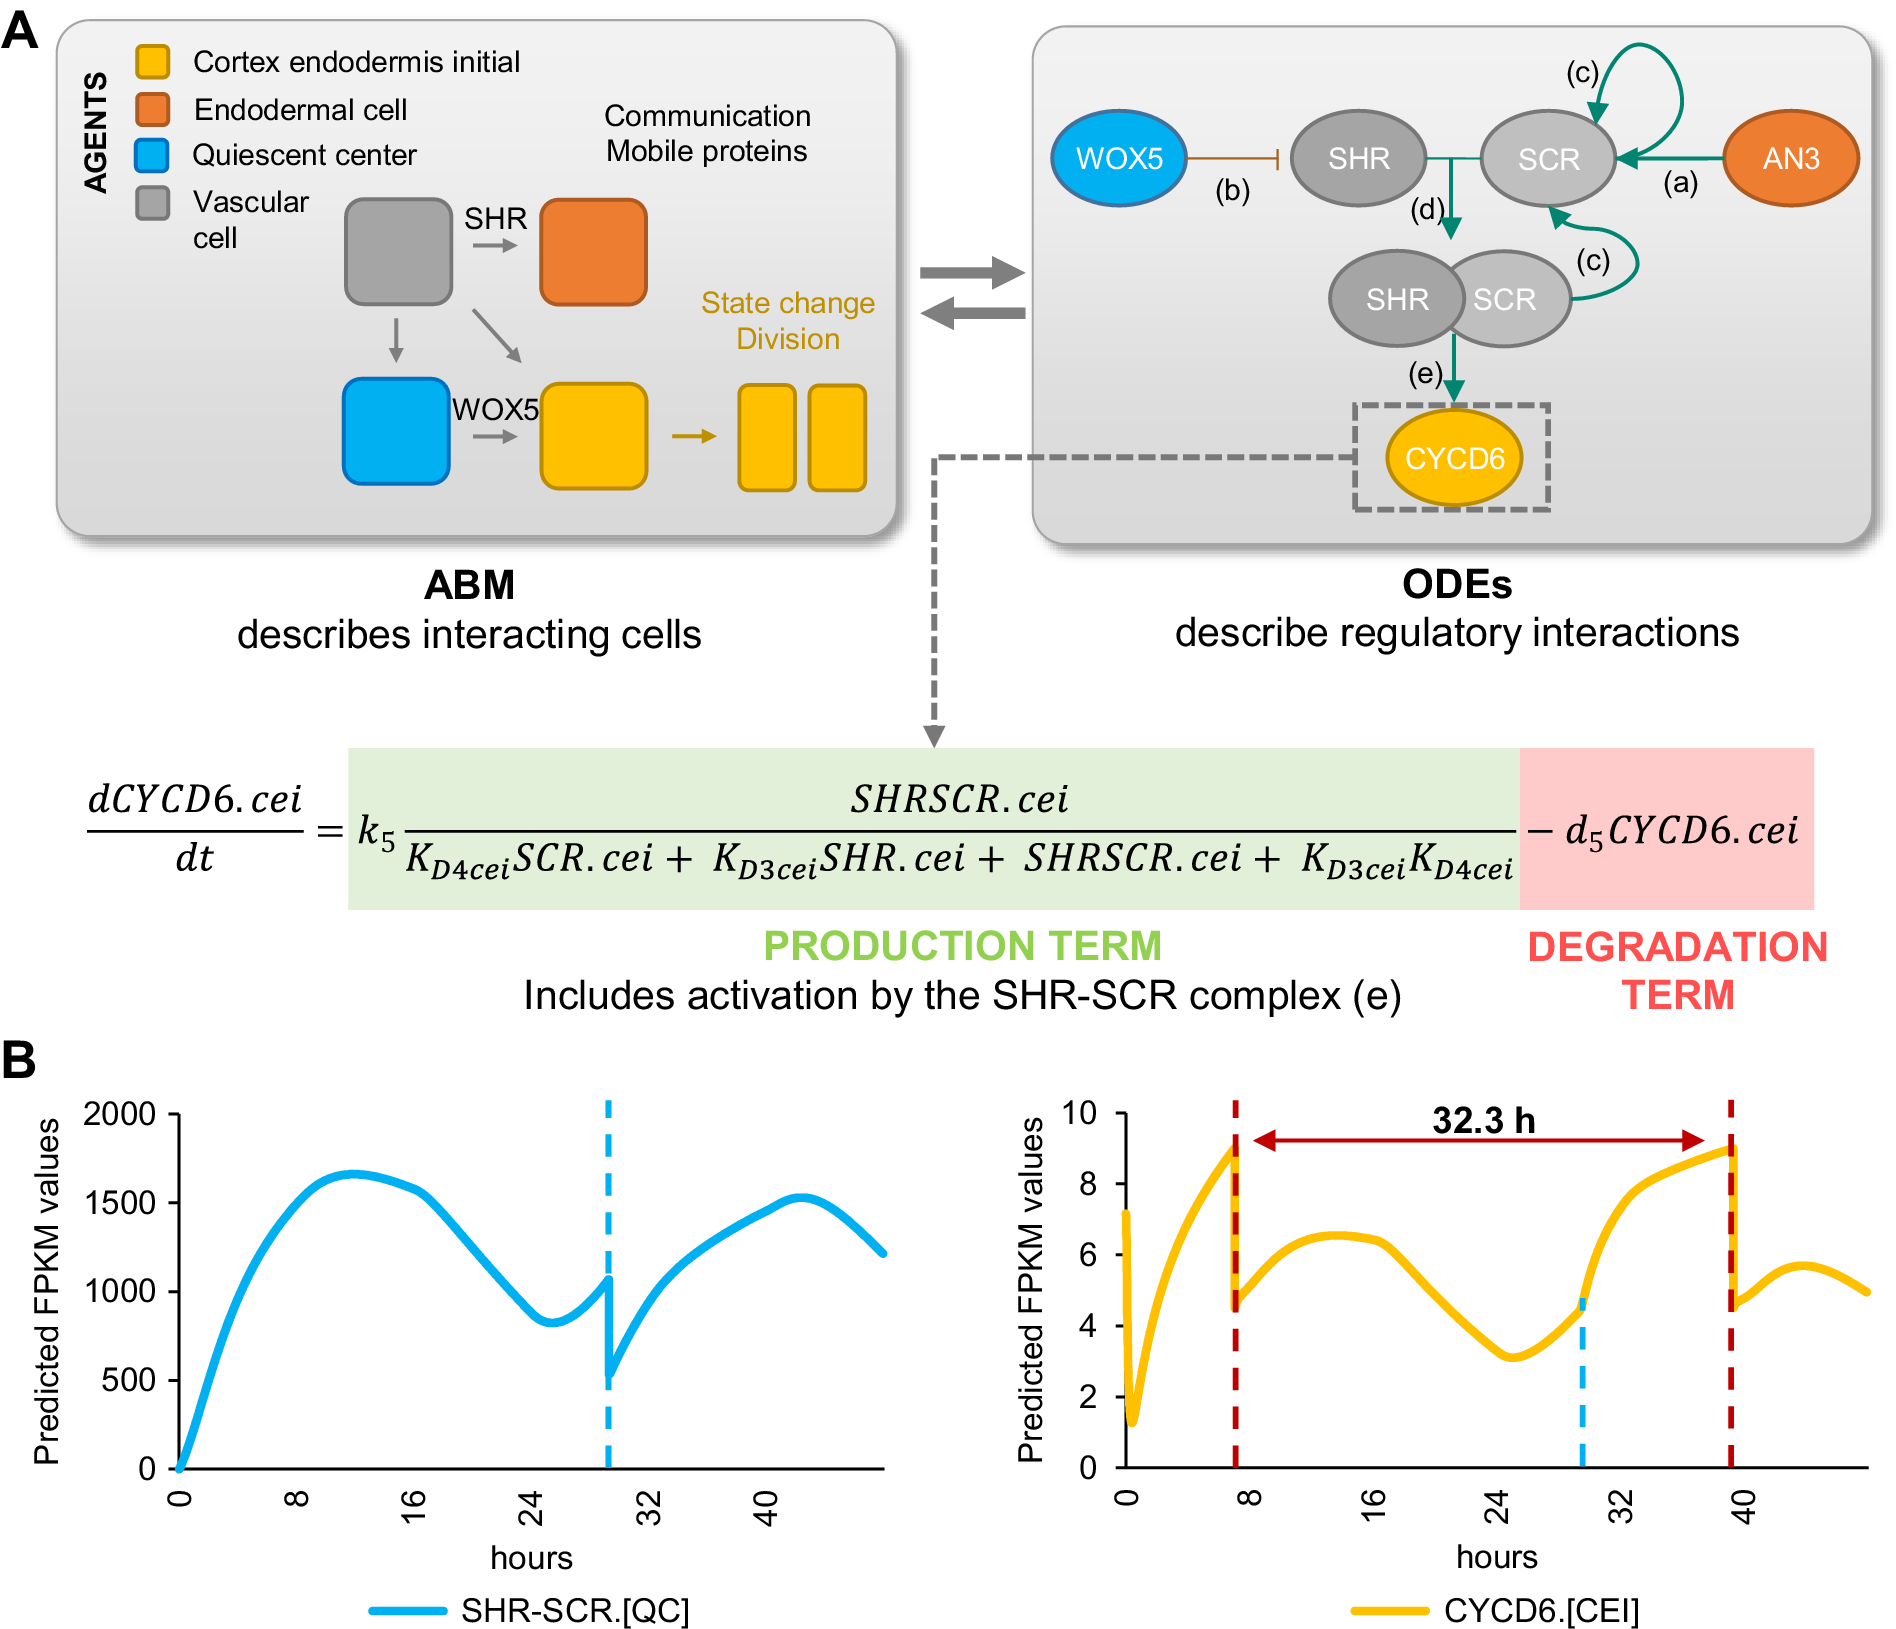
Figure 4. Computational hybrid modeling of quiescent center (QC) and cortex endodermis initial (CEI) division behaviour. (a) A hybrid model combines agent-based model (ABM) rules with ordinary differential equations (ODEs). Left panel: four cell types are considered as the agents in the model interacting with each other through mobile proteins and changing states through cell division. Right panel: known regulatory interactions between key genes involved in regulating CEI division [a: (Ercoli et al., Reference Ercoli, Ferela, Debernardi, Perrone, Rodriguez and Palatnik2018), b: (Clark, Fisher, et al., Reference Clark, Fisher, Berckmans, Van den Broeck, Nelson, Nguyen, Bustillo-Avendaño, Zebell, Moreno-Risueno, Simon, Gallagher and Sozzani2020), c: (Helariutta et al., Reference Helariutta, Fukaki, Wysocka-Diller, Nakajima, Jung, Sena, Hauser and Benfey2000), d: (Long et al., Reference Long, Stahl, Weidtkamp-Peters, Postma, Zhou, Goedhart, Sánchez-Pérez, Gadella, Simon, Scheres and Blilou2017), e: (Sozzani et al., Reference Sozzani, Cui, Moreno-Risueno, Busch, Van Norman, Vernoux, Brady, Dewitte, Murray and Benfey2010)]. (b) Model simulation of the expression of SHORTROOT (SHR)/SCARECROW (SCR) complex and D-type Cyclin CYCLIND6;1 (CYCD6;1) in the QC and CEI, respectively. Red dotted lines indicate CEI divisions and the blue dotted line indicates the time point of the QC division.
We estimated the values for the sensitive parameters by fitting our model to computed cell-type specific time course data (Supplemental Tables 5–7). Specifically, the expression of the modelled genes in each cell type at 5 days was extracted from cell-type specific datasets (Clark et al., Reference Clark, Buckner, Fisher, Nelson, Nguyen, Simmons, de Luis Balaguer, Butler-Smith, Sheldon, Bergmann, Williams and Sozzani2019; Li et al., Reference Li, Yamada, Han, Ohler and Benfey2016) and overlaid onto a stem cell time course to obtain cell-type specific expression levels every 8 hours from 4 to 6 days (see Section 4) (Supplemental Table 5). After estimating the sensitive parameters, we simulated the hybrid model to evaluate the expression dynamics within each cell. For example, the hybrid model predicted high expression of SCR in the endodermal cells and a lower expression in the CEI and QC. We confirmed the increased SCR expression in the endodermal cells by analysing confocal images of the QC, CEI and endodermal cells of pSCR:SCR-GFP for corrected total cell fluorescence (CTCF) at 5 days 16 hours (Supplemental Figure 5a,b). Model simulations showed that the cell-specific networks ensured robust stability of cellular behaviour, such as cell division regulation (Figure 4b). The agent-based rules for cell division were set based on SHR/SCR complex and WOX5 expression for the QC and CYCD6;1 expression for the CEI (Supplemental Figure 6). Our hybrid model was able to capture a dynamic expression pattern for the SHR/SCR complex, with high expression at 4 days 8 hours and 5 days 16 hours. In contrast, WOX5 showed a low expression at these time points (Supplemental Figure 5c). The first peak of SHR/SCR expression at 4 days 8 hours was previously shown in an ODE model, while the second peak occurred, compared to our model, earlier at 5 days 8 hours (Clark, Fisher, et al., Reference Clark, Fisher, Berckmans, Van den Broeck, Nelson, Nguyen, Bustillo-Avendaño, Zebell, Moreno-Risueno, Simon, Gallagher and Sozzani2020). Model predictions showed that the fine balance between low expression of the SHR/SCR complex and WOX5 simulates a QC cell division at 5 days 5 hours. Indeed, 5- and 6-day-old plants showed an increase in QC divisions compared to 4-day-old plants (Supplemental Figure 5d). Additionally, CEI divisions were predicted to occur at 4 days 8 hours and 5 days 16 hours (Figure 4b). We observed an increased percentage of divided CEIs in 5-day-old roots compared to 4-day-old roots, however, an increase was not visible in 6-day-old roots compared to 5-day-old roots (Figures 1d and 3a). We found that the rate of CEI divisions within our model was influenced by the QC division. For example, the change in WOX5 expression upon QC division impacts SHR expression and thus indirectly the SHR/SCR complex formation. The SHR/SCR complex, in turn, directly regulates CYCD6;1 expression, which triggers CEI divisions. As such, CEI divisions are temporally correlated with the QC divisions. To test the involvement of protein movement in the interdependence of QC and CEI divisions, we quantified the CEI divisions in a wox5xpWOX5:WOX5-3xGFP line where WOX5 movement is inhibited (Berckmans et al., Reference Berckmans, Kirschner, Gerlitz, Stadler and Simon2020). The number of divided CEIs was reduced in the wox5xpWOX5:WOX5-3xGFP line, potentially the result of WOX5 repressing activities on SHR in the vascular initials (Supplemental Figure 5e,f) and, accordingly, reduced levels of SHR decreases CYCD6;1 activation in the CEIs (Koizumi et al., Reference Koizumi, Hayashi, Wu and Gallagher2012). The distinct phenotype of wox5xpWOX5:WOX5-3xGFP line compared to the wox5 mutant, which showed an increased number of divided CEIs, and the complemented wox5xpWOX5:WOX5-xGFP suggested that WOX5 movement is important for proper CEI divisions. Taken together, our results suggest a QC division at 5 days 5 hours resulting from high SHR/SCR and low WOX5 concentrations, CEI divisions at 4 days 8 hours and 5 days 16 hours resulting from high CYCD6;1 concentrations, and an interdependence between CEI divisions and QC divisions.
2.5. The hybrid model partially captures systems behaviour in response to molecular perturbations
The regulatory network underlying the hybrid model can recapitulate the QC and CEI divisions in WT conditions. However, to further validate the model, we simulated the loss-of-function of wox5 and an3 and evaluated the expression patterns as well as CEI division dynamics. Based on transcriptome data of wox5 and an3, we calculated 99.53% and 88.12% reduction of WOX5 and AN3 expression in their respective loss-of-function lines (Supplemental Figure 7). As such, the initial expression levels of WOX5 and AN3 were set to 0.47% and 11.88% in the mutant simulation as compared to the values in a WT situation, respectively.
Model simulations of wox5 loss-of-function predicted an additional CEI division between 4 and 5 days compared to WT, which coincided with an increase in divided CEI cells at 4 days in wox5 (Supplemental Figures 8a and Figure 1d). The additional division is most likely the result of the removal of WOX5 repression on SHR in the vascular initials leading to an accelerated accumulation of SHR/SCR complex in the CEI. An overall increase in SHR/SCR in the CEI was not predicted by the model (Supplemental Figure 9b), and accordingly, CEI-specific transcriptomics and protein quantifications in the CEI of the wox5 mutant did not show an increased SHR expression (Supplemental Table 2, Supplemental Figure 9a). The simulations of the an3 loss-of-function predicted the depletion of SCR in the QC, CEI and endodermal cell compared to WT (Supplemental Figure 8b). This decrease in SCR expression has been shown within the QC (Ercoli et al., Reference Ercoli, Ferela, Debernardi, Perrone, Rodriguez and Palatnik2018). However, the CEI and endodermis still showed high levels of SCR when a repressor version of AN3 is expressed in the SCR reporter line (Ercoli et al., Reference Ercoli, Ferela, Debernardi, Perrone, Rodriguez and Palatnik2018), which is in contrast to the model predictions. As such, the regulation of CYCD6;1 by AN3 in the CEI may not be established via SCR but another unknown mechanism. We hypothesized that AN3 is regulating an additional factor that represses CYCD6;1. For this, we added an unknown factor X that is activated by AN3 and represses CYCD6;1, removed the AN3 activation of SCR, updated the ODEs within the CEI agent accordingly, and re-estimated four former and two new parameters (see Section 4) (Supplemental Tables 7 and 8). During model optimization, an additional rule that ensured a fixed minimum time between two CEI divisions was implemented to overcome overproliferation in the model (see Section 4). By adding competition between a repressor, transcriptionally activated by AN3, and the SHR/SCR direct regulation of CYCD6;1, the model was able to accurately capture the CEI divisions in a wild-type situation as well as in an an3 mutant background (Figure 5a). Notably, by adding the repressor to the model, the CEI division time interval shortened to 23.3 hours (Supplemental Figure 10). To identify potential candidates as a repressor downstream of AN3, we performed genome-wide expression analysis on an3 meristematic root tissue (Supplemental Table 9). In total 1013 genes were differentially expressed (FDR < .05) including 67 TFs of which four TFs were shown to interact with TOPLESS, a known transcriptional co-repressor (Causier et al., Reference Causier, Ashworth, Guo and Davies2012) (Figure 5b). Of these four transcriptional repressors, WRKY30 and MYB7 showed the highest expression correlation with the model prediction (Figure 5c). WRKY30 and MYB7 were also identified as a downstream target of AN3 in a tandem chromatin affinity purification (TChAP) experiment (Vercruyssen et al., Reference Vercruyssen, Verkest, Gonzalez, Heyndrickx, Eeckhout, Han, Jégu, Archacki, Van Leene, Andriankaja, De Bodt, Abeel, Coppens, Dhondt, De Milde, Vermeersch, Maleux, Gevaert, Jerzmanowski and Inzé2014). AtAUX2-11 and RVE1 showed no correlation and anti-correlation with the model predictions, respectively. As such, we propose WRKY30 or MYB7 as the putative downstream target of AN3 and repressor of CYCD6;1 in the model. Our hybrid model suggests that the regulation of CEI divisions by AN3 does not occur through its regulation of SCR. Model predictions propose an unknown repressor activated by AN3 that is able to control CYCD6;1 expression. Overall, we modelled systemic behaviour and predicted SCR, SHR, WOX5, AN3 and CYCD6;1 cell-type-specific protein concentrations as well as QC and CEI division dynamics.
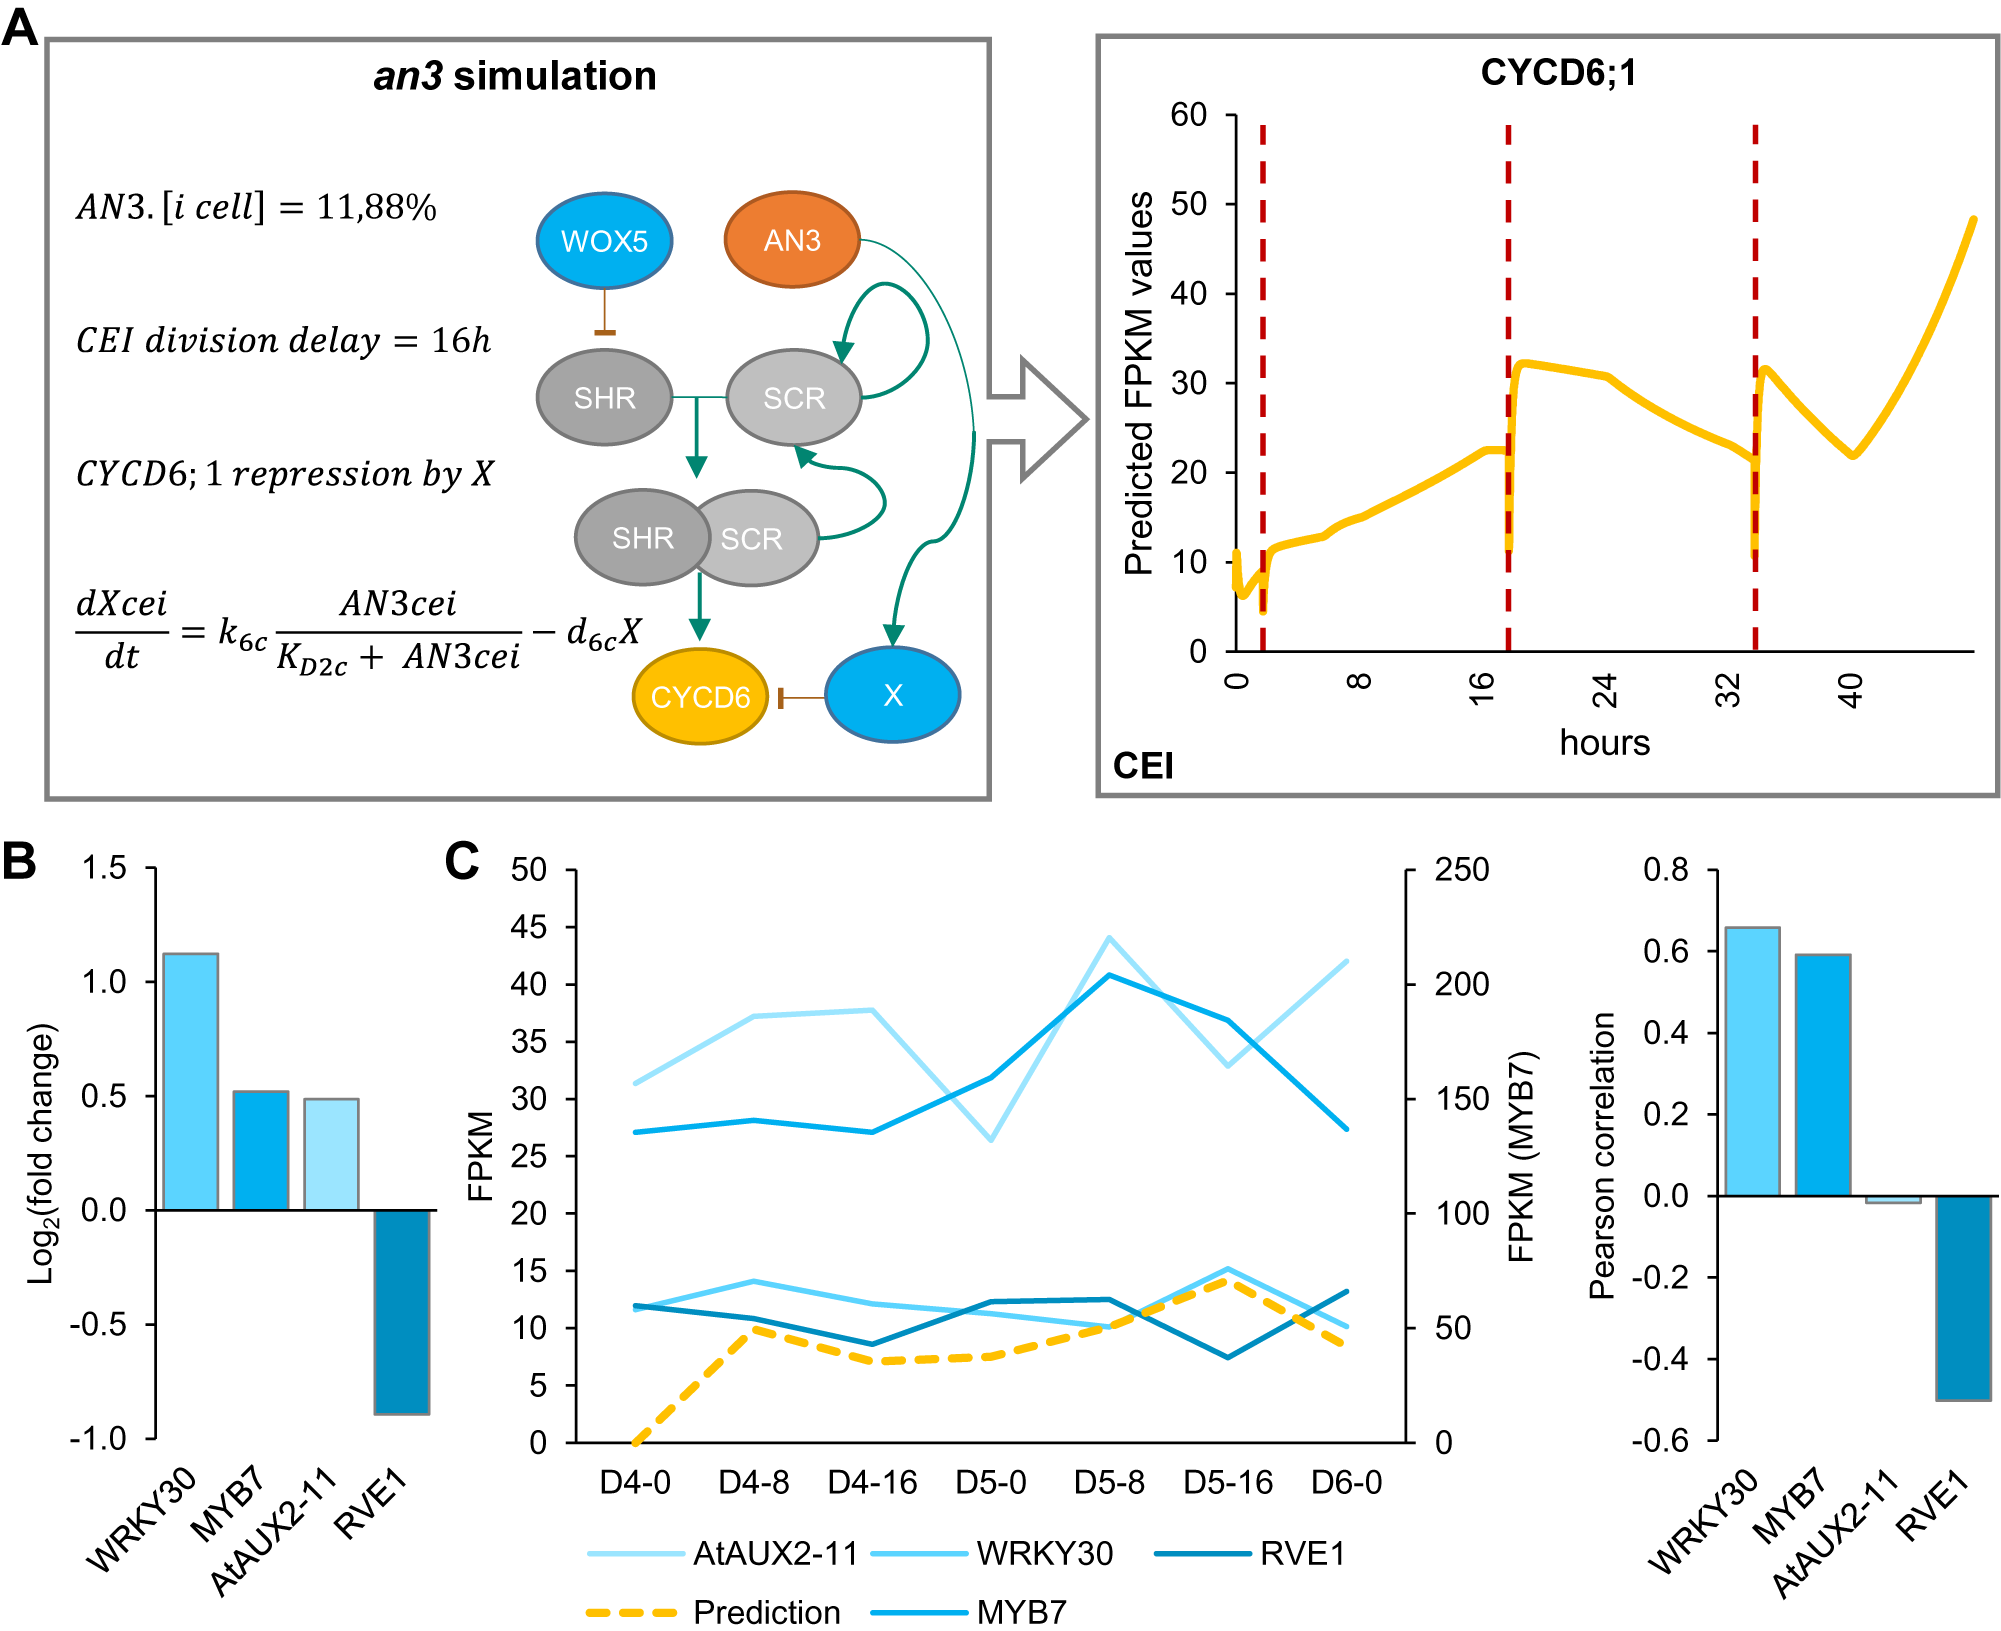
Figure 5. Mathematical modeling of CEI behaviour in the angustifolia 3 (an3) mutant background. (a) Left panel indicates the modifications made to the model. Right panel shows the CYCD6;1 expression during the an3 simulation in the cortex endodermis initial (CEI) agent. Red dotted lines indicate a division. (b) The expression values of transcriptional repressors within the an3 transcriptome dataset identified through overlap with the TOPLESS interactome. (c) The expression of the four identified transcriptional repressors in the an3 mutant within the stem cell time course (left) and Pearson correlation with the model predicted FPKM (fragments per kilobase per million mapped reads) values (right).
3. Discussion
Plants are multi-scale systems, in which cellular processes, such as the divisions of cells, occur at a different timing than molecular processes, such as Figure 6 protein movement. To understand these multi-scale systems and connect molecular dynamics with phenotypic changes, models that take into account multiple scales are becoming increasingly important. We have proposed an ODE and agent-based hybrid model that allows for the exchange of information across biological scales, from a molecular scale (i.e., regulatory interactions at single cell level) to a cellular scale (i.e., division of stem cells). As such, protein abundances have a direct influence on cell divisions and vice versa. Additionally, the cell divisions within the model could be triggered by the expression dynamics of regulatory networks within each cell.

Figure 6. Overview of stem cell division dynamics. Circular heatmap of the predicted scaled FPKM values of WOX5, SHR/SCR, AN3, CYCD6;1-repressor X, SCR, and CYCD6;1 over time from 4-day-old roots up to 6-day-old roots. The yellow and blue shades are predicted FPKM values in the cortex endodermis initial (CEI) and the quiescent center (QC), respectively. CEI and QC divisions are marked upon the heatmap. On the left of the circular heatmap, a network with the known and predicted regulatory interactions between these key proteins is drawn. Green and red arrows represent activation and repression, respectively.
In the Arabidopsis root SCN, the different stem cell types and the QC are positioned in a highly regular and well-characterized organization. The asymmetric divisions of these organized stem cells form all cell- and tissue-types of the Arabidopsis root and are controlled by dynamic, yet robust, regulatory signalling mechanisms. Several TFs have been identified in a cell-type specific context to regulate stem cell divisions. For example, SHR and SCR are known to activate CYCD6;1 in the CEI (Sozzani et al., Reference Sozzani, Cui, Moreno-Risueno, Busch, Van Norman, Vernoux, Brady, Dewitte, Murray and Benfey2010) and, in this study, we propose a non-cell autonomous function for WOX5 in the regulation of CEI divisions. We cannot exclude that auxin is also involved in regulating CEI divisions, as the presence of an auxin maximum in the root correlates with and positively influences CYCD6;1 expression in the CEI (Cruz-Ramírez et al., Reference Cruz-Ramírez, Díaz-Triviño, Blilou, Grieneisen, Sozzani, Zamioudis, Miskolczi, Nieuwland, Benjamins, Dhonukshe, Caballero-Pérez, Horvath, Long, Mähönen, Zhang, Xu, Murray, Benfey, Bako and Scheres2012). Accordingly, it has been shown that treating plants with auxin results in an extended CYCD6;1 expression and the presence of additional periclinal divisions (Cruz-Ramírez et al., Reference Cruz-Ramírez, Díaz-Triviño, Blilou, Grieneisen, Sozzani, Zamioudis, Miskolczi, Nieuwland, Benjamins, Dhonukshe, Caballero-Pérez, Horvath, Long, Mähönen, Zhang, Xu, Murray, Benfey, Bako and Scheres2012). However, the function of key proteins, such as WOX5 and SHR, on a system-level scale is unknown and key questions remain: How do key regulatory proteins coordinately regulate stem cell divisions? What set of rules and parameters govern these complex systems? In this study, we have used a multi-scale hybrid model to advance research that aims to connect molecular dynamics with phenotypic changes. The connection between regulatory inputs and cellular behaviour, such as cell division, is highly complex and requires computational models to generate and test hypotheses about the rules governing these cellular behaviours. The hybrid model allowed us to describe complex systemic behaviour by combining: (a) discrete agent-based modeling aspects to incorporate cell-specificity and allow for cell divisions through simple rules and (b) continuous ODE models to describe the expression dynamics of the included proteins (Figure 6). Including interactions between agents/cells is critical to fully address system-level problems and replicate observable behaviours. Questions about how mobile proteins affect phenotypic changes can be addressed by instructing agents/cells to communicate effectively in a model. To note, this model is not attempting to simulate and predict the division plane or direction. The ODE and agent-based hybrid model includes short range signals allowing for cell-to-cell communication. The mobile proteins, WOX5 and SHR, non-cell-autonomously regulate the expression of downstream proteins in specific cell types and allow for the communication between these cell types. WOX5 proteins can move to the neighbouring vascular initials and CEI cells and SHR proteins move to the QC, CEI and endodermal cells. Scanning FCS was used to quantify the diffusion coefficient of WOX5 and SHR to include into the model (Supplemental Table 7) (Clark et al., Reference Clark, Hinde, Winter, Fisher, Crosti, Blilou, Gratton, Benfey and Sozzani2016; Clark, Van den Broeck et al., Reference Clark, Van den Broeck, Guichard, Stager, Tanner, Blilou, Grossmann, Iyer-Pascuzzi, Maizel, Sparks and Sozzani2020). As such, the model predicted an additional CEI division in wox5 mutant as a result of the non-cell-autonomous regulation of SHR by WOX5 in the vascular initials and the movement of SHR to the CEI. Importantly, the inclusion of cell-to-cell communication into the model was crucial to accurately model stem cell division dynamics and contributed towards a better understanding of the rules underlying cellular behaviour (Figure 6).
Overall, our computational models and approach were aimed at making predictions about the rules of stem cell divisions that lead to testable hypotheses and assist in making future decisions. Accordingly, since the model suggested that the CEI-specific role of AN3 was not established through the regulatory interaction with SCR, we implemented a transcriptional repressor regulated by AN3, a non-intuitive aspect, to simulate the additional CEI divisions as found in an an3 background (Figure 6). Four candidate transcriptional repressors (Causier et al., Reference Causier, Ashworth, Guo and Davies2012) downstream of AN3 and upstream of CYCD6;1 were proposed based on transcriptome analysis, of which WRKY30 and MYB7 showed the highest correlation with model predictions and were identified as a downstream target of AN3 in a TChAP experiment (Vercruyssen et al., Reference Vercruyssen, Verkest, Gonzalez, Heyndrickx, Eeckhout, Han, Jégu, Archacki, Van Leene, Andriankaja, De Bodt, Abeel, Coppens, Dhondt, De Milde, Vermeersch, Maleux, Gevaert, Jerzmanowski and Inzé2014). Even though, since this is outside the scope of the study, the roles of these four TFs in regulating stem cell division within the SCN remain elusive, our integrative multi-scale model allowed us to both (a) predict cellular behaviour in normal conditions and (b) capture CEI division dynamics in response to perturbations. Thus, by combining continuous models to describe cell-specific regulatory networks and agent-based rules, systemic behaviour was modelled and led to a deeper understanding of the regulatory rules governing cell division.
4. Materials and methods
4.1. Plant material and growth conditions
The wox5 and an3 loss-of-function lines, pAN3:AN3-GFP, 35S-AN3-GFP, pWOX5:WOX5-GFP, wox5 x pWOX5:WOX5-3xGFP, pCYCD6;1:GUS-GFP and wox5 x pCYCD6;1:GUS-GFP are previously described in various studies (Berckmans et al., Reference Berckmans, Kirschner, Gerlitz, Stadler and Simon2020; Clark, Fisher, et al., Reference Clark, Fisher, Berckmans, Van den Broeck, Nelson, Nguyen, Bustillo-Avendaño, Zebell, Moreno-Risueno, Simon, Gallagher and Sozzani2020; Ercoli et al., Reference Ercoli, Ferela, Debernardi, Perrone, Rodriguez and Palatnik2018; Sozzani et al., Reference Sozzani, Cui, Moreno-Risueno, Busch, Van Norman, Vernoux, Brady, Dewitte, Murray and Benfey2010; Vercruyssen et al., Reference Vercruyssen, Verkest, Gonzalez, Heyndrickx, Eeckhout, Han, Jégu, Archacki, Van Leene, Andriankaja, De Bodt, Abeel, Coppens, Dhondt, De Milde, Vermeersch, Maleux, Gevaert, Jerzmanowski and Inzé2014). an3 x pCYCD6;1:GUS-GFP was generated by crossing an3 with pCYCD6;1:GUS-GFP. Homozygous plants were selected by PCR using the SALK LB primer and the AN3-specific oligos 5'-ATTACGACACAACTTGGAGCC-3' and 5'-TTTGTGGTCCGAAACAACATC-3'. All lines were upscaled with their corresponding wild type.
For imaging and root growth assays, seeds were dry sterilized using fumes produced by a solution of 100% bleach and 1M hydrochloric acid. The seeds were plated on square Petri dishes with solid (10 g/L agar, DifcoTM) 1X MS (Murashige and Skoog) medium supplemented with 1% sucrose and stratified for 2 days at 4°C. The plates were grown vertically at 22°C in long-day conditions (16-hrs light/8-hrs dark) for 4, 5, 6, or 7 days as indicated in the figures. At least three biological replicates of 10–20 plants were performed for the root growth assays and confocal images. The different lines were always grown together on one plate with the appropriate control line. For RNAseq experiments, seeds were wet sterilized using 50% bleach, 100% ethanol and water. Seeds were imbibed and stratified for 2 days at 4°C. Next, the seeds were plated with high density on Nitex mesh squares on top of solid 1X MS medium with 1% sucrose. Seeds were plated and grown vertically at 22°C in long-day conditions.
4.2. Root growth assays
At 3, 4, 5, 6 and 7 days, the primary root length was marked. At 7 days, a picture of the marked square plates was taken and the root length was measured using the software program ImageJ version 1.45 (National Institutes of Health; http://rsb.info.nih.gov/ij/). For the statistical analysis of the root growth assays, Student’s t-tests were performed on the average of each biological replicate.
4.3. Confocal imaging, pair correlation function analysis and number and brightness
Confocal microscopy was conducted using a Zeiss LSM 710 or 880 on 4-, 5-, or 6-day-old root tips. The 488 nm and 570 nm lasers were used for green and red channel acquisition, respectively. Propidium iodide (10 μM, Calbiochem) was used to stain cell walls and mPS-PI (modified pseudo-Schiff-PI) staining was used to visualize starch granules. For the N&B acquisition, 12-bit raster scans of a 256 × 256 pixel region of interest were acquired with a pixel size of 100 nm and a pixel dwell time of 12.61 μs as described in Clark et al., Reference Clark, Hinde, Winter, Fisher, Crosti, Blilou, Gratton, Benfey and Sozzani2016; Clark & Sozzani, Reference Clark, Sozzani and Busch2017. For pair correlation function (pCF) acquisition, 100,000 12-bit line scans of a 32 × 1 pixel region of interest were acquired with a varying pixel size and a pixel dwell time of 8.19 μs as described in Clark et al., Reference Clark, Hinde, Winter, Fisher, Crosti, Blilou, Gratton, Benfey and Sozzani2016; Clark & Sozzani, Reference Clark, Sozzani and Busch2017. Heptane glue was used during N&B and pCF acquisition to prevent movement of the sample as described in Clark et al., Reference Clark, Hinde, Winter, Fisher, Crosti, Blilou, Gratton, Benfey and Sozzani2016; Clark & Sozzani, Reference Clark, Sozzani and Busch2017.
Analysis of confocal images for CTCF measurements was performed as described previously (Clark et al., Reference Clark, Buckner, Fisher, Nelson, Nguyen, Simmons, de Luis Balaguer, Butler-Smith, Sheldon, Bergmann, Williams and Sozzani2019). Analysis of the raster scans acquired for N&B and the line scans for pCF was performed using the SimFCS software (https://www.lfd.uci.edu/globals/). For N&B, the 35S:GFP line was used to normalize the background region of the image (S-factor of 2.65) and determine monomer brightness (brightness of 0.26). A 128 × 128 region of interest was used on all images to measure oligomeric state specifically in the QC. For pCF, each line scan image was analysed with three different pixel distances (8, 10 and 12, or 7, 9 and 11) in both a left-to-right (movement from QC to CEI) and a right-to-left scanning direction (movement from CEI to QC). For each technical replicate of a line scan image, a qualitative Movement Index (MI) was assigned based on the detection of movement in the carpet (arch pattern, MI = 1) or not (no arch pattern, MI = 0) (Clark et al., Reference Clark, Hinde, Winter, Fisher, Crosti, Blilou, Gratton, Benfey and Sozzani2016; Clark & Sozzani, Reference Clark, Sozzani and Busch2017). The technical replicates were then averaged for each biological replicate. The pWOX5:WOX5:GFP images were analysed separately in both directions.
4.4. RNAseq analysis and network inference
300–500 mg of pWOX5:erGFP, pCYCD6:GUS-GFP and wox5xpCYCD6:GUS-GFP seeds were wet sterilized and plated for each of the four biological replicates. After 5 days of growth, approximately 1 mm of the root tip was collected and protoplasted as described (Birnbaum et al., Reference Birnbaum, Jung, Wang, Lambert, Hirst, Galbraith and Benfey2005). GFP positive and negative cells were collected using a MoFlo cell sorter into a vial containing a solution of beta-mercaptoethanol and RLT buffer. RNA was extracted using the Qiagen RNeasy Micro kit. Libraries were prepared using the SMART-Seq v3 Ultra Low RNA Input Kit for Sequencing and the Low Library Prep Kit v1 from Clontech. For the an3 RNAseq experiment, ∼5 mm of an3 and WT root tips were collected for each of the three biological replicates. RNA was extracted using the Qiagen RNeasy Micro kit and libraries were prepared using the NEBNext Ultra II RNA Library Prep Kit for Illumina (New England BioLabs). All libraries were sequenced on an Illumina HiSeq 2500 with 100 bp single-end reads.
Gene expression analysis of raw RNA-seq data and subsequent GRN inference was performed using the TuxNet interface (Spurney et al., 2019). Specifically, TuxNet uses ea-utils fastq-mcf (Aronesty, 2011; 2013) for pre-processing, hisat2 (Kim et al., 2015) for genome alignment and Cufflinks (Trapnell et al., 2012) for differential expression analysis. To infer a gene regulatory network (GRN) and predict the causal relationships of genes regulating CEI identity, DEGs were identified using FDR < .05 as our selection criteria, when performing pairwise comparisons between GFP negative cells from pWOX5:erGFP and GFP positive cells from pCYCD6:GUS-GFP or wox5 x pCYCD6:GUS-GFP. Within the TuxNet interface, RTP-STAR (Regression Tree Pipeline for Spatial, Temporal and Replicate data) was used for all network inference. The pipeline consists of three parts: spatial clustering using the k-means method, network inference using GENIE3 and edge sign (activation or repression) identification using the first-order Markov method. TuxNet is available at https://github.com/rspurney/TuxNet and video tutorials regarding installation, analysis and network inference are freely available at https://rspurney.github.io/TuxNet/. The network was visualized in Cytoscape® 3.8.0 (Shannon et al., Reference Shannon, Markiel, Ozier, Baliga, Wang, Ramage, Amin, Schwikowski and Ideker2003).
4.5. Node impact analysis
Each node from the network receives a weight between 1 and 2:
 $$\begin{align*}weight\ (N)=w=1+\frac{O}{O_{max}}\end{align*}$$
Nodes with a high outdegree (O) are considered to be more impactful within the network and will thus receive a high weight. The impact of a node within the network topology is calculated based on the weighted first neighbours:
 $$\begin{align*}R= ASPL\times \sum\limits_{1\ to\ O}^i{w}_i+A\times \sum\limits_{1\ to\ I}^i{w}_i\end{align*}$$
 $$\begin{align*}A=\frac{Nodes\ \left( outdegree>0\right)}{Nodes}\end{align*}$$
 where  $R$ = Robustness,
  $ASPL$ = Average Shortest Path Length,
  $O$ = outdegree and
  $I$ = indegree. A scale-free network will have a low
  $A$, while a scale-rich network will have a high
  $A$, allowing for the indegree to contribute more to the impact of a node. Because the first neighbours are weighted in regards to their outdegree, genes with a lower outdegree can still have a large impact if its neighbours have a high outdegree and the gene is thus centrally located. Genes with a large number of cascading targets that are two or more nodes away will have a higher ASPL and thus a higher scaled outdegree weight, accurately reflecting the hierarchical importance of the source gene itself and its first neighbours targets.
4.6. Shiny app: node analyzer
To calculate necessary network statistics such as outdegree and indegree in Cytoscape® 3.8.0 (Shannon et al., Reference Shannon, Markiel, Ozier, Baliga, Wang, Ramage, Amin, Schwikowski and Ideker2003), select Tools -> Analyze Network, check the Analyze as Directed Graph if applicable, and then press OK to perform the analysis. To export node and edge files from Cytoscape, select File -> Export -> Table to File, and then choose default edge or default node in the ‘Select a table to export’ dropdown. Press OK to export each file. Import the node and edge table files into the corresponding prompts (Figure 2c) and press the Run Analysis button to calculate impact scores. Results can be downloaded as a table using the Download Results button. In addition to the impact scores, the application renders three plots for visualization: one plot with the impact score for each gene and two histograms with the indegree and outdegree.
The Node Analyzer user interface can be accessed online at https://rspurney.shinyapps.io/nodeanalyzer/ or ran through R with scripts freely available at https://github.com/rspurney/NodeAnalyzer. Example datasets are also available via the GitHub link.
4.7. Ordinary differential equations, parameter estimation, and sensitivity analysis
ODEs were developed to model the dynamics of CYCD6;1, its upstream regulators SHR and SCR, WOX5 and AN3 in three different cell types: endodermal cell, CEI, and QC. The regulatory interactions between these five proteins were modelled using Hill equation dynamics and SHR/SCR complex formation is modelled using mass-action kinetics. SHR and WOX5 diffusion are modelled using a linear term for gradient-independent diffusion. All proteins are assumed to have a linear degradation term. We modelled transcriptional regulation and protein expression in the same equation.
(1) SHR; for the upstream regulation of SHR in the vasculature, the repression by WOX5 was included (top equation) (Clark, Fisher, et al., Reference Clark, Fisher, Berckmans, Van den Broeck, Nelson, Nguyen, Bustillo-Avendaño, Zebell, Moreno-Risueno, Simon, Gallagher and Sozzani2020).
 $$\begin{align*}\frac{dSHR.\left[ vasc\right]}{dt}={k}_4\frac{K_{D1 vasc}}{K_{D1 vasc}+ WOX5.\left[ vasc\right]}-{d}_4 SHR.\left[ vasc\right]\end{align*}$$
(2) SCR; for the upstream regulation of SCR expression, we included the autoactivation by SCR itself (Cruz-Ramírez et al., Reference Cruz-Ramírez, Díaz-Triviño, Blilou, Grieneisen, Sozzani, Zamioudis, Miskolczi, Nieuwland, Benjamins, Dhonukshe, Caballero-Pérez, Horvath, Long, Mähönen, Zhang, Xu, Murray, Benfey, Bako and Scheres2012; Heidstra et al., Reference Heidstra, Welch and Scheres2004), the activation by the SHR/SCR complex (SSC) (Heidstra et al., Reference Heidstra, Welch and Scheres2004) and the activation by AN3 (Ercoli et al., Reference Ercoli, Ferela, Debernardi, Perrone, Rodriguez and Palatnik2018). Each one of these regulations was assumed to be sufficient to induce SCR expression.
$$\begin{align*}&\frac{dSCR.\left[i\ cell\right]}{dt}=\\&{{k}_{3i}\Bigg(\frac{K_{D4i} SCR.\left[i\ cell\right]+ SSC.\left[i\ cell\right]}{K_{D3i}{K}_{D4i}+{K}_{D4i} SCR.\left[i\ cell\right]+{K}_{D3i} SHR.\left[i\ cell\right]+ SSC.\left[i\ cell\right]}}\\&\qquad +\frac{AN3.\left[i\ cell\right]}{K_{D2i}+ AN3.\left[i\ cell\right]}\Bigg)-{d}_{3i} SCR.\left[i\ cell\right]\end{align*}$$(3) WOX5; the production of WOX5 was assumed to be time-dependent as this produces the best model fit to the experimental data (top equation) (Clark, Fisher, et al., Reference Clark, Fisher, Berckmans, Van den Broeck, Nelson, Nguyen, Bustillo-Avendaño, Zebell, Moreno-Risueno, Simon, Gallagher and Sozzani2020).
$$\begin{align*}\frac{dWOX5.\left[ QC\right]}{dt}={k}_{1 qc} WOX5.\left[ QC\right]\end{align*}$$(4) AN3; the production of AN3 was assumed to be time-dependent as this produces the best model fit to the experimental data.
$$\begin{align*}\frac{dAN3.\left[i\ cell\right]}{dt}={k}_{2i} AN3.\left[i\ cell\right]\end{align*}$$(5) CYCD6;1; for the upstream regulation of CYCD6;1 expression, we included the activation by the SHR/SCR complex (SSC) (Sozzani et al., Reference Sozzani, Cui, Moreno-Risueno, Busch, Van Norman, Vernoux, Brady, Dewitte, Murray and Benfey2010).
$$\begin{align*}&\frac{dCYCD6.\left[ CEI\right]}{dt}=\\& {k}_5\frac{SSC.\left[ CEI\right]}{K_{D4 cei} SCR.\left[ CEI\right]+{K}_{D3 cei} SHR.\left[ CEI\right]+ SSC.\left[ CEI\right]+{K}_{D3 cei}{K}_{D4 cei}}\\&\qquad -{d}_5 CYCD6.\left[ CEI\right]\end{align*}$$


It was shown that the different oligomeric forms and stoichiometries of SHR, SCR and the SHR/SCR complex show a similar expression pattern (Clark, Fisher, et al., Reference Clark, Fisher, Berckmans, Van den Broeck, Nelson, Nguyen, Bustillo-Avendaño, Zebell, Moreno-Risueno, Simon, Gallagher and Sozzani2020). As such, the SHR and SCR oligomeric forms were modelled as one variable.
The interaction between the different agents/cell types is modelled using mass-action kinetics. The state change following division is modelled using simple agent-based rules. To simulate division of an agent, the capacity of the cell doubles, subsequently halving all proteins present.
(6) The cell types interact with each other through the movement of the regulatory proteins SHR and WOX5. The amount of SHR in the other cell types was determined by the movement of SHR (top equation). The amount of WOX5 in the vasculature was determined by the movement of WOX5 from the QC (bottom equation) (Figure 1).
$$\begin{align*}\frac{dSHR.\left[i\ cell\right]}{dt}={a}_i SHR.\left[ vasc\right]-{d}_{12i} SHR.\left[i\ cell\right]\end{align*}$$$$\begin{align*}\frac{dWOX5.\left[ vasc\right]}{dt}={a}_{vasc} WOX5.\left[ QC\right]-{d}_{1 vasc} WOX5.\left[ vasc\right]\end{align*}$$


(7) It was shown that the division of the QC cell correlates with the expression of WOX5 and the SHR/SCR complex (SSC) (Clark, Fisher, et al., Reference Clark, Fisher, Berckmans, Van den Broeck, Nelson, Nguyen, Bustillo-Avendaño, Zebell, Moreno-Risueno, Simon, Gallagher and Sozzani2020).
$$\begin{align*}if\ WOX5.\left[ QC\right]\le 100\& SSC.\left[ QC\right]\le 1100:\frac{Gene_{0\ to\ j}.\left[ QC\right]}{2}\end{align*}$$(8) We assumed that the division of the CEI cells is dependent on the expression of CYCD6;1 (Sozzani et al., Reference Sozzani, Cui, Moreno-Risueno, Busch, Van Norman, Vernoux, Brady, Dewitte, Murray and Benfey2010).
$$\begin{align*}if\ CYCD6.\left[ CEI\right]\ge 9:\frac{Gene_{0\ to\ j}.\left[ CEI\right]}{2}\end{align*}$$


For the sensitivity analysis, the total Sobol effect index was calculated for each parameter value (Saltelli et al., Reference Saltelli, Annoni, Azzini, Campolongo, Ratto and Tarantola2010; Sobol', Reference Sobol'2001). Parameter values were randomly sampled using Monte Carlo sampling to obtain 150 different values for each parameter. This analysis was repeated for 10 technical replicates. As such, for each parameter 170 (10 replicates × 17 ODEs) total Sobol effect indices were obtained. For each ODE and replicate, the sensitivities were rescaled between 0 and 1 and then averaged across the 17 ODEs. The obtained averaged sensitivities for each replicate were again averaged to retrieve the total Sobol effect index per parameter (Supplemental Table 4). The sensitive parameters were chosen as the parameters that had significantly higher Sobol indices than the lowest scoring parameter (K_D2_qc) using a Student’s t-test (p < .01).
To estimate the sensitive parameters, the model was fitted onto extrapolated cell-type specific time course expression data (Supplemental Table 5). To generate this cell-types specific time course expression data, FPKM (fragments per kilobase per million mapped reads) values in the QC, CEI and vascular initials at 5 days were obtained from Clark et al., and the endodermis-specific FPKM values at 5 days were obtained from Li et al (Clark et al., Reference Clark, Buckner, Fisher, Nelson, Nguyen, Simmons, de Luis Balaguer, Butler-Smith, Sheldon, Bergmann, Williams and Sozzani2019; Li et al., Reference Li, Yamada, Han, Ohler and Benfey2016). Using the fold changes of a time course dataset from the root stem cell niche every 8 hours from 4 to 6 days (Clark et al., Reference Clark, Buckner, Fisher, Nelson, Nguyen, Simmons, de Luis Balaguer, Butler-Smith, Sheldon, Bergmann, Williams and Sozzani2019) and the FPKM values at 5 days for the specific cell types, we were able to extrapolate cell-type specific time course expression values (Supplemental Table 5). Simulated annealing and Latin hypercube sampling as described in (Clark, Fisher, et al., Reference Clark, Fisher, Berckmans, Van den Broeck, Nelson, Nguyen, Bustillo-Avendaño, Zebell, Moreno-Risueno, Simon, Gallagher and Sozzani2020) produced 40 sets of parameter estimates (Supplemental Table 6). The average of these parameter estimates was used for the model simulations. The remaining sensitive parameters were set to a constant value from the corresponding estimated parameter in Clark, Fisher, et al., Reference Clark, Fisher, Berckmans, Van den Broeck, Nelson, Nguyen, Bustillo-Avendaño, Zebell, Moreno-Risueno, Simon, Gallagher and Sozzani2020. The value of non-sensitive parameters was selected based on similar values of the model described in Clark, Fisher, et al., Reference Clark, Fisher, Berckmans, Van den Broeck, Nelson, Nguyen, Bustillo-Avendaño, Zebell, Moreno-Risueno, Simon, Gallagher and Sozzani2020. The production terms for WOX5 (k1_qc) and AN3 (k2_qc, k2_cei and k2_endo) were set to a constant value at each time point to minimize the error between the model and the time course expression data. The diffusion coefficients of SHR (a_qc and a_cei) and WOX5 (b_qc) were experimentally determined from RICS experiments (Supplemental Table 3) (Clark, Fisher, et al., Reference Clark, Fisher, Berckmans, Van den Broeck, Nelson, Nguyen, Bustillo-Avendaño, Zebell, Moreno-Risueno, Simon, Gallagher and Sozzani2020).
The following changes were made in the regulatory network underlying the CEI divisions to reflect the an3 loss-of-function in the hybrid model:
(1) Factor X; for the upstream regulation of the unknown repressor X in the CEI agent, the activation by AN3 was included.
$$\begin{align*}\frac{dX.\left[ CEI\right]}{dt}={k}_{6 cei}\frac{AN3.\left[ CEI\right]}{K_{D2 cei}+ AN3.\left[ CEI\right]}-{d}_{6 cei}X.\left[ CEI\right]\end{align*}$$(2) CYCD6;1; for the upstream regulation of CYCD6;1 expression, we added the repression of factor X in addition to the activation by the SHR/SCR complex (SSC) (Sozzani et al., Reference Sozzani, Cui, Moreno-Risueno, Busch, Van Norman, Vernoux, Brady, Dewitte, Murray and Benfey2010).
$$\begin{align*}&\frac{dCYCD6.\left[ CEI\right]}{dt}=\\&{k}_5\Bigg(\frac{SSC.\left[ CEI\right]}{K_{D4 cei} SCR.\left[ CEI\right]+{K}_{D3 cei} SHR.\left[ CEI\right]+ SSC.\left[ CEI\right]+{K}_{D3 cei}{K}_{D4 cei}}\\&\qquad+\frac{K_{D6 cei}}{K_{D6 cei}+X.\left[ CEI\right]}\Bigg)-{d}_5 CYCD6.\left[ CEI\right]\end{align*}$$(3) SCR; for the upstream regulation of SCR expression in the CEI and endodermal agent, we included the autoactivation by SCR itself (Cruz-Ramírez et al., Reference Cruz-Ramírez, Díaz-Triviño, Blilou, Grieneisen, Sozzani, Zamioudis, Miskolczi, Nieuwland, Benjamins, Dhonukshe, Caballero-Pérez, Horvath, Long, Mähönen, Zhang, Xu, Murray, Benfey, Bako and Scheres2012; Heidstra et al., Reference Heidstra, Welch and Scheres2004), the activation by the SCR-SHR complex (Heidstra et al., Reference Heidstra, Welch and Scheres2004) and removed the activation by AN3 (Ercoli et al., Reference Ercoli, Ferela, Debernardi, Perrone, Rodriguez and Palatnik2018).
$$\begin{align*}&\frac{dSCR.\left[i\ cell\right]}{dt}=\\&{k}_{3i}\frac{K_{D4i} SCR.\left[i\ cell\right]+ SSC.\left[i\ cell\right]}{K_{D3i}{K}_{D4i}+{K}_{D4i} SCR.\left[i\ cell\right]+{K}_{D3i} SHR.\left[i\ cell\right]+ SSC.\left[i\ cell\right]}\\&\qquad -{d}_{3i} SCR.\left[i\ cell\right]\end{align*}$$(4) To avoid uncontrollable division within the CEI, the CEI agent was subjected to an additional rule that ensured a minimum time of 16h between successive divisions (
$\varDelta t$).$$\begin{align*}if\ CYCD6.\left[ CEI\right]\ge 9\&\varDelta t>16:\frac{Gene_{0\ to\ j}.\left[ CEI\right]}{2}\end{align*}$$


Four existing parameters (k3_endo, d3_endo, k3_cei and k5_cei) and two new parameters (k6_cei and d6_cei) were re-estimated in the same manner as described above and produced 20 sets of parameter estimates (Supplemental Table 8). For the remaining parameters, the same value as the initial hybrid model was used.
All parameters for the initial and adjusted model are listed in supplemental Table 7. To simulate the hybrid models, the initial values were set as the 4D FPKM values from the extrapolated time course data. For factor X, the SHR/SCR complex, and very lowly expressed genes (e.g., WOX5 in the vascular initials) the initial value was zero. To simulate wox5 loss-of-function, the initial value of WOX5 was set to 0.47% (Supplemental Figure 7). To simulate an3 loss-of-function, the initial value of AN3 in all three agents was set to 11.88% (Supplemental Figure 7). ODE45 was used as the ODE solver within SimBiology.
Acknowledgements
We thank Dr. Kensuke Kawade for an3 seeds, Dr. Javier F. Palatnik for the pAN3:AN3-GFP seeds, Dr. Dirk Inzé for the p35S:AN3-GFP seeds, Dr. Rüdiger Simon for the wox5 x pWOX5:WOX5-3xGFP and Dr. Thomas Laux for pWOX5:WOX5-GFP seeds.
Financial support
This work was supported by the National Science Foundation (NSF) (CAREER MCB-1453130) to RS; Foundation for Food and Agriculture Research (FFAR) to RS; and NSF/Biotechnology and Biological Sciences Research Council (BBSRC) (MCB-1517058) to TAL and RS.
Conflict of interest
The authors declare no conflict of interest.
Authorship contributions
L.V.d.B., A.P.F. and R.S. conceived and designed the study. L.V.d.B. and R.J.S. conducted the computational modeling. N.M.C. advised on the modeling. R.J.S designed the Shiny App. A.P.F., L.V.d.B., T.T.N, I.M and M.G gathered experimental data. L.V.d.B. and A.P.F. analysed experimental data. L.V.d.B. performed statistical analysis. L.V.d.B., A.P.F., R.J.S. and R.S. wrote the manuscript and all authors contributed to correcting the manuscript.
Data availability statement
All sequencing data are available on GEO at:
- https://www.ncbi.nlm.nih.gov/geo/query/acc.cgi?acc=GSE155462
- https://www.ncbi.nlm.nih.gov/geo/query/acc.cgi?acc=GSE155463
MATLAB code used for the hybrid model is available at https://github.com/LisaVdB/Hybrid_model_CEI_division. R-code used to develop the Shiny application is available at https://github.com/rspurney/NodeAnalyzer.
Supplementary Material
To view supplementary material for this article, please visit http://dx.doi.org/10.1017/qpb.2021.1.


 Open access
Comments
Dear Editor,
We wish to submit an original research manuscript entitled “Exchange of molecular and cellular information: a hybrid model that integrates stem cell divisions and key regulatory interactions” for consideration by Quantitative Plant Biology journal.
Stem cells undergo asymmetric divisions to give rise to all cell types in an organ. The transcriptional interactions regulating these stem cell divisions are determinant for proper organ development and growth. However, these regulatory mechanisms are complex and dynamic and require quantitative analyses over time and space coupled with computational models. In this manuscript, we combined cell-type-specific gene expression data and experimental data, such as scanning fluorescence correlation spectroscopy, with mathematical models to better understand how key regulatory proteins coordinately regulate stem cell divisions. We constructed a multi-scale model that, through the use of simple rules, can simulate quantitative protein concentration dynamics and system-level behavior. Specifically, we coupled agent-based modeling aspects and continuous models of ordinary differential equations to allow for the exchange of information across biological scales, from a molecular scale (i.e. regulatory interactions at single cell level) to a cellular scale (i.e. division of stem cells). As such, protein concentrations have a direct influence on cell divisions and vice versa. We included four stem cell types of the Arabidopsis thaliana root stem cell niche in the hybrid model: quiescent center (QC), vascular initial, cortex epidermis initial (CEI), and endodermal cell. Additionally, we included mobile proteins, WOX5 and SHR, that non-cell-autonomously regulate the concentration of downstream proteins in specific cell types. The communication between the cell types and the dynamic expression patterns of key proteins, such as WOX5, AN3, SCR, SHR, and CYCD6;1, allowed the hybrid model to predict experimentally validated stem cell divisions.
Given the increasing amount of data generated in the science community, methodologies to analyze and interpret this data are becoming more important. In this manuscript, we have developed a shiny R application that easily allows for downstream gene regulatory network analyses, assisting biologists in interpreting complex networks. More importantly, within this manuscript a multi-scale model was developed that uses simple rules and continuous models to simulate quantitative protein dynamics and system-level behavior, such as cell divisions. As plants are dynamic and multiscale systems, models that take into account multiple scales will become increasingly important. We are confident that gene regulatory networks and multi-scale models could aid in a better understanding of quantitative plant research for many biologists.
As this manuscript combines experimental data, such as scanning fluorescence correlation spectroscopy, transcriptomics, and phenotypical analyses, with computational tools, like network inference, node importance analysis, and mathematical modeling, it would be an excellent fit for the Quantitative Plant Biology journal. This publication is original and has not been published elsewhere, nor is it currently under consideration for publication elsewhere.
We would appreciate your willingness to consider this manuscript for publication in Quantitative Plant Biology. Please feel free to contact us if you have any questions or comments.
Sincerely,
Lisa Van den Broeck and Ross Sozzani