


INTRODUCTION
Historic droughts in the intermountain region of the Rocky Mountains, including the Upper Colorado River Basin (UCB), are fueled by reductions in snowpack, which is the region's primary water source. The historical record highlights the need for Holocene perspectives on precipitation extremes and drought (defined as meteorological drought, e.g., Mishra and Singh, Reference Mishra and Singh2010). In the continental interior of the American west, the seasonal interplay between atmospheric flow patterns (i.e., the jet stream) with geographic mechanisms and topography leads to winter maxima in the annual distribution of precipitation and higher precipitation amounts at higher elevation (Bryson and Hare, Reference Bryson and Hare1974; Redmond, Reference Redmond and Lewis2003; Shinker et al., Reference Shinker, Bartlein and Shuman2006; Shinker and Bartlein, Reference Shinker and Bartlein2011). Mountain snowpack is of fundamental importance for water supply because it contributes most of the water for storage and use downstream. However, low elevation locations, including pluvial lakes, constitute the majority of the Late Pleistocene records that provide the framework for our current understanding of the paleohydrologic history of the region (Thompson et al., Reference Thompson, Whitlock, Bartlein, Harrison, Spaulding, Wright, Kutzbach, Webb, Ruddiman, Street-Perrott and Bartlein1993; Bartlein et al., Reference Bartlein, Anderson, Anderson, Edwards, Mock, Thompson, Webb, Webb and Whitlock1998; Madsen et al., Reference Madsen, Rhode, Grayson, Broughton, Livingston, Hunt, Quade, Schmitt and Shaver2001; McGee et al., Reference McGee, Quade, Edwards, Broecker, Cheng, Reiners and Evenson2012; Reheis et al., Reference Reheis, Adams, Oviatt and Bacon2014; Oviatt, Reference Oviatt2015; Thompson et al., Reference Thompson, Oviatt, Honke, McGeehin, Oviatt and Shroder2016).
There is an important distinction between the paleohydrology of high elevation locations where most water is supplied versus low elevation locations where most water is used. Redmond (Reference Redmond and Lewis2003) identified the complex relationship between lower elevation surface water amounts and mountain snowpack by recognizing that peak snowmelt during spring runoff is brief, and commonly occurs before peak ecological water use during summer growing seasons when rainfall is infrequent and sporadic. Compared to high elevations, intermountain valley geographies have relatively warmer temperatures and lower annual precipitation amounts, and are frequently characterized as semi-arid. This can lead to unique proxy sensitivity to wet and dry conditions by comparison with nearby alpine areas (Wahl et al., Reference Wahl, Starratt, Anderson, Kusler, Fuller, Addison and Wan2015; Munroe and Laabs, Reference Munroe and Laabs2020; Quirk et al., Reference Quirk, Moore, Laabs, Plummer and Caffee2020). Records of regional water supply, at its primary source, can be found at high elevation, snowfall-dominated locations using a precipitation sensitive proxy such as water isotope tracers from lake sediments.
Lakes are natural reservoirs of mixed surface and meteoric waters, and stable isotope ratios are widely used to study hydrologic and hydroclimatic processes, past and present (Gibson et al., Reference Gibson, Birks and Yi2016; Horton et al., Reference Horton, Defliese, Tripati and Oze2016). Lake water isotopes of oxygen and hydrogen, δ18O and δ2H, respectively, reflect processes related to water source and evaporation. Source waters reflect the isotope values of precipitation, including that which falls directly on a lake's surface combined with surface and groundwater inflow (Shapley et al., Reference Shapley, Ito and Donovan2008). Source water isotope values are affected by precipitation amount, atmospheric vapor source and trajectory, and the temperature of condensation (Friedman Reference Friedman2002a, Reference Friedman2002b; Smith, Reference Smith2002). Evaporation from a lake's surface causes preferential loss of the light isotope 16O, causing a relative increase in the heavy isotope 18O, leaving higher δ18O values in the remaining lake water. There is greater potential for evaporation with extended lake water residence times, which is a function of lake hydrology that can be characterized by modern water isotope values (e.g., Smith and Palmer, Reference Smith, Palmer, Horne, Holmes, Rodriguez-Lazaro and Viehberg2012). The range of modern isotope values provides the framework for interpretation of past lake water isotope variations found in sediment records, such as those derived from lake carbonate deposits (e.g., Anderson et al., Reference Anderson, Berkelhammer, Barron, Steinman, Finney and Abbott2016a).
Most existing lake water isotope sediment records of the intermountain west are from low-elevation environments, including Walker and Pyramid lakes in Nevada (Benson et al., Reference Benson, Kashgarian, Rye, Lund, Paillet, Smoot, Kester, Mensing, Meko and Lindström2002; Lund et al., Reference Lund, Benson and Negrini2021), Owens Lake and Mono Lake in California (Li et al., Reference Li, Ku, Stott and Anderson1997; Menking et al., Reference Menking, Bischoff, Fitzpatrick, Burdette and Rye1997), and Bear Lake in Idaho-Utah (Bright et al., Reference Bright, Kaufman, Forester and Dean2006; Dean et al., Reference Dean, Forester, Bright and Anderson2007). Holocene studies include Foy, Jones, and Crevice lakes in Montana (Stevens et al., Reference Stevens, Stone, Campbell and Fritz2006; Stevens and Dean, Reference Stevens and Dean2008; Shapley et al., Reference Shapley, Ito and Donovan2009; Whitlock et al., Reference Whitlock, Dean, Fritz, Stevens, Stone, Power, Rosenbaum, Pierce and Bracht-Flyr2012), San Luis Lake in central Colorado (Yuan et al., Reference Yuan, Koran and Valdez2013), and Lower Pahranagat Lake in southern Nevada (Theissen et al., Reference Theissen, Hickson, Brundrett, Horns and Lachniet2019). High elevation lake records are relatively uncommon in Utah (Munroe and Laabs, Reference Munroe and Laabs2020), and those focused on carbonate δ18O are currently limited to northwestern Colorado at Bison and Yellow lakes, 3255 m and 3140 m elevation, respectively (Anderson, Reference Anderson2011, Reference Anderson2012). Located in the eastern Upper Colorado River Basin (UCB), the Bison and Yellow records characterize precipitation at multidecadal-scale resolution to provide regional Holocene snowpack trends (Anderson et al., Reference Anderson, Berkelhammer and Mast2016b). Additional high elevation carbonate δ18O records are needed to evaluate patterns and processes related to seasonal precipitation, temperature, evapotranspiration, infiltration, and runoff across the sub-regions of the UCB that have yet to be explored by paleoclimatic investigations.
This study presents a new lake carbonate δ18O paleoclimate record for the Holocene from Emerald Lake in central Utah (Fig. 1). At 3090 m elevation, the headwater lake is on the summit of the Wasatch Plateau, which delineates the border between the Great Basin and Colorado Plateau regions. The location of Emerald Lake on the western boundary of the UCB provides a new opportunity to evaluate sub-regional snow and drought patterns within the watershed. We show that the multi-decadal scale δ18O record (ca. 30-year average resolution) from Emerald Lake reflects changes in precipitation and evaporation by utilizing a modern lake δ18O interpretive framework, and multiproxy sediment variations provide evidence for changes in lake level. Comparison with records from the eastern Great Basin and northern Rockies approximates the geographic scale of synoptic climate patterns related to jet stream and North American Monsoon (hereafter ‘monsoon’) dynamics. With this context in mind, four questions are addressed by this study. (1) Were Holocene paleohydrologic trends consistent at high and low elevations? (2) Were paleohydrologic extremes in the Upper Colorado typically basin-wide or were sub-regional variations common? (3) Is there evidence for regional precipitation patterns with spatial dipole characteristics (e.g., wet north and dry south) and/or time-transgressive patterns that bear resemblance to historical patterns? (4) How common are non-analogue conditions?
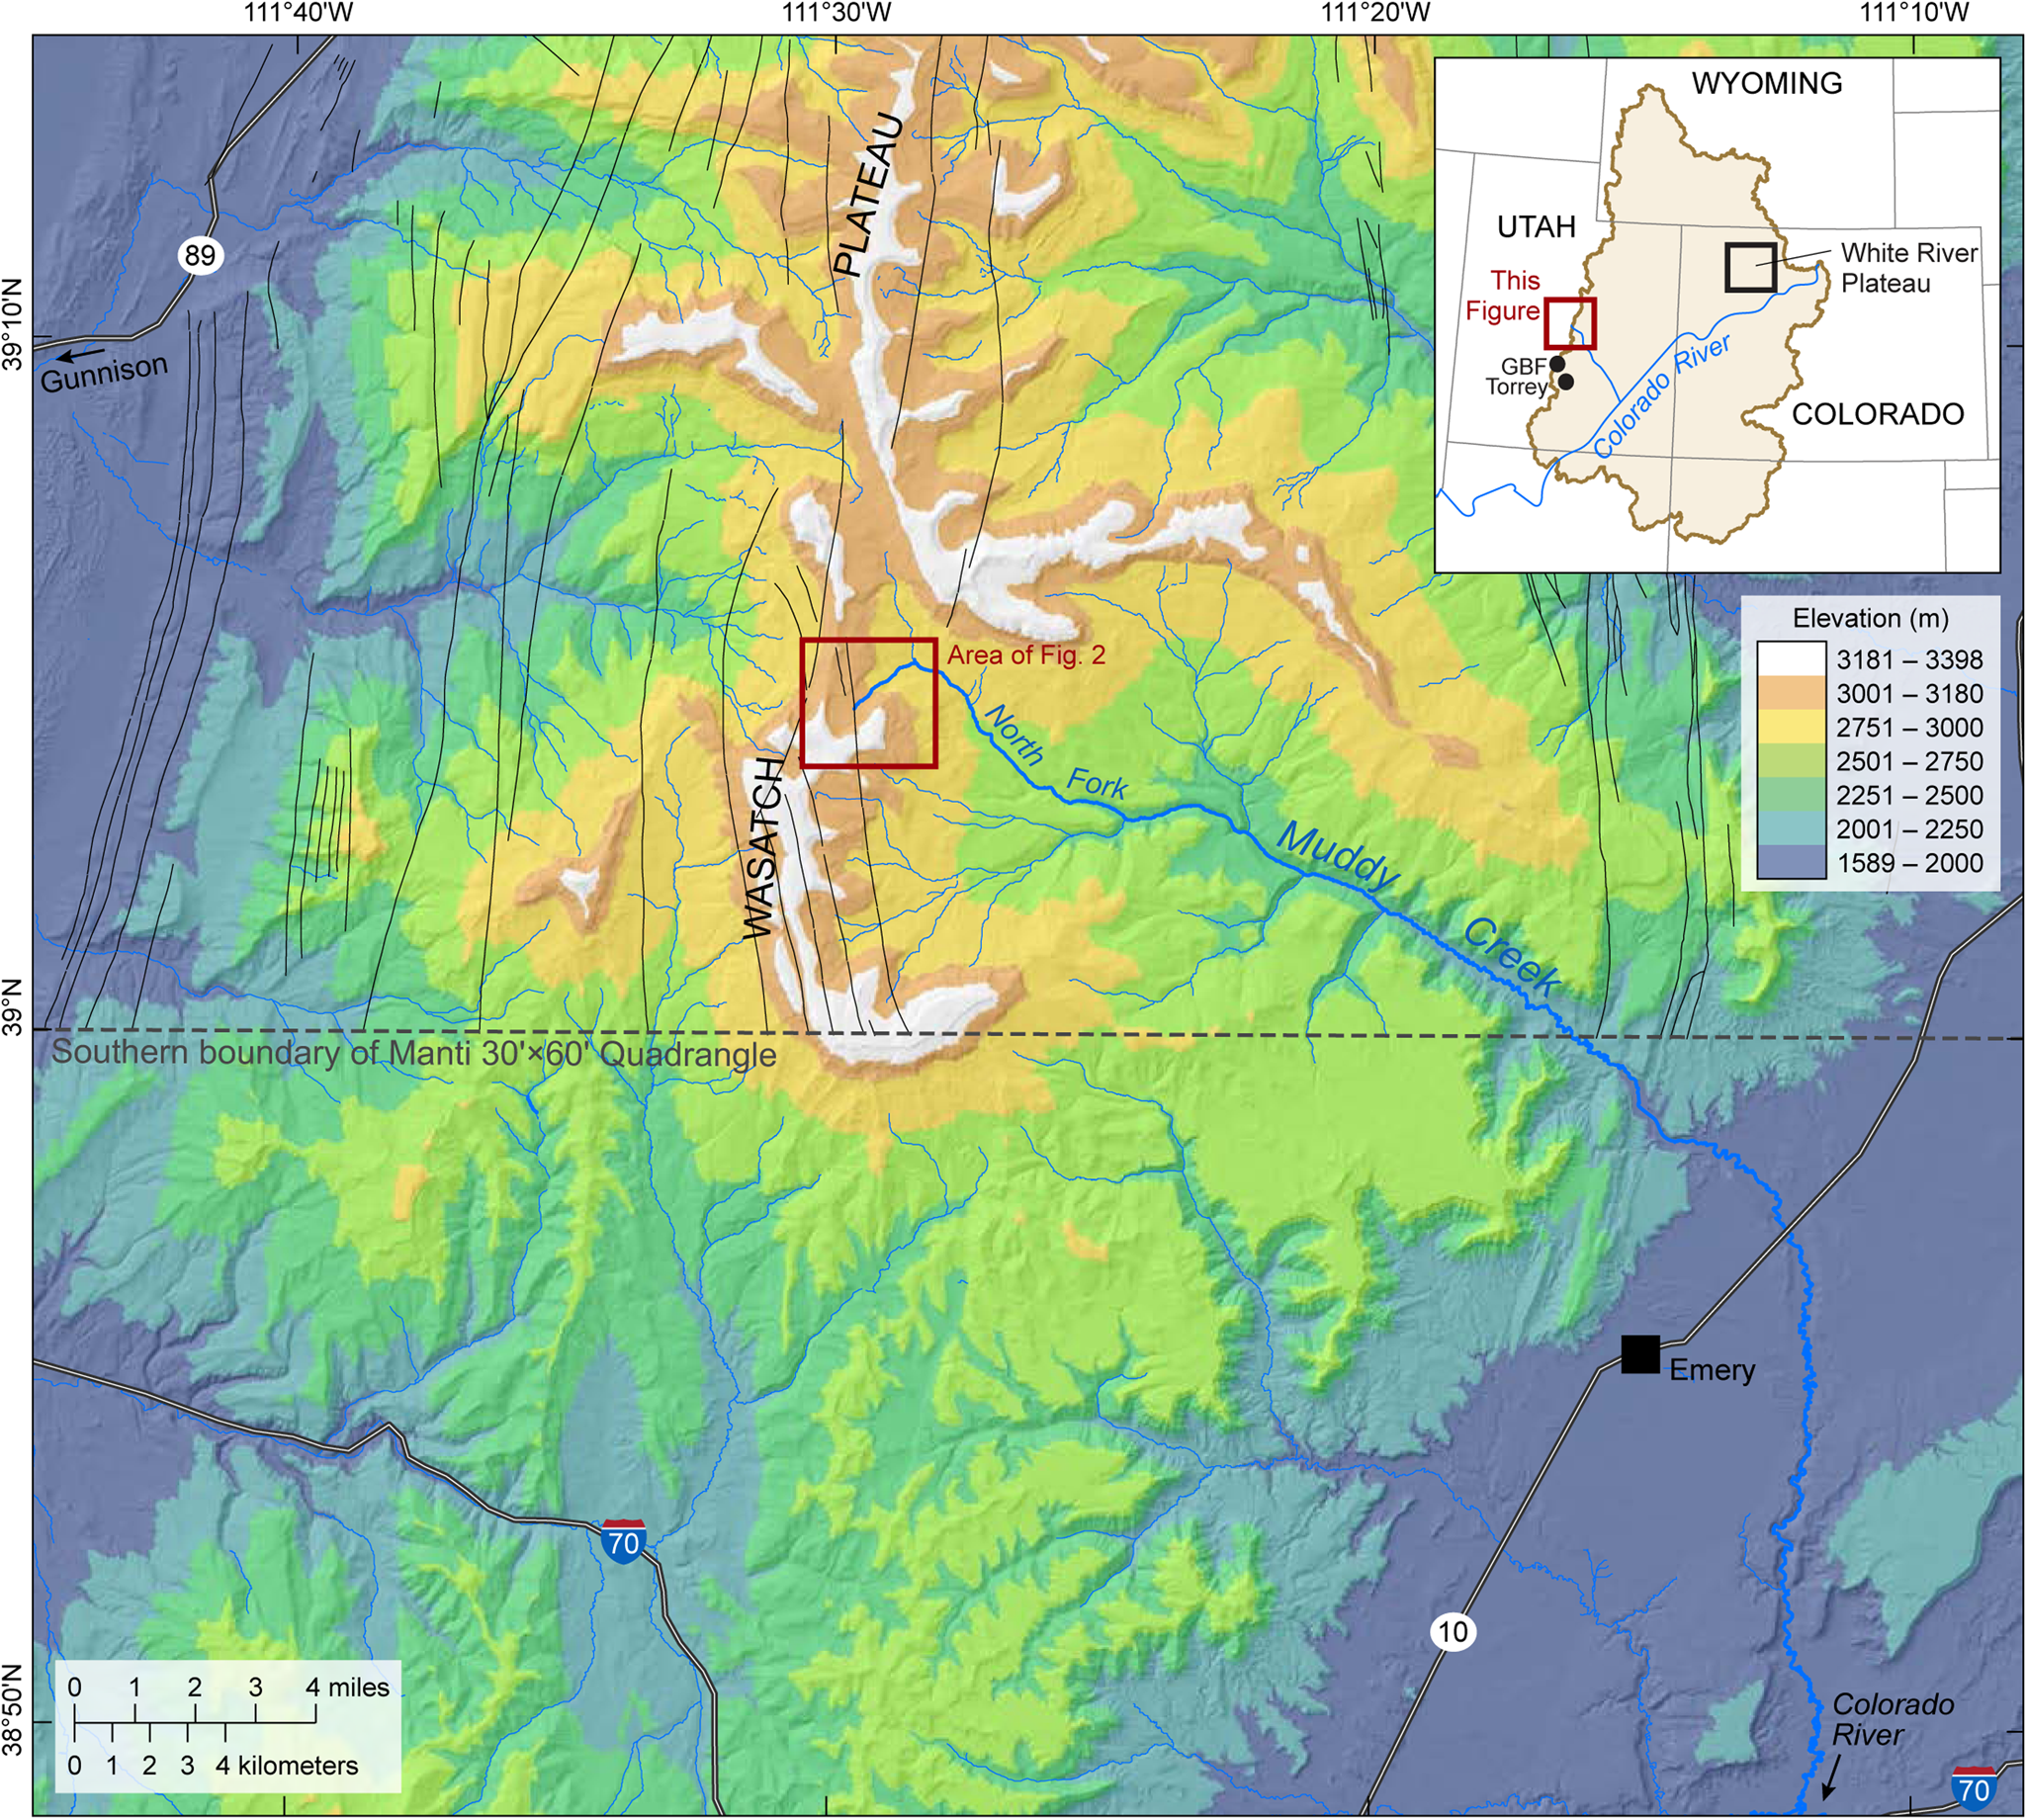
Figure 1. Map of the Emerald Lake study area (red box) within the Muddy Creek watershed in the southern Wasatch Plateau, central Utah, on a colored digital elevation model. The inset shows the area's location in the Upper Colorado River Basin (UCB) in relation to the White River Plateau in northwest Colorado, Garden Basin Fen (GBF) and Torrey soils, discussed in the text. North-south normal faults (black lines) were mapped by Witkind et al. (Reference Witkind, Weiss and Brown2006) and are shown for the area only within the U.S. Geological Survey Manti 30′x 60′quadrangle.
The Wasatch Plateau has a long history of damaging landslides, including mass movement that evidently has altered the western margin of Emerald Lake (DeGraff, Reference DeGraff1978; McDonald and Giraud, Reference McDonald and Giraud2015). The primary mechanism for historic slope instability is soil saturation caused by either high snowmelt runoff or intense rainfall events (Fleming et al., Reference Fleming, Johnson and Schuster1988; Baum and Fleming, Reference Baum and Fleming1989). Alternatively, Holocene landslides may have also been triggered by seismic activity on steep normal fault segments of the Wasatch fault complex that cross the plateau, including the Emerald Lake watershed (Machette et al., Reference Machette, Personius, Nelson, Schwartz and Lund1991; Witkind et al., Reference Witkind, Weiss and Brown2006; DuRoss et al., Reference DuRoss, Personius, Crone, Olig, Hylland, Lund and Schwartz2016). The radiocarbon-based chronology of the Emerald Lake sedimentary record provides accurate timing for a landslide event and allows evaluation of its occurrence within the context of the paleoclimatic record.
STUDY SITE
Emerald Lake (39.0738°N, 111.4977°W, 3090 m asl) is a headwater of the North Fork of Muddy Creek, a tributary of the Dirty Devil, Fremont, and Upper Colorado rivers (Fig. 2) in the Manti-La Sal National Forest, and is located within the early Paleogene Flagstaff Formation, which is a lacustrine deposit within the Sevier foreland basin that consists of limestones, mudstones, minor sandstones, and evaporites (Bowen et al., Reference Bowen, Daniels and Bowen2008). The limestones are locally dolomitic. During the Pleistocene, the Wasatch Plateau was glaciated (Spieker and Billings, Reference Spieker and Billings1940; Larson, Reference Larson1996; Witkind et al., Reference Witkind, Weiss and Brown2006). Early Holocene and Late Pleistocene megafaunal remains discovered in glaciolacustrine sediments include Columbian mammoth, mastodon, short-faced bear, horse, and bison (Miller, Reference Miller1987; Gillette and Madsen, Reference Gillette and Madsen1992, Reference Gillette and Madsen1993).

Figure 2. Expanded view of study area from Figure 1 of the Emerald Lake watershed with topography and surface water, ice-extent (Larson, Reference Larson1996), faults and geologic units (Witkind et al., Reference Witkind, Weiss and Brown2006), landslides (orange), and rockfall (purple) (McDonald and Giraud, Reference McDonald and Giraud2015).
The east side of the plateau crest is scalloped by glacial cirques, including the Emerald Lake basin, indicating ice accumulation related to wind-blown snow (e.g., Dohrenwend, Reference Dohrenwend1984). Based on Larson's (Reference Larson1996) mapping of surface moraines, the basin's cirque glaciers were ~2 km in longitudinal extent, and the lake is naturally impounded by a ridge of Pleistocene till ~3 m higher than the modern lake (Fig. 2). The lake is primarily spring fed (i.e., a few minor ephemeral inflow streams occur and there is no surface outflow). A normal fault extends north-south across the Emerald Lake basin. The fault trace is located east of the lake, ~40 m lower than the lake surface, where a spring discharges. Witkind et al. (Reference Witkind, Weiss and Brown2006) mapped the fault, which crosscuts the left and right lateral moraines, and observed no offsets. However, offset is clear where the fault intersects the west-facing slopes of Block Mountain near a landslide toe. On the north-facing slope of Block Mountain, a landslide postdates the right-lateral moraine. If the landslides were triggered by fault movement, the fact that a slide buried the moraine may indicate post-glacial and potentially Holocene seismic activity, as described for Wasatch Fault segments to the north (Machette et al., Reference Machette, Personius, Nelson, Schwartz and Lund1991; DuRoss et al., Reference DuRoss, Personius, Crone, Olig, Hylland, Lund and Schwartz2016).
Emerald Lake has a surface area of 0.032 km2, a watershed area of 0.412 km2 (watershed-to-lake area ratio of 12.8), and a maximum depth of 8 m in a flat central area. Shallow littoral areas of <2 m water depth occur along the southern margin and along portions of the western shoreline near the landslide that moved down the east-facing cirque (Fig. 3A). Where the landslide toe is submerged, it slopes steeply downward towards the lake's depocenter. Shallow margins to either side indicate that a landslide overran what was a continuous shallow area, thereby reducing the surface area of the lake (Fig. 3B).

Figure 3. Emerald Lake imagery. (A) Oblique view (Digital Globe), (B) overhead (aerial photography), and (C) ground view and core locations A/C and D (photo credit, Lesleigh Anderson). The modern shoreline in (A) is outlined in dark blue. The landslide into the lake is outlined in (A) and (B) with yellow, and the inferred pre-landslide extent of the shallow marl bench is outlined in light blue. The location of the ground view is shown by a green star in (A) and (B). The transect A-A’ refers to the schematic block diagram in Figure 9.
The sediments of Emerald Lake reflect the basin's watershed and limnology. The water column is thermally and chemically stratified during the summer, and biologically mediated endogenic calcite precipitates within the alkaline and calcium-saturated epilimnion. Thus, sediments at water depths within the epilimnion contain abundant well-preserved carbonates, but carbonate dissolution during settling within the water column limits the abundance at epilimnetic depths. Allochthonous sediments weathered from the Flagstaff Formation include mudstones, sandstones, calcite, and dolomite. Thus, these detrital sediments are known to have distinct palustrine Flagstaff carbonate stable isotopic values that were influenced by early Paleogene greenhouse climates in addition to paragenesis effects (Bowen et al., Reference Bowen, Daniels and Bowen2008). The detrital carbonates differ in mineralogy and isotopic values from endogenic carbonates, therefore they can be quantified and accounted for in the isotope record.
Vegetation on the summit of the Wasatch Plateau is a mosaic of open grasslands, tundra species, and fragmented stands of mature Engelmann spruce and Douglas fir (Picea engelmannii and Pseudotsuga menziesii, respectively), with lesser occurrence of ponderosa pine (Pinus ponderosa). Local ecosystem dynamics are driven by fire and insect outbreaks as well as weather extremes and herbivory. The extensive Englemann spruce mortality in the Emerald Lake watershed that is evident today (Fig. 3C) mostly occurred in 1986 and 1998 during two historical spruce beetle (Dendroctonus rufipennis) outbreaks, which affected the entire Wasatch Plateau area (Dymerski et al., Reference Dymerski, Anhold and Munson2001). Previous severe disturbance of the landscape occurred during late nineteenth century logging (Morris et al., Reference Morris, Brunelle and Munson2010), and dynamic fire regimes have influenced the landscape throughout the Holocene (Morris et al., Reference Morris, DeRose and Brunelle2015).
Climate of the Wasatch Plateau is significantly wetter and colder than elevations below 2000 m. We obtained the 30 yr climate normal (1980–2010) from the Parameter-elevation Regressions on Independent Slopes Model (PRISM) for Emerald Lake (3090 m asl). Mean annual precipitation ranges from 90–100 cm and mean annual temperatures are between −4°C and −2°C (PRISM Climate Group, 2018). The seasonal distribution of precipitation is strongly biased by winter, with snowfall accounting for ~70% of the annual total and monthly maximums in precipitation occurring between February and April (Mock and Birkeland, Reference Mock and Birkeland2000). Peak snowmelt runoff begins in early May and concludes by mid-to-late June. Snow water equivalent (swe) values in the Emerald Lake area range from 18–68 cm, with a median of ~30 cm, based on data from the United States Department of Agriculture (USDA) National Resource Conservation Service (NRCS) high elevation snowpack telemetry (SNOTEL) Dill's Camp site (2795 m elevation, 1978 to present). Using a snow-to-liquid ratio of 10:1, these swe values yield snowfall depths from ~2–7 m, although higher snow-to-liquid ratios and snow depths commonly occur. While summer precipitation may be associated with northern or western frontal boundaries, it most regularly occurs as intense convection events associated with southerly upper level moisture that is usually related to monsoon dynamics (Adams and Comrie, Reference Adams and Comrie1997; Higgins et al., Reference Higgins, Mo and Yao1998).
METHODS
Emerald Lake sediment cores were retrieved in August 2006 from a securely anchored floating platform with a modified Livingstone piston corer at two sites—designated core A/C at 8 m water depth, and core D at 1.45 m water depth. Core A/C is a 300 cm long composite from the central basin reported by Morris et al. (Reference Morris, DeRose and Brunelle2015) that includes analyses of pollen, charcoal, and radiocarbon of terrestrial plant macrofossils. For this study, core A/C samples were obtained for dry bulk density at continuous 1-cm increments (n = 296). Percent organic and inorganic carbon was determined from dry, pulverized sub-samples using total carbon (TC) and total inorganic carbon (TIC) measurements from a UIC Inc.™ CO2 coulometer (Engleman et al., Reference Engleman, Jackson and Norton1985). Percent organic carbon was calculated as the difference between TC and TIC. Percent organic matter (%OM) was calculated as 2.5 times TOC, an approximation based upon the molar fraction of carbon in organic hydrocarbons. Percent carbonate was calculated as TIC/0.12, where 0.12 is the molar fraction of carbon in CaCO3. The accuracy and precision for both TC and TIC is 0.1%, as determined by sample runs and internal standards.
Shallow water core D consists of five overlapping sections, including the undisturbed sediment-water interface, which was extruded in the field at 0.5-cm increments to 56 cm depth (Glew et al., Reference Glew, Smol, Last, Last and Smol2001). Overlapping core D sections were correlated based on visual and physical properties to produce a composite core of 250 cm length. After taking whole core magnetic susceptibility measurements of the core sections at 1-cm increments with a Bartington™ susceptibility meter, all sections were split, photographed, and visually logged for biogenic features, sedimentary structures, composition, and Munsell color. Contiguous samples were obtained at 1.0-cm increments for dry bulk density and carbon analyses.
Core D carbonate isotope analyses were conducted on contiguous 1-cm samples (n = 249), as described below. The macroscopic carbonate particles identified include charophyte stem encrustations, ostracode valves, gastropods, and bivalve shells and fragments. Microscopic carbonate grains were identified as calcite and dolomite using Scanning Electron Microscopy (SEM) and Energy Dispersive Spectroscopy (EDS). To separate the fine-grained bioinduced carbonates from larger biological and allocthonous particles, samples were wet sieved through nested screens (250, 125, 63, 32 μm), collected separately, and freeze-dried. The finest fractions, either the <32 μm size, or the <32 μm size combined with the 32–63 μm sizes (if the <32μm sample was of insufficient mass by itself), were visually examined for purity and powdered before subsampling for CO2 extraction by a Kiel automated device coupled with a Finnigan Delta 252 isotope ratio mass spectrometer. Calcite oxygen and carbon isotope ratios are reported in per mil (‰) as the relative isotope-ratio difference from the international standard VPDB defined by two equations.

and

Determined analytical uncertainties are ± 0.05‰ and 0.1‰ for oxygen and carbon, respectively, and analyses of random replicate samples fell within the range of analytical error.
Core D mineralogy was determined for samples at 2-cm increments (n = 151) by semi-quantitative X-ray diffraction (XRD) techniques (Moore and Reynolds, Reference Moore and Reynolds1989). Each sample was packed into an aluminum holder and scanned from 15–50° 2θ at 2° 2θ/min using Ni-filtered, Cu-Ka radiation at 45 kV, 30 ma with peak intensities recorded as counts per second (cps). Mineral identification used automated peak-search, and peak areas were quantified against standards. Results were obtained as the peak intensity of the main XRD peak for each mineral and reported as a percentage of the sum of the main XRD peak intensities of all minerals. To improve raw XRD mineral percentage precision for the carbonate minerals of foremost interest here, the XRD data were normalized to coulometric TIC following equations in Shapley et al. (Reference Shapley, Ito and Donovan2009).
Near-surface lake-water samples obtained for chemistry and isotope analyses were taken in 100 ml and 30 ml HDLP NalgeneTM bottles. Isotope samples were sealed with no head space, and water chemistry samples were unfiltered and acidified. Lake-water anion, cation, and alkalinity analyses were conducted on unfiltered samples at the USGS Colorado Water Science Center using standard methods for inductively coupled plasma atomic emission spectrometry, ion exchange chromatography, and gran titration by an automatic titrator. Detection limits for all species are >0.015 mg/L. Water samples were prepared for oxygen and hydrogen isotopes by automated constant temperature equilibration with CO2, and automated H/D preparation by chromium reduction, coupled to an isotope ratio mass spectrometer. Water isotope results are reported in per mil (‰) as the relative difference of isotope ratios (∂) from the international measurement standard Vienna Standard Mean Ocean Water (VSMOW) defined by two equations.

and

Determined analytical uncertainties are within ± 0.5‰ and ± 0.05‰ for hydrogen and oxygen, respectively. Analyses of random replicate samples fell within the range of analytical error. Emerald Lake surface and water column measurements were collected in August 2006, with a calibrated Eureka AmphibianTM and MantaTM sonde.
The core D chronology is based on 19 AMS radiocarbon measurements of identified plant macrofossils (Table 1). Terrestrial plant macrofossils were not present in sufficient quantities at some stratigraphic levels, so in some cases aquatic plant macrofossils were used. To evaluate lake water 14C reservoir effects, age offsets were determined for two pairs of terrestrial and aquatic samples obtained from the same sediment depths of 152 cm and 170 cm. Aquatic age differences of +480 and +550 14C years, respectively, provide an average age correction of 515 14C years, which was subtracted from the 14C ages of only the aquatic samples prior to age calibration. Both measured and calibrated ages (Calib 8.2, IntCal20; Stuiver et al., Reference Stuiver, Reimer and Reimer2021) are reported and calibrated ages (cal yr BP) are used for discussion. The core A/C chronology by Morris et al. (Reference Morris, DeRose and Brunelle2015) is based on eight AMS radiocarbon ages, all from terrestrial macrofossils, and no reservoir corrections were applied. The calibrated core A/C ages are updated here using Calib 8.2.1 and the IntCal20 dataset.
Table 1. Emerald Lake, Utah, radiocarbon data.

a Not used in age-depth model.
b From Morris et al. (Reference Morris, DeRose and Brunelle2015) recalibrated with Calib v.8.2.1 (IntCal20) 14C ages.
c CURL = Institute of Arctic and Alpine Research (INSTAAR) Radiocarbon Laboratory, USGS = USGS Geoscience and Environmental Change Science Center Radiocarbon Laboratory, WW = USGS Reston Radiocarbon Laboratory, CAIS = Univ. of Georgia Center for Applied Isotope Studies.
RESULTS
Limnology
Water column measurements at the maximum water depth of 8 m were taken in August 2006 and a thermocline was present between 5–6 m depth with the onset of a steep decline in temperatures from surface values of 16.5°C to a low of 9°C (Fig. 4A). Corresponding declines with depth occurred in pH, from 8.94 to 7.13, and dissolved oxygen (DO), from 9.93–2.93 mg/L, whereas specific conductivity (Spc) increased from 97–142 μS/cm. Dissolved strontium (Sr) was relatively high (Table 2). The alkaline (Mg-Ca-HCO3-type) waters were determined to be saturated with respect to calcite and aragonite, based on analyses by the Geochemists Workbench v 9.0 program. No aragonite was observed in the sediments by x-ray diffraction; nor were evaporites evident, either in the sediments or along the exposed shorelines examined in 2009, which were dominantly silt and sand-sized silicate grains.

Figure 4. Emerald Lake water column measurements (A) and (B) lake water isotope ratios shown with nearby Utah plateau lakes that form a local evaporation line (LEL) with a lower slope than the global and local meteoric water lines (GMWL, LMWL). The LMWL is by Friedman et al. (Reference Friedman2002b). DO = dissolved oxygen; Spc = specific conductivity.
Table 2. Aqueous and isotopic geochemistry of Emerald Lake, Utah.

1 Following the equations of Epstein et al. (Reference Epstein, Buchsbaum, Lowestam and Urey1953), Tarutani et al. (Reference Tarutani, Clayton and Mayeda1969), Friedman and O'Niel (Reference Friedman and O'Niel1977)
Isotope Hydrology
In 2006 and 2007, Emerald Lake water ∂18O values were −12.1‰ and −11.1‰ and d2H values were −98‰ and −94‰, respectively. These values plot on a local evaporation line (LEL) defined by the regression with a slope of 4.9 based on lakes and spring water collected from nearby lakes on the Wasatch Plateau and other nearby high plateau areas for this study (Fig. 4B; R2 = 0.98; Table S1). Seasonal precipitation isotope values for Utah described by Friedman (Reference Friedman2002b) define a local meteoric water line (LMWL) with a slope of 7.7 and ∂18O range between −2‰ and −20‰ (1991–1996—Brian Head, Cedar City, Delta, Hanksville, and Price; also see Marchetti et al., Reference Marchetti, Anderson, Donovan, Harris, Huth, Emerman, Bowen, Schamel and Simmons2018). The intersection of the LEL with the LMWL and the global meteoric water line (GMWL, slope = 8) provides an estimate for the ∂18O of mean annual precipitation between −15‰ and −16‰, which is similar to other regions in the intermountain west with a snow-dominated seasonal precipitation balance (Anderson et al., Reference Anderson, Berkelhammer, Barron, Steinman, Finney and Abbott2016a). Lake water isotope values along the LEL trajectory away from the intercept reflect progressive enrichment in heavy isotopes (18O and 2H) in response to evaporation (Gibson et al., Reference Gibson, Edwards and Prowse1996). The position of Emerald Lake on the LEL indicates evaporative enrichment of approximately +4‰ for ∂18O, reflecting moderate sensitivity compared to values upwards of ~8‰ at other lakes on the LEL from similar settings. Interannual variations in the ∂18O values of mean annual precipitation are typically within a smaller range of 2‰ (Friedman, Reference Friedman2002b).
Core lithologies
Core D was divided into four limnic facies based on color, structure, texture, and bulk sedimentary compositions (Fig. 5). From the base of the core moving upwards, Unit I (250–230 cm depth) is composed of faintly bedded, light gray clayey silt. Aquatic macrofossils include trace amounts of bivalve shells (likely Pisidium), Chara sp. oogonia, and fine rootlet fragments. Picea sp. needles and cone and bark fragments occur near the upper boundary (Fig. S1). The relatively high values of magnetic susceptibility (~1.5 SI) and dry bulk density (0.75 g/cm3) at the base of the core steadily decline upwards in Unit I as percentages of organic matter (%OM) rise (<5–20%) and inorganic carbonate decline (70–40%).

Figure 5. Core D lithologic units, bulk magnetic susceptibility (black) and dry bulk density (brown), percent inorganic carbon (%CaCO3, red) and organic matter (%OM, blue), and the age-depth model. Age control points are shown in black with 1σ error bars. Omitted ages are shown in gray. Red outlines denote the 95% confidence limits of the age model.
The transition to Unit II (230–170 cm) is marked by a color shift to light gray olive brown mottled marl with occasional dark olive gray bands. The marl is abundant in herbaceous aquatic material, and contains Potamogeton sp. seeds, gastropods, Daphnia egg cases, fine rootlets, and insect parts. Terrestrial macrofossils include charcoal, bark and cone fragments, and needles of Picea sp. and Pseudotsuga menziesii. Dry bulk density values (~0.2 g/cm3) and low magnetic susceptibility (<1 SI) reflect the higher OM (20–40%) and carbonate (40–75%). Although mottled, the marl is strongly bedded, with alternating bands of slightly lighter and darker olive brown color.
The transition to Unit III is an abrupt boundary marked by a change in grain size texture and composition to a massive monochromatic silty gyttja (170–110 cm depth). The boundary is marked by an abrupt rise in magnetic susceptibility and % OM and a carbonate decline from ~70–20%. Above the boundary, dry bulk density values and color banding remain unchanged while the bedding becomes diffuse. A very large wood/bark fragment at 152 cm depth occurs with peak values of magnetic susceptibility where carbonate is entirely absent. Above this depth, a gradual rise in carbonate is tracked by declines in magnetic susceptibility and %OM. Macrofossils in Unit III are significantly less abundant than in all other units and, where present, are dominated by undifferentiated aquatic herbaceous material (Fig. S1).
The transition to the base of Unit IV (110–0 cm depth) is a gradual return to mottled textures and higher percentages of carbonate (>40%), with a decline in magnetic susceptibility values. Unit IV has similar macrofossil types as Unit II, is rich in Picea sp. needles, and includes Chara sp. stem casts, but lacks oogonia and Daphnia. A complete and intact conifer cone occurs at 97 cm depth.
For this study, the sediment characteristics of Core A/C were evaluated in further detail and divided into two limnic facies based on composite core photographs (Fig. S2). Basal Unit I (296–250 cm) is bedded silty olive brown marl, with intermittent mottling, and high yet variable values of dry bulk density (0.4–0.6 g/cm3), percent carbonate (2–40%), and %OM (20–40%). Near the upper boundary of Unit I are occasional mm-scale white bands below a transition to massive olive brown gyttja, which characterizes Unit II (240-0 cm). Moving upwards through Unit II, dry bulk density values gradually decline to values near 0.1 g/cm3 for the upper 50 cm of the core. Throughout Unit II, OM fluctuates between 25–40%, whereas percent carbonate is near zero at the base and gradually rises and remains near ~25% before a decline to near zero in the upper 30 cm.
Age Models and Sedimentation Rates
Age-depth models were generated using the Bayesian software ‘rbacon’ package v.2.5.3 in R (Blaauw and Christen, Reference Blaauw and Christen2011; Blaauw et al., Reference Blaauw, Christen, Aquino Lopez, Vazquez, Gonzalez, Belding, Theiler, Gough and Karney2021), which includes IntCal20 calibrations. Default prior assumptions were used. For core D, three aquatic plant macrofossil samples at 173 cm, 186 cm, and 205 cm depth were omitted because the median calibrated reservoir-corrected ages were statistically identical to one another within the range of 1σ error. The large bark fragment sample at 154 cm depth was omitted because the age of 4295 cal yr BP was stratigraphically young by several centuries, possibly because of settling due to its large size. The resulting model for Core D has an average error range of ± 170 years with a maximum of ± 330 years between 100–150 cm depth, where a single aquatic Potamogeton sp. seed at 126 cm was the only suitable material to be found. The average rate of sediment accumulation for core D is 0.06 ± 0.07 cm/yr. Maximum rates of 0.26 cm/yr occur within Unit II, between ca. 6000–5600 cal yr BP, below the abrupt boundary. Minimum rates of 0.012 cm/yr occur within Unit III between 4000–2800 cal yr BP.
For core A/C, one unusually old age at 81 cm depth of 2520 cal yr BP from a conifer needle was omitted because it generated unrealistic changes in sedimentation rates. The resulting error range for core A/C age is larger than core D, with an average of ± 300 years and maximum of ± 700 years where ages were extrapolated to the bottom of the core (Fig. S2). Core A/C sediment accumulation rates are 0.06 ± 0.06 cm/yr, with maximum rates of 0.25 cm/yr occurring within the upper 5 cm, which represents that past ca. 50 years. Minimum rates of 0.010 cm/yr occur at the base of the core from ca. 10,000–6500 cal yr BP.
Mineralogy
Core D mineral sediments are composed of calcite with lesser dolomite, quartz, and feldspar, which are detrital minerals in this setting (Figs. 6, S3). Prominent mineralogic change corresponds with the four lithic units that are hereafter described by age. Between 7150–5530 cal yr BP, in Units I and II, calcite is dominant (40–60%) with minor quartz (~10%), trace dolomite and feldspar (<3%). At ca. 5500 cal yr BP, an abrupt rise in dolomite (+25%) and quartz (+5%) occur with major decline in calcite (−60%) that coincides with the depth of the abrupt boundary that marks the transition from Unit II to III. During the next several centuries, calcite is absent as dolomite and quartz gradually decline to trace values by ca. 5000 cal yr BP. By ca. 4700 cal yr BP trace amounts of calcite reappear intermittently before an abrupt rise in quartz (+30%) at ca. 4500 cal yr BP, which becomes the dominant mineral (up to 45%) between ca. 4500–2650 cal yr BP, with minor calcite (10–20%) and trace dolomite (~5%). Over the next two centuries (ca. 2650–2450 cal yr BP) quartz values decline precipitously to trace levels, with several rapid fluctuations of 20–30%, as calcite increases by +40% to become the dominant mineral (>50%) in Unit I. Within Unit I, lower calcite abundances occurred during brief peaks in quartz (~30%) at ca. 1000 cal yr BP and 500 cal yr BP.
Carbonate Stable Isotopes
Core D isotope results of bulk carbonate analyses reflect varying proportions of endogenic calcite, detrital dolomite, and detrital calcite. A binary endogenic calcite and detrital dolomite mixture is assessed by taking the fraction of dolomite (of total carbonate) multiplied by Flagstaff dolomite values of −5.7‰ for δ18O and −8.3‰ for δ13C (Bowen et al., Reference Bowen, Daniels and Bowen2008), subtracted from raw δ18O and δ13C values, respectively, and divided by the fraction of calcite of total carbonate.

and

The result of dolomite normalization lowers raw carbonate isotope values up to −2‰ for oxygen and carbon, in proportion to dolomite abundance (Fig. S4). Normalized δ18O values range from approximately −9‰ to −16‰, which overlap values of modern sediments and living Chara. Normalized δ13C values range from ~2‰ to −2‰, and the structure of the raw stratigraphic isotopic trends for both C and O remains intact. Between ca. 7150–6750 cal yr BP, dolomite-normalized values of δ18O (Unit I) vary between −14‰ and −16‰ (Fig. 6). From 6750–5530 cal yr BP (Unit II) values increase, varying between −13.5‰ and −12.5‰. The loss of carbonate at the time of the abrupt boundary, ca. 5500 cal yr BP, interrupts the isotope record, therefore no data could be obtained (Unit III). The δ18O record resumes at ca. 4000 cal yr BP (Unit IV) with an increase in values to −10‰ at ca. 3500 cal yr BP, which coincides with high proportions of detrital quartz. At ca. 2500 cal yr BP, values precipitously decline to −14.5‰ in <500 years, with a corresponding decline in detrital quartz. Subsequently, when detrital minerals are at trace levels, δ18O values abruptly rise to approximately −12‰ by ca. 2000 cal yr BP and decline to approximately −14.5‰ by ca. 1600 cal yr BP. For the past ca. 1500 years, values vary between −14‰ and −13‰. The exceptions are two prominent positive excursions to values near −10‰, which coincided with a rise in detrital quartz at ca. 1000 cal yr BP and 500 cal yr BP.

Figure 6. Core D carbonate δ18O and δ13C (dolomite-normalized, note reversed δ13C axis) shown with abundances of calcite, dolomite (purple), and quartz (orange) plotted against age (cal yr BP). Percentages of dolomite indicate detrital influence on calcite abundance and are used to normalize the carbonate isotope values. Mineral abundances are normalized by percent carbonate using coulometric values of Total Inorganic Carbon (TIC).
Dolomite-normalized values of δ13C covary with higher δ18O values that are greater than −12‰ in a manner that is commonly observed for hydrologically closed lakes (Talbot, Reference Talbot1990; Horton et al., Reference Horton, Defliese, Tripati and Oze2016), which also coincides with higher proportions of detrital minerals (Fig. 7). Low δ values in both isotopes are more widely scattered, which is frequently observed for lakes with shorter residence times and higher hydrologic connectivity through sub-surface flow. Higher carbonate abundance in Emerald Lake occurs with lower lake δ18O values, a relationship that previously has been observed to indicate that reductions in calcium-rich groundwater inflow in response to dry conditions also can impose limitations on carbonate production (Shapley et al., Reference Shapley, Ito and Donovan2005).
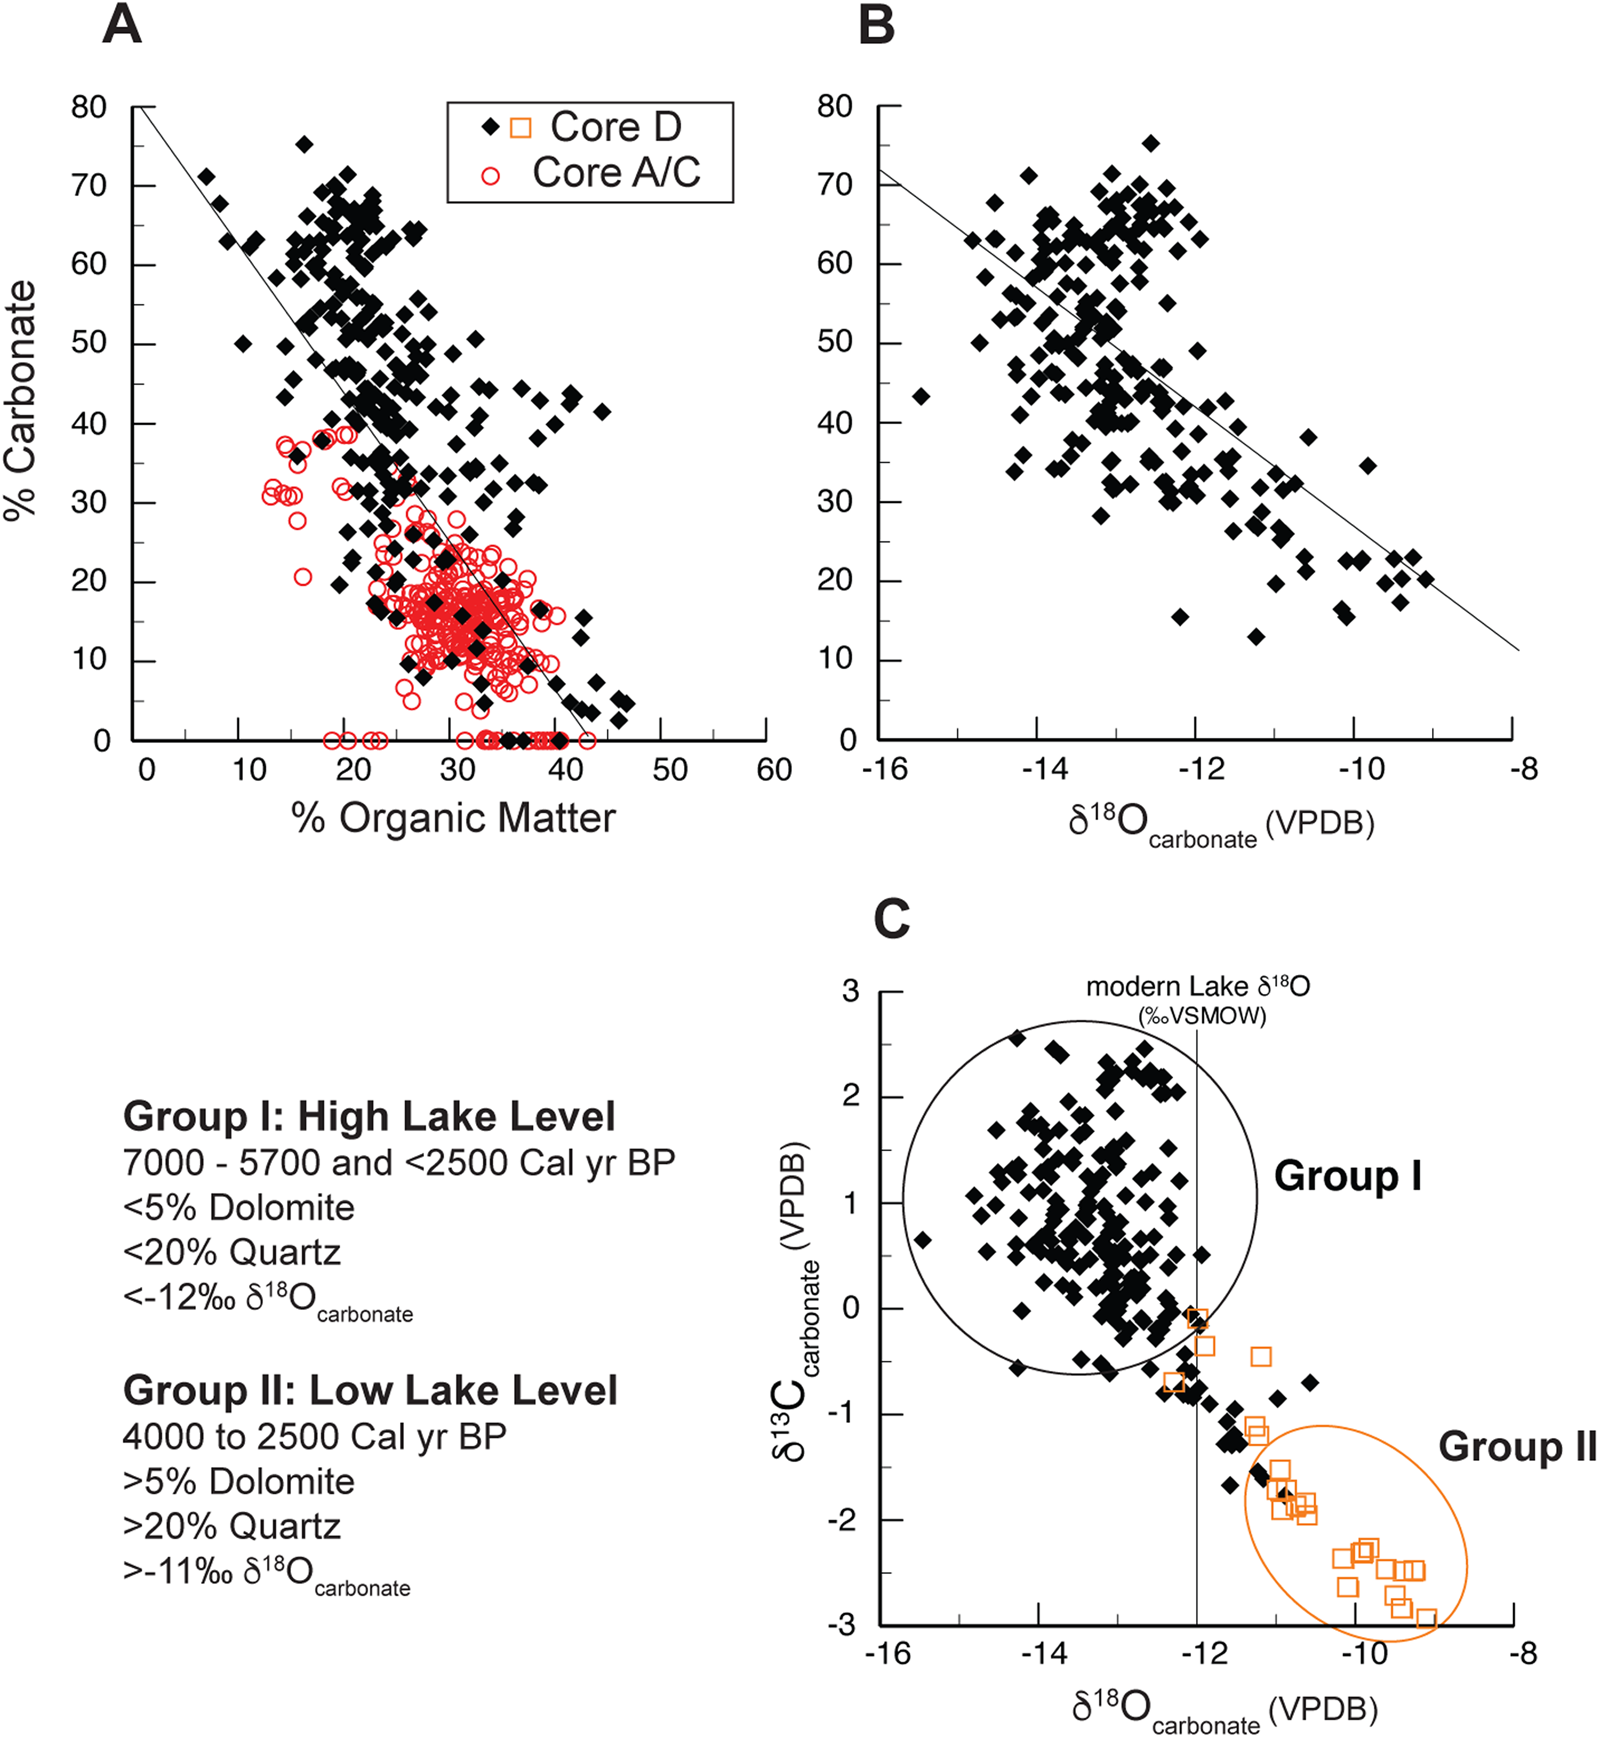
Figure 7. Sediment associations for (A) organic matter and carbonate abundances, core D in solid black, core A/C in open red. (B) Core D percent carbonate and carbonate δ18O (dolomite normalized), and (C) carbonate δ18O and δ13C (dolomite normalized) grouped by detrital mineral abundance (higher in open orange) and inferred lake level.
DISCUSSION
The results from Emerald Lake are discussed first in terms of lake-level change, including the landslide event, based on the interpretation of sedimentology, mineralogy, and geochronology from both sediment cores A/C and D (Figs. 8, 9). This is followed by the rationale for the carbonate oxygen isotope interpretation of core D and the paleoclimatic reconstruction for the high plateau region of central Utah (Fig. 10). The reconstruction is then compared with regional records in the Upper Colorado River basin, the Great Basin, and the northern Rocky Mountain regions, including comments regarding the ‘Late Holocene Dry Period’ (Mensing et al., Reference Mensing, Sharpe, Tunno, Sada, Thomas, Starratt and Smith2013).

Figure 8. Stratigraphic variations in sediment composition for core A/C (left, 8 m water depth) and core D (middle, 1.3 m water depth) with chronological lake level interpretations (right). All units are in percent for carbonate (red, CaCO3), organic matter (black, OM), and, for core D, detrital dolomite (purple), and quartz (orange).
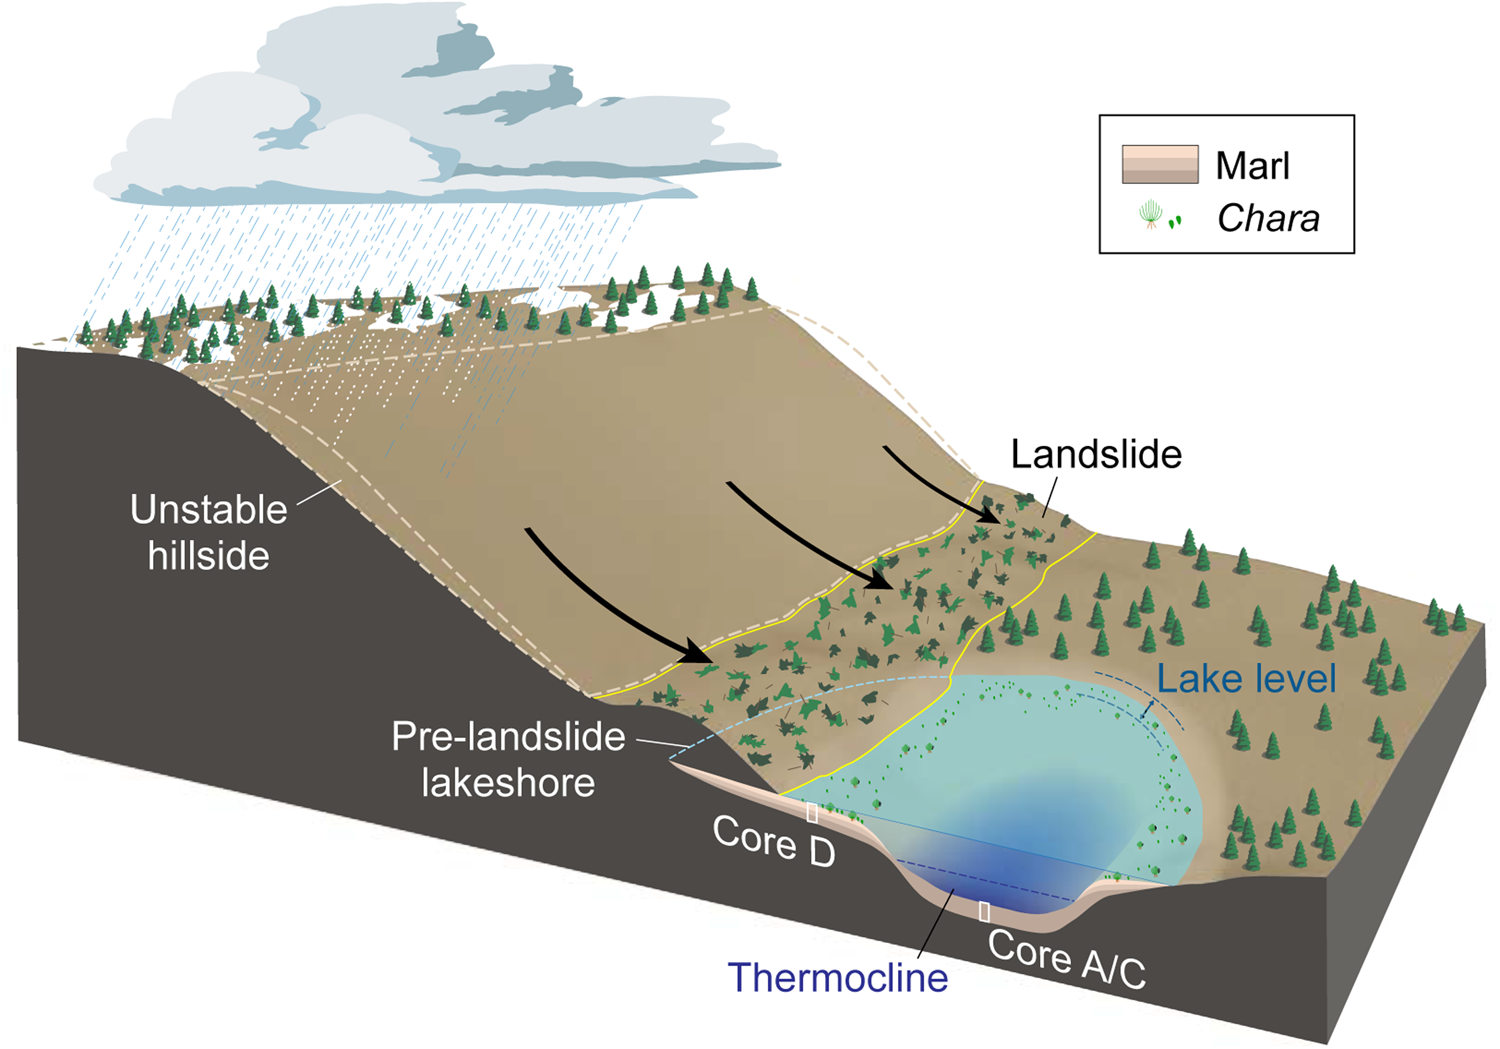
Figure 9. Schematic illustration of the Emerald Lake basin across A-A' (Fig. 3C) showing the lake and watershed processes affected by the landslide at the core A/C and D locations. During a wet period with rising lake levels (ca. 5500 cal yr BP), a landslide moved down the unstable cirque hillslope and entered the lake, moving towards the core D location and reducing the lake's volume. Stratification of the lake's water column led to higher sedimentary carbonate abundances above the thermocline, producing marl benches (light blue water color) rich in Chara (green algae). Less carbonate accumulated below the thermocline (dark blue) because carbonate dissolved while settling through the water column. Lake stratification strengthened with higher lake levels and weakened with lower lake levels.

Figure 10. Regional record comparison between latitude 37° and 40°N from low-elevation western sites (left, 114.5°W, eastern Nevada) to high-elevation eastern sites (right, 107°W, western Colorado). Inferred wet and dry periods at Stonehouse Meadow (1910 m elevation; Mensing et al., Reference Mensing, Sharpe, Tunno, Sada, Thomas, Starratt and Smith2013); δ18O anomalies at Lower Pahranagat Lake (975 m elevation; Theissen et al., Reference Theissen, Hickson, Brundrett, Horns and Lachniet2019). Emerald Lake (red, this study) in central Utah (3090 m elevation) with periods of low lake levels indicated by orange shaded boxes to the right of the vertical Holocene average and high lake levels in green to the left, and Yellow and Bison lakes (3140 m and 3255 m elevation, respectively; Anderson, Reference Anderson2011, Reference Anderson2012; Anderson et al., Reference Anderson, Berkelhammer, Barron, Steinman, Finney and Abbott2016a, Reference Anderson, Berkelhammer and Mast2016b), which indicate a precipitation transition from summer monsoon to winter ENSO/PDO regimes. LIA = Little Ice Age, MCA = Medieval Climate Anomaly.
Holocene lake levels and landslide activity
Following the last retreat of Pleistocene glaciers on the Wasatch Plateau, early Holocene limnic sedimentation began in the Emerald Lake basin by at least ca. 10,000 cal yr BP, according to an age from core A/C that is ~40 cm above the base of lacustrine sediments. The onset could be as early as ca. 11,300 cal yr BP, if age model extrapolation to the base of the core is accurate (Fig. S2). Relatively dry Early Holocene conditions are indicated by slow sedimentation rates, whereas high carbonate preservation in core A/C suggests that the early lake was too shallow to support extensive carbonate dissolution, either endogenic or allocthonous, within the water column (e.g., <4 m depth; Fig. 4A). Significant organic matter accumulation indicates that the early shallow pond was biologically productive. This is consistent with pollen indicators, including cattail (Typha spp.) and willow (Salix spp.), within a sub-alpine spruce-fir forest. Relatively low charcoal levels indicate an infrequent and relatively low-severity fire regime (Morris et al., Reference Morris, DeRose and Brunelle2015).
After ca. 8500 cal yr BP, increased carbonate in core A/C and corresponding organic matter decline is consistent with processes whereby organic carbon production promotes or deters carbonate preservation by regulating rates of dissolution, commonly known as the ‘carbon pump’ (Dean, Reference Dean1999; Wittkop et al., Reference Wittkop, Teranes, Dean and Guilderson2009; Fig. 7A). However, rising carbonate amounts also could indicate reworking of material from early development of the marl bench around the margins of the lake's depocenter (Figs. 3B, 9).
By ca. 7200 cal yr BP, marl accumulation began at the core D location while carbonate abundance in deeper water depths remained unaltered, indicating that lake levels had risen to water depths of ~5–5.5 m, thereby allowing sediment accumulation at the core D site. Subsequent rapid accumulation of shallow water marl in core D (by ~50 cm) between ca. 6500–5500 cal yr BP indicates rising lake levels to depths exceeding ~6.5–7 m. The corresponding carbonate decline in core A/C also supports a deeper water column, enhanced stratification, and higher carbonate dissolution in the hypolimnion. This Early to Middle Holocene lake level rise indicates increasingly wet conditions coinciding with a period of limited fire conditions (Morris et al., Reference Morris, DeRose and Brunelle2015) before landslide movement down the cirque face into Emerald Lake occurred.
The landslide is documented by core D sediments, proximal to the slump toe (Fig. 9) by (1) a prominent sedimentary change; (2) disappearance of endogenic carbonate; and (3) a pulse in detrital minerals, all at a stratigraphic position that immediately overlies a radiocarbon age of ca. 5520 ± 50 cal yr BP. Therefore, the lake's sediment record is consistent with the slump toe superimposed onto the marl bench, which also indicates that the landslide post-dates marl bench development. Additionally, carbonate increased in the lake's depocenter (seen in core A/C), which is consistent with remobilization of shallow marl sediments. The lack of carbonate in core D between ca. 5400–4500 cal yr BP reflects raised lake levels in response to the landslide, which disturbed near-shore sediments and inhibited marl bench growth, while the spike in detrital dolomite and quartz reflects the sudden change in available near-shore sediment.
After the landslide episode, a prominent rise in quartz at the core D location, beginning at ca. 4500 cal yr BP, is distinct from the inferred landslide detrital signature (Fig. 6). Although the initial increase in quartz is similar with a pulse in dolomite, the dolomite rise is smaller and then declines to trace levels as quartz continues to rise and remain elevated for the subsequent ca. 2000 years. In further contrast to the sediment record immediately after the landslide when endogenic carbonate disappears, here, endogenic carbonate begins to increase gradually. The interpretation of the quartz pulse is that it represents lake level lowering and re-working of the shoreline sediments, perhaps in conjunction with erosion of the slump surface and dust inputs. Further investigation into the source of quartz, including soil development on the slump surface, is warranted.
The inferred lake level decline during this period coincides with an increase in charcoal abundance, reflecting increased fire frequency and severity (Morris et al., Reference Morris, DeRose and Brunelle2015). The lake's deep-water sediments were unaffected by lake level decline, likely because it was not great enough to alter either lake stratification or rates of carbonate dissolution. The increase in shallow water detrital quartz corresponds with inhibited marl bench growth indicated by reduced sedimentation rates. Chara thrives in undisturbed clear water in calm offshore areas, conditions that appear to return by ca. 2500 cal yr BP corresponding with quartz declines and rising water levels to modern conditions. During the past ca. 2500 years, near-modern lake levels indicate relatively wet conditions compared to the Middle and Early Holocene, although brief low stands and dry periods are indicated by higher frequency variations in quartz.
Oxygen isotope interpretation and paleoclimatic reconstruction
The stratigraphic variations in sedimentary carbonate δ18O values (dolomite-normalized) are interpreted as a proxy for variations in lake δ18O values based on modern data (Fig. 4B; Table 2), which indicate that carbonate sediments of endogenic origin are in isotopic equilibrium with lake water. In turn, Emerald Lake δ18O is influenced by evaporative enrichment and shifts in the relative proportions of winter and summer precipitation, which strongly covary with precipitation source and temperature. Higher lake δ18O values indicate increased rates of evaporation, relative to precipitation, during the ice-free season from June through September, and therefore lower effective moisture (i.e., lower P-E). Higher values may also reflect more summer rainfall relative to winter snowfall. Summer rainfall in the Upper Colorado River region is associated with warmer temperatures and convection of recycled moisture derived from the south (Friedman Reference Friedman2002a; Anderson Reference Anderson2012). Lower lake δ18O values can reflect more winter snowfall relative to rainfall and higher effective moisture (i.e., higher P-E) if winter precipitation exceeds summer evaporation. In central Utah, winter snowfall is associated with cold temperatures and North Pacific moisture sources (Friedman, Reference Friedman2002a).
The resulting Emerald Lake δ18O inferred paleoclimatic interpretation is described in terms of anomaly values relative to the Holocene average of −12.8‰ (Fig. 10), which is similar to the water isotope values of the modern lake. This approach standardizes the influence that detrital proportions of carbonate exert on absolute δ18O values and differences. The interpretation of the lake's volumetric and isotopic evolution is carefully framed by the lake level reconstruction, which reflects changes in effective moisture and P-E.
Negative lake δ18O anomalies from ca. 7200–6800 cal yr BP (Fig. 10) are attributed to higher effective moisture as lake levels rose and the lake's surface area expanded over the core D location. The early negative lake δ18O anomalies could also reflect a local influence on nearshore carbonates by nearby spring discharge points, which can produce relatively low δ18O values in the near vicinity. A lake-wide response to higher snowfall proportions is a less likely explanation considering the context of regional comparisons discussed in further detail below. Lake δ18O anomalies were positive by ca. 6600 cal yr BP, and are interpreted to reflect a rain-dominated precipitation balance when lake levels rose in response to higher effective moisture. Lake δ18O anomalies subsequently fluctuated near the Holocene average as lake levels were rising in concert with marl bench sedimentation, suggesting lake-water isotopes were in steady state during increasingly wet climate conditions. The landslide occurrence at ca. 5500 cal yr BP during relatively wet paleohydrologic conditions potentially implicates a climatic trigger for the slope failure (e.g., Shurtliff et al., Reference Shurtliff, Nelson, McBride, Rey, Tucker, Godwin and Tingey2017). The lack of erosion in the lake sediment record, or presence of larger grained clasts, suggests low energy landslide movement such as slump-creep rather than movement in a rapid, catastrophic sense. However, there is currently no evidence that allows rejection of a seismic trigger related to any of the numerous faults within the area (Machette et al., Reference Machette, Personius, Nelson, Schwartz and Lund1991).
Between ca. 4000–2500 cal yr BP, positive δ18O anomalies reflect low lake levels driven by dry climatic conditions (Fig. 10). The interval is exceptional in duration and demonstrates levels of aridity that approach the unprecedented aridity of the Early Holocene. By ca. 2800 cal yr BP, a return to wet conditions driven by higher amounts of snowfall relative to rainfall was underway, reflected by a shift to negative lake δ18O anomalies between ca. 2200–2000 cal yr BP. A rapid shift from negative to positive anomalies between ca. 2000–1800 cal yr BP indicates a return to dry conditions that was relatively brief by comparison with previous dry periods. Subsequently, a wetter, cooler, snow-dominated climatology persisted between ca. 1800–1000 cal yr BP with negative lake δ18O anomalies in an apparent isotopic steady state with wetter and colder climatic conditions. Hydroclimatic variations became more frequent during the Medieval Climate Anomaly (MCA; ca. 1000–700 cal yr BP, AD ca. 950–1250) with dry periods leading to low lake levels at ca. 1000 cal yr BP and 500 cal yr BP, potentially caused by reductions in winter precipitation and limited summer rains. In contrast, persistently negative lake δ18O anomalies indicate a wet, cool, snow-dominated climatology during the Little Ice Age (LIA; ca. 650–100 cal yr BP, AD ca. 1300–1850). By comparison to the LIA, relatively reduced snowfall and dry conditions characterize the past ca. 100 years, which approximate the Holocene average.
Regional Comparison
The high elevation paleoclimatic reconstruction from Emerald Lake in central Utah based on multiproxy data shows paleoclimatic variations at time scales ranging from millennia to decades and allows for geographical comparison between the Great Basin of eastern Nevada and the Upper Colorado River basin (Fig. 10). Conditions that were significantly drier than modern occurred between ca. 10,000–7000 cal yr BP, as indicated by low and rising Emerald Lake levels. This result corresponds with orbital forcing by trends in summer solar insolation that are consistent with strengthened monsoon rainfall and concurrent with northward retreat of the Laurentide Ice sheet (Epstein and Xu, Reference Epstein and Xu1999; Sjostrom et al., Reference Sjostrom, Hren and Chamberlain2004; Anderson, Reference Anderson2011; Metcalf et al., Reference Metcalf, Barron and Davies2015; Bhattacharya et al., Reference Bhattacharya, Tierney, Addison and Murray2018; Huth et al., Reference Huth, Cerling, Marchetti, Bowling, Ellwein, Passey, Fernandez, Valley and Orland2020). During this period, isotopes of laminated soil carbonate rinds in Torrey, Utah, indicate a trend of low and rising soil moisture at low elevations (~1080 m elevation; Huth et al., Reference Huth, Cerling, Marchetti, Bowling, Ellwein, Passey, Fernandez, Valley and Orland2020). Additionally, a dry early Holocene undergoing a rise in local moisture is inferred at Garden Basin Fen (2400 m elevation), on the slope of the Fish Lake Plateau, from pollen and diatom assemblages, which also corresponds with timing of the Windy Ridge landslide (Shurtliff et al., Reference Shurtliff, Nelson, McBride, Rey, Tucker, Godwin and Tingey2017). Although sub-regional climatic variations are inherently intricate, the collective evidence supports that Early Holocene conditions were the driest of the epoch at latitude ~39–40° N, across the Upper Colorado River basin, from central Utah at Emerald Lake to northwest Colorado, which included contributions from southerly moisture sources usually associated with the monsoon and significant reductions in snowpack.
The rise to near-modern Emerald Lake levels by ca. 7500 cal yr BP and continued rise through at least ca. 5500 cal yr BP, with δ18O variations near both modern and Holocene averages, is indisputable evidence for higher moisture compared to the Early Holocene. Additional evidence for wetter conditions during this period at low elevations in eastern Nevada (Fig. 10) includes initiation of the Spring Valley Stonehouse sedge-meadow (1910 m elevation) by ca. 7500 cal yr BP (Mensing et al., Reference Mensing, Sharpe, Tunno, Sada, Thomas, Starratt and Smith2013), return of marshes at the Blue Lake wetland by ca. 6500 cal yr BP (Louderback and Rhode, Reference Louderback and Rhode2009), and early lake development in the Pahranagat Valley (975 m elevation) by ca. 5800 cal yr BP (Theissen et al., Reference Theissen, Hickson, Brundrett, Horns and Lachniet2019). To the east in Colorado, rising effective moisture during this period is evident by a gradual decline in Bison Lake δ18O values and overflowing lake levels at Yellow Lake (3090 m elevation; Anderson, Reference Anderson2012), as well as higher lake levels in the central Colorado Rockies at 3050 m elevation between 5700–4800 cal yr BP (Shuman et al., Reference Shuman, Carter, Hougardy, Powers and Shinker2014). Although the landslide into Emerald Lake at ca. 5500 cal yr BP was a direct cause for an abrupt rise in lake level, higher levels may have stabilized subsequently between ca. 5500–4000 cal yr BP in part due to wetter conditions, although this is not certain.
These results contrast with interpretations by Lachniet et al. (Reference Lachniet, Asmerom, Polyak and Denniston2020) for aridity intervals at Leviathan Cave between ca. 9000–5000 cal yr BP based on elevated δ18O, δ13C, and slow speleothem growth rates. The elevated cave water δ18O values in their study are also attributed to warmer temperatures; however, alternatives to their explanations also could include southerly moisture sources usually associated with the monsoon (e.g., Huth et al., Reference Huth, Cerling, Marchetti, Bowling, Ellwein, Passey, Fernandez, Valley and Orland2020). The Leviathan δ18O record shows a millennial scale decline between ca. 8000 and 5000 cal yr BP, which to some extent reflects a regional rise in effective moisture as recorded in the Emerald Lake record. Nevada speleothem δ18O, δ13C, and trace element records have shown contrasting trends in different caves (Lachniet et al., Reference Lachniet, Dennison, Asmerom and Polyak2014; Steponaitis et al., Reference Steponaitis, Andrews, McGee, Quade, Hsieh, Broecker, Shuman, Burns and Cheng2015); differences in cave hydrology and/or disequilibrium with elevation are known to influence speleothem proxy sensitivity in unique ways (e.g., Johnston et al., Reference Johnston, Borsato, Spötl, Frisia and Miorandi2013; Weber et al., Reference Weber, Hinz, Schöne, Jochum, Hoffmann, Spötl, Riechelmann and Scholz2021). In addition to cave drip water studies focused on relationships with meteoric water (Oster and Kelley, Reference Oster and Kelley2016), further investigations into surface water relationships are needed because they are directly incorporated into stalagmite proxies (e.g., Anderson et al., Reference Anderson, Berkelhammer and Mast2016b).
Following the Emerald Lake landslide at ca. 5500 cal yr BP, and the relatively wet period thereafter, a multi-millennial dry period between ca. 4000–2400 cal yr BP occurred, which envelopes a previously identified “Late Holocene Dry Period” (Mensing et al., Reference Mensing, Sharpe, Tunno, Sada, Thomas, Starratt and Smith2013), potentially extending the spatial and temporal extent of this episode. The timing of higher Emerald Lake δ18O anomalies and increased detrital minerals between ca. 4000–3500 cal yr BP corresponds with higher lake δ18O values in the Yellow Lake record, which also suggest dry conditions (Fig. 6). Thereafter, the record comparison suggests a time-transgressive drought expansion, based on higher lake δ18O values at Lower Pahranagat Lake that occurred several centuries later, which was then followed by a rise in carbonate preservation at Stonehouse Meadow (attributed to dry conditions) that occurred another several centuries later.
The temporal differences of these shifts may approach the chronological uncertainties of the independent age models (e.g., Zimmerman and Wahl, Reference Zimmerman and Wahl2020), leaving the possibility that some or all of the shifts either were nearly simultaneous, or that the progression of the pattern was slower or faster within centuries. However, it is interesting to note that within this dry interval a brief decline in δ18O anomalies at Emerald and Yellow lakes at ca. 3,200 cal yr BP coincides with the earliest negative δ18O anomaly of the Bison Lake record interpreted to reflect an increase in snow (relative to rain). Whereas the onset of the dry interval is interpreted to reflect lower precipitation and higher evaporation in response to a decline in monsoon precipitation that preceded an increase in snow, the negative δ18O anomaly within the dry period appears to indicate the earliest sign of this transition. This result shows that the unprecedented nature of the mid-Holocene dry period reflects the unique seasonal insolation-driven transition from monsoon to snow, and that the latter half of the dry period was a fluctuating transition to the winter-dominated regime with periods of rapid climate change on time scales of multiple decades to centuries.
Although onset of the dry period appears transgressive, the return to wetter conditions at ca. 2400 cal yr BP was nearly synchronous with rapid shifts to negative δ18O anomalies registered at Lower Pahranagat, Emerald, Yellow, and Bison, indicating complete transition to higher snowfall (relative to rain) on a regional scale at high and low elevations. By ca. 2000 cal yr BP, a rapid return to dry conditions was simultaneously registered by positive lake δ18O anomalies at all four of the sites, which persisted for multiple decades to centuries, and corresponds with multi-decadal drought recorded by tree-ring chronologies in northeastern Utah and the southern San Juan Mountains of Colorado (Knight et al., Reference Knight, Meko and Baisan2010; Routson et al., Reference Routson, Woodhouse and Overpeck2011). This early first millennium dry period is not so clearly registered in northwestern Colorado at Bison and Yellow lakes, which indicate high snowfall and effective moisture conditions near the Holocene average. If this difference represents a northeast-to-southwest precipitation pattern, it is consistent with persistent atmospheric ridging found currently over the Great Basin and jet stream flow over the northern Colorado Rockies driven by the influence of El Niño Southern Oscillation (ENSO) and Pacific Decadal Oscillation (PDO) regimes (Barron and Anderson, Reference Barron and Anderson2011; Steinman et al., Reference Steinman, Abbott, Mann, Ortiz, Feng, Pompeani, Stansell, Anderson, Finney and Bird2014; Liu et al., Reference Liu, Yoshimura, Bowen, Buenning, Risi, Welker and Yuan2014; Anderson et al., Reference Anderson, Berkelhammer and Mast2016b; Du et al., Reference Du, Hendy, Hinnov, Brown, Schimmelmann and Pak2020, Reference Du, Hendy, Hinnov, Brown, Zhu and Poulsen2021).
By ca. 1700 cal yr BP, a rapid shift to higher snowfall (relative to rain) and effective moisture occurred at Emerald and Lower Pahranagat lakes, and persisted at Emerald Lake over the next several centuries. A similar shift to persistent cool and wet conditions at this time is also observed in the northern Rockies (Stone et al., Reference Stone, Saros and Pederson2016; Larsen et al., Reference Larsen, Crump and Blumm2020; Brown et al., Reference Brown, Cartier, Schiller, Zahajská, Fritz, Morgan and Whitlock2021). An elevation contrast is suggested at Lower Pahranagat, which returned to slightly dry or average effective moisture, and a west-east difference across the UCB is suggested by dry conditions at Bison and Yellow lakes. These geographic differences may reflect precipitation patterns with spatial dipole characteristics similar in complexity to those identified by more distant precipitation δ18O and effective moisture comparisons along the margin of western North America from Alaska to southern California (Barron and Anderson, Reference Barron and Anderson2011; Steinman et al., Reference Steinman, Abbott, Mann, Ortiz, Feng, Pompeani, Stansell, Anderson, Finney and Bird2014; Anderson et al., Reference Anderson, Berkelhammer, Barron, Steinman, Finney and Abbott2016a).
The MCA (ca. 1000–700 cal yr BP, AD ca. 800–1300) is characterized by prominent shifts to dry conditions at Emerald Lake at ca. 1000 cal yr BP and at ca. 500 cal yr BP, which is consistent with tree-ring chronologies in northeastern Utah that indicate prolonged droughts by ca. 800 cal yr BP and unprecedented drought at ca. 500 cal yr BP (Knight et al., Reference Knight, Meko and Baisan2010). Large variations in snowpack occurred at this time in northwest Colorado at Bison and Yellow lakes, including dry periods, whereas there is no evident trend at low elevation Great Basin records (Lund and Benson, Reference Lund and Benson2018; Munroe et al., Reference Munroe, Bigl, Silverman and Laabs2018). At this geographic scale, spatial precipitation patterns likely reflect synoptic-scale climatology that support observations by Metcalf et al. (Reference Metcalf, Barron and Davies2015) who found considerable variability in the monsoon region during the MCA, which may reflect transient upper level ridging (Hermann et al., Reference Hermann, Oster and Ibarra2018) and/or persistent El Niño or La Niña regimes that affected both snowpack and summer rains (Anderson, Reference Anderson2012; Hart et al., Reference Hart, Brenner-Coltrain, Boomgarden, Brunelle, Coats, Metcalfe and Lewis2021). The ubiquitously cold and wet LIA pattern observed at all high-elevation lakes in the UCB is also associated with wet conditions at low elevations (Lower Pahranagat Lake, Stonehouse Meadow) and indicates that high winter snowfall driven by jet stream positioning over the intermountain west region persisted for multiple decades.
CONCLUSIONS
Paleoclimate histories that include surface hydrologic response across elevation gradients provide a means to understand natural variations in water supply, and thereby better inform water management for the intermountain west. The new Emerald Lake record combined with other records at ~40°N indicate that throughout the Holocene, extreme dry periods with significant reductions in high elevation snowpack have occurred from the Great Basin to the Upper Colorado headwaters. With the growing collection of high-elevation isotope records, we can begin to place recent changes in snowpack in sub-regions of the UCB, and corresponding water supply variations, within a framework of millennial timescales. The Holocene extremes in snowpack variations expand upon observations based on shorter intervals (Pederson et al., Reference Pederson, Gray, Woodhouse and Betancourt2011; Routson et al., Reference Routson, Woodhouse and Overpeck2011). The Emerald Lake record shows that the Upper Colorado River basin snowpack has undergone high magnitude change on a range of timescales, and that similar variations should be assessed within a twenty-first century context with caution. Framing observed trends within a longer context of multiple centuries to millennia allows more confident identification of significant trends, which will be essential to recognize in terms of future effects on regional water supplies.
Consideration of the evidence herein with respect to the introductory questions is pertinent to the future prognosis for intermountain snowpack. To address the first research question, if Holocene paleohydrologic trends were consistent at high and low elevations, the proxy results show that consistent paleohydrologic variations at both high and low elevations and on millennial to multi-century timescales are common. Consistent multi-decadal variations also appear to occur nearly simultaneously, particularly when snowfall variations during the past ca. 2500 years dominated paleohydrologic trends, although chronological precision at these timescales is currently insufficient for confident correlations. This finding validates regional representation of paleohydrologic reconstructions from low-elevation lakes and wetlands, and these records can be confidently used to represent water source variations. To address the second research question, if paleohydrologic extremes in the Upper Colorado were typically basin-wide or if sub-regional variations common, the results confirm that precipitation extremes in the Upper Colorado were commonly basin-wide, which implies synoptic scale climate-forcing mechanisms, and thereby a potential for predictability. However, varied sub-regional differences are also found, which addresses the third research question that regional precipitation patterns with spatial dipole characteristics (e.g., wet north and dry south) and/or time-transgressive patterns have occurred that bear resemblance to historical patterns. A prominent example is within the expanded envelope of the ‘Late Holocene Dry Period’ proposed here. The Late Holocene Dry Period also provides one prominent example, of many, that addresses the fourth research question that numerous instances of non-analogue drought conditions are shown here to surpass those of the past 2000 years in severity and duration.
The Emerald Lake paleohydrologic record, located at the boundary of the three major sub-regions of the intermountain west—the Great Basin, Upper Colorado River basin, and the Colorado Plateau—brings clearer focus to the range of precipitation patterns and associated atmospheric transitions that can be anticipated to affect regional water supply in the future. There remain numerous western mountain ranges incorporating limestone substrates with small landslide-affected (or -formed) lakes in alpine settings that have yet to be fully investigated (e.g., Shapley et al., Reference Shapley, Finney and Krueger2021). This study also provides a framework for future investigations of the paleoclimatic signals embedded in their lithology and carbonate isotope geochemistry.
Acknowledgments
The USGS ScienceBase data release for this publication can be located at https://doi.org/10.5066/P9CZFVNJ. This research is supported by the U.S. Geological Survey Climate Research and Development Program. We thank Andrea Brunelle and Jesse Morris, who provided logistical support and field assistance that made this research possible. David Dettman at the University of Arizona and Million Hailemichael at Idaho State University provided carbonate and water isotope data; Core D AMS radiocarbon ages were provided by Jack Reed at the USGS Radiocarbon Laboratory and Chad Wolack at the Institute for Arctic Antarctic and Alpine Research (INSTAAR) at the University of Colorado Boulder. Alisa Mast at the USGS Colorado Water Science Center provided water chemistry data. We appreciate reviews by Marith Reheis and Paul Henne and two anonymous journal reviewers for their constructive suggestions that served to significantly improve the manuscript. Any use of trade, firm, or product names is for descriptive purposes only and does not imply endorsement by the U.S. Government.
Supplementary Material
The Supplementary Material for this article can be found at https://doi.org/10.1017/qua.2022.42.


 Open access