


Attention-deficit hyperactivity disorder (ADHD) is a neurodevelopmental disorder characterised by inattention and abnormal hyperactivity and impulsivity, affecting nearly 6% of children.Reference Moffitt, Houts, Asherson, Belsky, Corcoran and Hammerle1 Autism spectrum disorder (ASD) is another highly prevalent neurodevelopmental disorder characterised by difficulties in social communication and social interaction.Reference Lai, Lombardo and Baron-Cohen2 ADHD and ASD are often comorbid,Reference Simonoff, Pickles, Charman, Chandler, Loucas and Baird3, Reference Park, Hong, Lee and Park4 with about 30% of patients with ASD having comorbid ADHD characterised by age-inappropriate inattention, impulsiveness and hyperactivity. Neuroimaging studies have shown that both disorders are associated with abnormal resting-state functional brain connectivity.Reference Lynch, Uddin, Supekar, Khouzam, Phillips and Menon5–Reference Cerliani, Mennes, Thomas, Di Martino, Thioux and Keysers12 For instance, studies have suggested that compared with typical development, (a) children with ADHD showed disrupted functional connectivity patterns in brain regions involved in attention and sensory processingReference Kyeong, Kim and Kim7, Reference Francx, Oldehinkel, Oosterlaan, Heslenfeld, Hartman and Hoekstra8 and (b) children with ASD displayed increased resting-state functional connectivity in the posterior cingulate cortex and salience network, and the strength of functional connectivity was linked to severity of social interaction deficits.Reference Lynch, Uddin, Supekar, Khouzam, Phillips and Menon5, Reference Supekar, Uddin, Khouzam, Phillips, Gaillard and Kenworthy9, Reference Cerliani, Mennes, Thomas, Di Martino, Thioux and Keysers12 These studies have significantly enhanced the neurophysiological understanding of ADHD and ASD. Nevertheless, the mechanisms underlying the comorbidity and distinction between the two disorders remain unclear.
In this study, taking advantage of the Autism Brain Imaging Data Exchange (ABIDE) and ADHD200 data-set (http://fcon_1000.projects.nitrc.org/indi/adhd200/), we investigated shared and distinct functional connectivity patterns in a relatively large sample of boys (7- to 15-year-olds) with ADHD, ASD and typical development matched by age, gender and IQ. For better functional alignment across participants, the FreeSurfer image analysis suite was applied to generate a cortical surface for each participant.Reference Smith, Vidaurre, Beckmann, Glasser, Jenkinson and Miller13 We hypothesised that (a) children with ASD and ADHD would be associated with altered functional connectivity compared with children with typical development, and the altered patterns may be associated with symptoms of ASD and ADHD; and (b) machine learning techniques could be used to identify distinct and common functional connectivity features for both ASD and ADHD.
Method
Participants
We used an independent sample of individuals with ASD and individuals with typical development from ABIDE and individuals with ADHD from the ADHD200 data-set (http://fcon_1000.projects.nitrc.org/indi/adhd200/). The inclusion criteria were as follows: (a) full-scale IQ (F-IQ) scores >80; (b) aged between 7 and 15 years to minimise potential developmental effects;Reference Dickstein, Pescosolido, Reidy, Galvan, Kim and Seymour14 (c) scanned in a 3T magnetic resonance imaging (MRI) scanner to increase between-site reliability;Reference Friedman, Stern, Brown, Mathalon, Turner and Glover15 (d) right-handed; (e) diagnosis of ASD based on DSM-IV-TR16 and assessed with the Autism Diagnostic Observation Schedule,Reference Lord, Rutter, DiLavore, Risi, Gotham and Bishop17 the Autism Diagnostic Interview–Revised (ADI-R),Reference Lord, Rutter and Le Couteur18 or both; (f) children with ASD do not have comorbid ADHD and children with ADHD do not have comorbid ASD based on the data-set; (g) diagnosis of ADHD based on DSM-IV-TR without Axis I disorders. Individuals with ASD completed the Social Responsiveness Scale (SRS), a 65-item rating measure that quantifies severity of ASD.Reference Constantino, Davis, Todd, Schindler, Gross and Brophy19 In total, 294 participants fitted the above criteria and were included in the present study.
In total, 55 children with ASD (64%), 61 children with ADHD (73%) and all children with typical development were psychotropic medication-naive. Among children with ADHD, 44 met criteria for combined type ADHD, 3 met criteria for hyperactive/impulsive type ADHD and 36 met criteria for predominantly inattentive type ADHD. Each site was required to confirm that their local Institutional Review Board or ethics committee had approved both the initial data collection and sharing the data-sets. Details of site-specific protocols, informed consent, and ethical approval at the time of the scan for each data-set can be found at http://fcon_1000.projects.nitrc.org.
Data preprocessing
Anatomical image data were processed using FreeSurfer, version 5.3.0 software package (http://surfer.nmr.mgh.harvard.edu/).Reference Fischl, Sereno, Tootell and Dale20 To increase anatomical validation across individuals with ADHD, ASD, and typical development, FreeSurfer was used for segmentation of subcortical structures and automatic tessellation of the cortical surface because cortical surface variability is considerably improved by segmentation. The preprocessing of anatomical data was as follows: (a) motion correction and non-uniformity correction, (b) automatic Talairach transformation, (c) intensity normalisation, (d) skull strip and segmentation of the subcortical white matter and grey matter, (e) tessellation of the white matter and grey matter, (f) surface smoothing and inflation, (g) topology correction and (h) parcellation. Automated segmentation and parcellation results were reviewed for quality and corrected by two trained experts (M.J. and W.S.) as necessary.
Resting-state functional MRI (fMRI) data-sets were processed with the CONN functional connectivity toolbox (http://www.nitrc.org/projects/conn).Reference Whitfield-Gabrieli and Nieto-Castanon21 Preprocessing involved (a) realignment to the mean image, (b) removal of volumes with a mean intensity >1.5% of the mean global signal or 0.5 mm/repetition rate framewise displacement to reduce the effect of head movement, (d) CompCor correction to reduce physiological and other noise artefacts,Reference Muschelli, Nebel, Caffo, Barber, Pekar and Mostofsky22 (e) entering segmented cerebrospinal fluid and white matter as confounding regressors at the participant-level in FreeSurfer, and (f) band-pass filtering of the functional image (0.01–0.08 Hz).
Regions of interest (ROIs) and connectivity analysis
We used 162 ROIs adopted from the Desikan–Killiany parcellation atlas in FreeSurferReference Desikan, Ségonne, Fischl, Quinn, Dickerson and Blacker23 (supplementary Table 1 and supplementary Fig. 1 available at https://doi.org/10.1192/bjp.2018.248). Mean time series were obtained for each participant by averaging the fMRI time series over all voxels in each of the 162 ROIs. Functional connectivity was estimated based on these regional mean time series by calculating the pairwise Pearson correlation coefficient between all possible (162 × 161/2 = 13 041) ROI pairs. A symmetric connectivity matrix was constructed to represent these connections. Correlation coefficients were Fisher z-transformed to increase normality for statistical analyses.
Classification analysis: discriminating typical development, ASD and ADHD
To investigate diagnostic features between ADHD and ASD, a feature-selection approach combining a univariate t-test and multivariate support vector machine-recursive feature elimination (SVM-RFE) was performed.Reference Guyon, Weston, Barnhill and Vapnik24 To avoid the risk of overfitting, all analyses were performed using ten-fold cross-validation.Reference Tu, Zhang, Tan, Peng, Hung and Moayedi25
In the first step, we analysed group-level differences of features between groups. Significant differences for each pair of ROIs were assessed using a mass univariate two sample t-test with a threshold of P<0.001 and false discovery rate (FDR) correction. Features showing significant difference were retained for the remaining analyses. Our logic was that these features would be the most likely to contribute to the discrimination between groups.
In the second step, we used SVM-RFE to select the features with the most discriminative power for the classifier itself. SVM-RFE was used to train the classification model and obtain weights for each feature. The features were ranked according to the absolute values of weights, and the lowest ranking feature was discarded. Then the classification model was trained using the new feature set (i.e. without the discarded feature). This procedure was repeatedly performed until the feature set was empty. We conducted a full backward elimination procedure to further select the features with the highest classification accuracy. Since we used a ten-fold cross-validation strategy to estimate the performance of the classifiers and feature ranking and each iteration was based on a slightly different data-set, the selected feature sets differed slightly from iteration to iteration.
To determine the most discriminative features, a consensus discrimination map that aggregated features selected in all cross-validation iterations was used. Regional weight, which represents the contribution of each feature for discriminating different groups, was denoted by the number of ROI occurrences in the consensus discrimination map.Reference Zeng, Shen, Liu, Wang, Li and Fang26 The discriminative power of each feature was denoted by the average of its classification weights across all iterations. We conducted linear regression analyses of group-level differences to select features based on SVM-RFE and core symptom severity in ASD (total SRS scores), adjusting for data-collection site, F-IQ and age using SPSS. Regression analyses were corrected for multiple comparisons using FDR correction (P < 0.05).
Features with the most discriminative power were fed to an SVM with a linear kernel, which was implemented using LIBSVM. The classification (ASD versus typical development; ADHD versus typical development; ADHD versus ASD) was also based on ten-fold cross-validation, and the performance of the classifier was evaluated by accuracy, sensitivity and specificity. Non-parametric permutation tests (1000 times) were used to estimate the statistical significance of the observed classification accuracy. We randomly permuted the class labels of the data prior to training. Cross-validation was then performed on the permuted data-set and the procedure was repeated 1000 times. If a classifier trained on real class labels had an accuracy exceeding the 95% confidence interval generated from the accuracies of the classifiers trained on randomly relabelled class labels, this classifier was considered to be well-performing.
Results
Demographic and clinical characteristics
In total, 294 participants (86 boys with ASD, 83 boys with ADHD and 125 boys with typical development) were included in the study. There were no significant differences between the three groups for F-IQ (P = 0.51) and age (P = 0.27). Demographic and clinical characteristics for all participants included in the analyses are presented in Table 1. There was a significant difference between ASD and typical development groups for SRS total scores (P<0.0001).
Table 1 Demographic and clinical characteristics
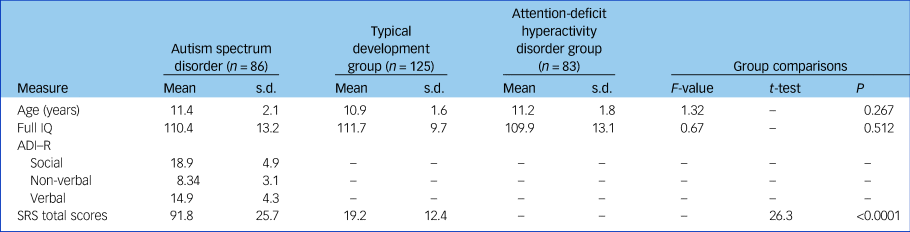
ADI-R, Autism Diagnostic Interview–Revised; SRS, Social Responsiveness Scale.
Diagnostic features of ROI-to-ROI functional connectivity analysis
Comparison of the typical development and ASD groups showed 72 ROI-to-ROI increased connectivities in the ASD group compared with the typical development group (Fig. 1). The ASD group showed increased connectivity in brain areas associated with the limbic, visual, default mode, somatomotor, dorsal attention, frontoparietal and ventral attention networks. The typical development group only showed nine ROI-to-ROI increased connectivities in brain areas associated with the visual, default mode, dorsal attention, frontoparietal and ventral attention networks compared with the ASD group. The classification accuracy of discriminating typical development from ASD was 76.3% (P < 0.001; Table 2).
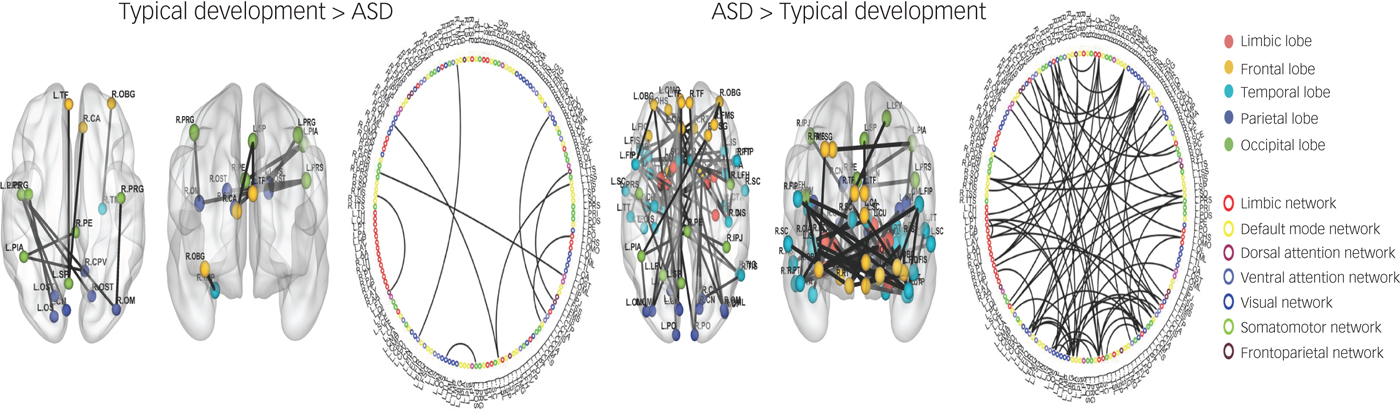
Fig. 1 Region of interest (ROI)-to-ROI functional connectivity analysis between typical development and autism spectrum disorder (ASD).
Table 2 Results of machine learning analysis
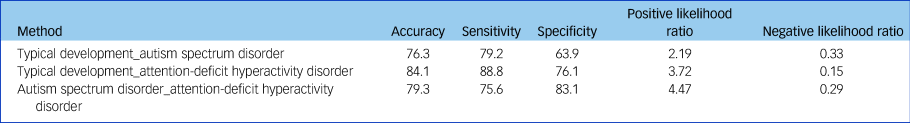
Comparison of the typical development and ADHD groups showed eight ROI-to-ROI increased connectivities in the ADHD group compared with the typical development group (Fig. 2). Specifically, the ADHD group showed increased connectivity in brain areas associated with the limbic, ventral attention, visual and default mode networks. In addition, the typical development group showed two ROI-to-ROI increased connectivities in brain areas associated with the default mode and visual networks compared with the ADHD group. The classification accuracy of discriminating typical development from ADHD was 84.1% (P < 0.001; Table 2).
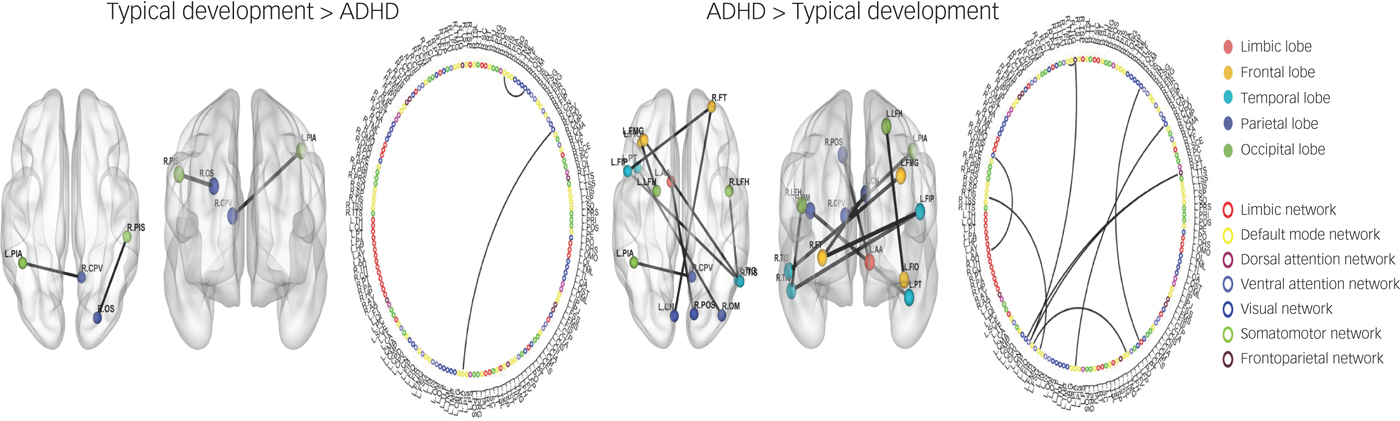
Fig. 2 Region of interest (ROI)-to-ROI functional connectivity analysis between typical development and attention-deficit hyperactivity disorder (ADHD).
Comparison of the ASD and ADHD groups showed nine ROI-to-ROI increased connectivities in the ADHD group compared with the ASD group (supplementary Fig. 2). Specifically, the ADHD group showed increased functional connectivity between brain regions associated with the limbic, visual, default mode, somatomotor, dorsal attention, frontoparietal and ventral attention networks. In addition, we found that the ASD group showed increased functional connectivity in the left middle occipital sulcus and right precentral sulcus associated with the somatomotor and dorsal attention networks compared with the ADHD group. The classification accuracy of discriminating ADHD from ASD was 79.3% (P < 0.001; Table 2).
Association between functional connectivity and core symptom severity
Regression analysis showed a positive association between increased connectivity in the ASD group compared with the typical development group and SRS scores, specifically (a) with the right insula and post transverse collateral sulcus functional connectivity (P = 0.0004, P = 0.01 FDR corrected; r = 0.376) and (b) with the right orbital gyrus and right horizontal ramus of the lateral sulcus functional connectivity (P = 0.0076, P = 0.025 FDR corrected; r = 0.309) (supplementary Fig. 3 and supplementary Table 2).
Discussion
Main findings
In this study, we investigated shared and distinct patterns of functional dysconnectivity in boys with ASD and ADHD. We found that (a) children with ASD showed increased functional connectivity compared with children with typical development, and children with ADHD showed increased functional connectivity compared with children with ASD and children with typical development; and (b) machine learning approaches can discriminate ASD and ADHD with accuracies of: 76.3% (ASD from typical development), 84.1% (ADHD from typical development) and 79.3% (ADHD from ASD). Our results may deepen our understanding of the neurophysiological mechanisms underlying the comorbidity and distinction between ADHD and ASD.
Comparison with findings from other studies
Our findings of increased functional connectivity patterns within the limbic regions and the somatomotor network in ASD compared with typical development are consistent with previous studies.Reference Cerliani, Mennes, Thomas, Di Martino, Thioux and Keysers12 For instance, Cerliani and colleagues found increased functional connectivity in the limbic area and sensory-motor area in male patients with ASD.Reference Cerliani, Mennes, Thomas, Di Martino, Thioux and Keysers12 Likewise, the DSM-5 manual also includes abnormal responses to sensory stimulation as a diagnostic criterion of ASD. Our results suggest that increased functional connectivity in the limbic and sensory-motor areas might reflect this abnormal response. The finding of increased functional connectivity patterns in children with ADHD compared with typical development is also consistent with previous studies on ADHD.Reference Di Martino, Zuo, Kelly, Grzadzinski, Mennes and Schvarcz6 Studies have suggested that the default network and limbic area are associated with regulation of attention,Reference Leech and Sharp27 self-cognitionReference Buckner, Andrews-Hanna and Schacter28 and external cognition.Reference Leech, Kamourieh, Beckmann and Sharp29 We thus speculate that increased functional connectivity may underlie impairments in ‘sharing attention with other people,’ which is a core symptom of ADHD.
We also found increased functional connectivity in the frontal lobe, temporal lobe, occipital lobe, parietal lobes, frontoparietal network and ventral attention network in the ADHD group compared with the typical development group. Rubia et al found that temporal lobe and parietal lobe dysfunction in boys with ADHD during an attention allocation task was associated with symptoms of ADHD.Reference Rubia, Smith, Brammer and Taylor30 We believe that abnormal functional connectivity in the temporal lobe and parietal lobe might disrupt or delay maturation of the regulation of attention in ADHD.
Nonetheless, our findings are inconsistent with other studies indicating that ADHD is related to decreased functional connectivity in the posterior cingulate cortexReference Kyeong, Kim and Kim7 and increased functional connectivity within frontal regions of the executive control networkReference Francx, Oldehinkel, Oosterlaan, Heslenfeld, Hartman and Hoekstra8 as compared with typical development. These conflicting findings may be the result of inconsistent methodologies or variability in the ADHD sample population. For instance, Kyeong et al Reference Kyeong, Kim and Kim7 used graph theory analysis to estimate degree centrality in stratifying ADHD subgroups with mild symptom ADHD and severe symptom ADHD. Francx et al Reference Francx, Oldehinkel, Oosterlaan, Heslenfeld, Hartman and Hoekstra8 used independent component analysis to detect components or networks in persistent ADHD subgroups and remittent ADHD subgroups. These discrepancies illustrate the importance of methodology and clinical subgroup differences during the interpretation of neuroimaging study findings.
Interpretation of our findings
We found that children with ASD showed increased functional connectivity between the left middle occipital sulcus and right precentral sulcus compared with ADHD. The occipital lobe and parietal lobe are involved in communication processing, including emotion perceptionReference Gschwind, Pourtois, Schwartz, Van De Ville and Vuilleumier31 and face discrimination,Reference Jonas, Rossion, Krieg, Koessler, Colnat-Coulbois and Vespignani32 as well as the pathophysiology of autism.Reference Jung, Tu, Lang, Ortiz, Park and Jorgenson33 A previous study indicated that ASD involves a different cognitive process during social interactions.Reference Hubbard, Mcnealy, Scott-Van Zeeland, Callan, Bookheimer and Dapretto34 We speculate that this may be because of the increased functional connectivity between the occipital and parietal lobes compared with ADHD and typical development. These results may provide an explanation for the altered communication processing at the neural level in individuals with ASD.
Our machine-learning algorithms confirmed common classification features between ASD and ADHD in the limbic, ventral attention, visual and default mode networks. This finding is consistent with previous studies that found abnormal functional connectivity in these networks in both ASD and ADHD.Reference Lynch, Uddin, Supekar, Khouzam, Phillips and Menon5, Reference Di Martino, Zuo, Kelly, Grzadzinski, Mennes and Schvarcz6, Reference Di Martino, Kelly, Grzadzinski, Zuo, Mennes and Mairena35 Recent studies indicate that ADHD may be associated with difficulties in social interaction.Reference Hoekzema, Carmona, Ramos-Quiroga, Richarte Fernández, Bosch and Soliva36 Symptoms of ADHD (e.g. attention deficits, impulse control and hyperactivity) are also frequently observed in ASD, demonstrating that the two disorders share some common manifestations. Taken together, the common classification features between ASD and ADHD may reflect shared neural mechanisms and clinical manifestations in the two disorders.
Translational neuroimaging studies have provided a basis for identifying neurophysiological features of ASD and showed potential clinical utility.Reference Di Martino, Kelly, Grzadzinski, Zuo, Mennes and Mairena35 Specifically, advanced machine learning techniques have been introduced to extract meaningful features from neuroimaging data and subsequently make an objective diagnosis for ASD. Anderson and colleagues used univariate t-tests to exclude irrelevant functional connectivities and achieved an accuracy of 79%.Reference Anderson, Douglas, Kerr, Haynes, Yuille and Xie37 Nielsen et al used a leave-one-out classifier with a general linear model on the multisite ABIDE data-set and obtained accuracies of up to 60% for different sites.Reference Nielsen, Zielinski, Fletcher, Alexander, Lange and Bigler38
More recently, Yahata and his colleagues developed a machine learning algorithm combining L 1-regularised sparse canonical correlation analysis and sparse logistic regression for selecting a subset of functional connectivities to obtain a classification accuracy of around 85% in a Japanese data-set, but generalisation for independent cohorts using two independent validation cohorts obtained from the ABIDE data-set showed lower accuracy (75%).Reference Yahata, Morimoto, Hashimoto, Lisi, Shibata and Kawakubo39 In the present study, we combined univariate t-tests and multivariate SVM-RFE to identify the most discriminative features between ASD, ADHD and typical development using seven independent cohorts and obtained accuracies of 76.3% between typical development and ASD, 84.1% between typical development and ADHD, and 79.3% between ASD and ADHD. Our results demonstrated that a classifier developed using surface-based functional connectivity also showed high classification for ASD and ADHD across other independent cohorts.
We found that the increased functional connectivity in the right insula and right orbital cortex was associated with SRS scores. Functional and structural imaging studies of ASD have identified abnormalities in the insula, explaining the emotion dysregulation and social avoidance symptoms of ASD.Reference Mazefsky, Herrington, Siegel, Scarpa, Maddox and Scahill40, Reference Kosaka, Omori, Munesue, Ishitobi, Matsumura and Takahashi41 The orbital cortex, a critical brain region in social cognition, has been associated with high levels of autistic traits.Reference Mayer42 Taken together, these results suggest that atypical connectivity in the insula and orbital cortex are related to emotion dysregulation and social cognition.
Limitations
There are several limitations in this study. First, our analyses were performed on boys with ASD who did not have comorbid ADHD and boys with ADHD who did not have comorbid ASD based on the data-set. Yet, we did not have ADHD symptom scores for participants with ASD or ASD scores for participants with ADHD. We thus cannot exclude the possibility that the disorders were comorbid. Further research including both ASD and ADHD symptom scores is needed. Second, this study only included boys with typical development, ASD and ADHD; thus, the results may not be generalisable to girls. Future studies including both boys and girls with ASD and ADHD are needed.
Implications
In summary, we found that boys with ASD are associated with increased functional connectivity in the limbic area, while boys with ADHD are associated with increased functional connectivity in the frontal and temporal areas. Machine learning-derived classification methods hold the potential to uncover neuroimaging biomarkers for ASD and ADHD.
Supplementary material
Supplementary material is available online at https://doi.org/10.1192/bjp.2018.248.
Funding
Minyoung Jung is supported by 18K13106 from the Japanese Ministry of Education, Culture, Sports, Science, and Technology (MEXT) of Japan, Jian Kong is supported by R01 AT008563, R21AT008707, and R33AT009310 from NIH/NCCIH.


eLetters
No eLetters have been published for this article.