


This case reports on a pair of adolescent male monozygotic twins who presented to a tertiary hospital with metabolic syndrome and obesity, seeking weight loss treatment. Upon 16 weeks of a weight-loss intervention, metabolic syndrome resolved in one twin only, and this was accompanied with differential changes in the peripheral blood mononuclear cell (PBMC) transcriptome between twins. Ethical approval for this study was provided by Monash Health HREC (RES-17-0000-519X), and the family provided additional written consent for this case study publication.
Case Presentation
Medical records indicated that the twins were born at 34 weeks’ gestation using forceps to assist delivery. Zygosity was self-reported as monozygotic. Twin A had a birth weight of 2.005 kg and Twin B had a birth weight of 2.44 kg. Twin A had an uncomplicated neonatal course, but Twin B required CPAP for respiratory distress syndrome and polycythemia requiring a partial exchange transfusion. They were raised together by their genetic parents in the same home environment. Twin A has a history of learning disabilities and visual impairment in the context of macrocephaly and white matter changes of antenatal origin on brain MRI. By the age of 10, both twins had developed significant obesity with concurrent metabolic dysregulation that met the criteria for metabolic syndrome (MetS) as defined in adolescents by Zimmet et al. (Reference Zimmet, Alberti, Kaufman, Tajima, Silink, Arslanian, Wong, Bennett, Shaw and Caprio2007). Both twins presented for treatment at a tertiary teaching hospital at age 14, advanced in puberty. They underwent a 16-week dietary protocol for weight loss in a dietitian-led weight management program. Measurements were taken at baseline and week 16 after an overnight fast. Both twins achieved >10% body mass loss (Twin A: 12% reduction; Twin B: 13% reduction) with concurrent reductions in waist circumference, fat mass and blood pressure (Table 1). There were no notable differences between twins in the reduction of fat mass (kg) or waist-to-height ratio (WtHR), but Twin B experienced a slightly greater reduction in waist circumference (A: −13.7 cm vs. B: −16.4 cm), and grew in stature slightly more than his brother (A: +0.55 cm vs. B: +1.8 cm) during the 16 week intervention. The reduction in fasting triglycerides was greater in Twin A (−2.0mmol/L) than Twin B (−0.5mmol/L), such that Twin A (but not Twin B) no longer met the adolescent criteria for MetS.
Table 1. Anthropometric, body composition and biochemistry outcomes at baseline and week 16.

Note: BMI, body mass index; WtHR, waist to height ratio; CRP, C reactive protein. *Fat mass and fat free mass as measured by dual X-ray absorptiometry. **Metabolic syndrome defined using the criteria set out by the International Diabetes Federation (Zimmet et al., Reference Zimmet, Alberti, Kaufman, Tajima, Silink, Arslanian, Wong, Bennett, Shaw and Caprio2007).
RNA Extraction and Analysis
RNA was isolated from PBMCs collected at baseline and after weight loss at week 16. RNA integrity (RIN) was measured using an Agilent 2100 Bioanalyzer (Agilent, Santa Clara, California, United States). Samples were advanced to RNA sequencing (Illumina NextSeq 500, Illumina, San Diego, California, United States) with a RIN above 8; all twin samples had a RIN above 8. For immune cell subsets within PBMC samples, enrichment scores were calculated using SPEC (version 0.5.0; Bolen et al., Reference Bolen, Uduman and Kleinstein2011) whereby the twins’ gene expression signatures were correlated with the default package gene signatures for each cell type (T cells, myeloid cells, monocytes and lymphocytes).
Fastq files of raw sequence reads were aligned to the human genome (GRCh38) using the STAR aligner and read counts generated using the featureCounts package as part of the ‘RNAsiq’ pipeline (Tsyganov et al., Reference Tsyganov, Perry, Archer and Powell2018) developed by the Monash Bioinformatics Platform (Monash University, Melbourne, Australia). Only genes with a mean count >10 were included in the downstream analysis. Due to the case study design, genes were determined as differentially expressed with a log-fold change (logFC) <-0.26 or >0.26 (Muñoz García et al., Reference Muñoz García, Eijssen, Kutmon, Sarathy, Cengo, Hewison, Evelo, Lenz and Coort2019), a cut-off used in nutrition research to define differentially expressed genes, since standard statistical testing could not be performed in this case (N = 2). To explore the biological processes that differentially expressed genes were associated with, these genes were mapped to gene ontologies (GO) using the ClueGO app via the CluePedia plugin for Cytoscape (version 3.8.2). GO terms were considered enriched with an adjusted p value < .05 after Bonferroni stepped-down correction for false discovery rate (Dunn, Reference Dunn1961), and at least five included genes were mapped to the GO term. Terms were grouped into networks using a connectivity kappa threshold of 0.4.
Results
Peripheral Blood Mononuclear Cell Subpopulations
SPEC analysis demonstrated that cell populations were comparable between twins with both twin gene signatures most strongly correlated with the T-cell gene signature both before and after the intervention (Table 2).
Table 2. Correlation matrix between twin gene expression signatures and SPEC PBMC subset gene signatures before and after the weight loss intervention.

Baseline Gene Expression
A mean count of >10 was detected in a total of 15,071 genes across all samples. At baseline, 4369 genes (28%) were found to have a logFC of either >0.26 (1179 genes) or <−0.26 (3189 genes) between twins. Gene ontology analysis found 64 GO terms associated with genes that were upregulated, and 222 GO terms associated with genes that were downregulated in Twin A compared to Twin B at baseline.
Gene Expression Following the Intervention
Following the intervention, 13,281 genes were differentially expressed in Twin A compared to baseline, and in Twin B, 9604 genes were differentially expressed. Very few genes (12.2% and 1.2%) were differentially expressed in the same direction following weight loss in the twins (Figure 1). In contrast, following weight loss, 6463 transcripts (48.1%) were downregulated in Twin A and upregulated in Twin B (Figure 2). Due to the large number, only those genes with a logFC <-0.58 or >0.58 following weight loss were used in the downstream analysis (2280 genes), which represents a more conservative cut-off commonly used in medical research (Rapaport et al., Reference Rapaport, Khanin, Liang, Pirun, Krek, Zumbo, Mason, Socci and Betel2013). Ninety GO terms were enriched (adjusted p value < .05) between the 2280 genes inversely regulated following weight loss. Nine of the 10 top enriched terms were related to immune cell activation, with four of these terms relating specifically to neutrophil functions (Table 3). Nine of the top ten terms were also enriched between genes that were upregulated in Twin A at baseline compared to Twin B.

Fig. 1. Venn diagrams of gene expression changes following a 16-week lifestyle intervention in a set of monozygotic twins. A. Transcripts that were downregulated following the intervention (12.2% overlap between twins). B. Transcripts that were upregulated following the intervention (1.2% overlap between twins). C. Transcripts that were upregulated following the intervention in Twin A and downregulated in Twin B (8.9% overlap between twins). D. Transcripts that were downregulated following the intervention in Twin A and upregulated following the intervention in Twin B (48.1% overlap between twins).
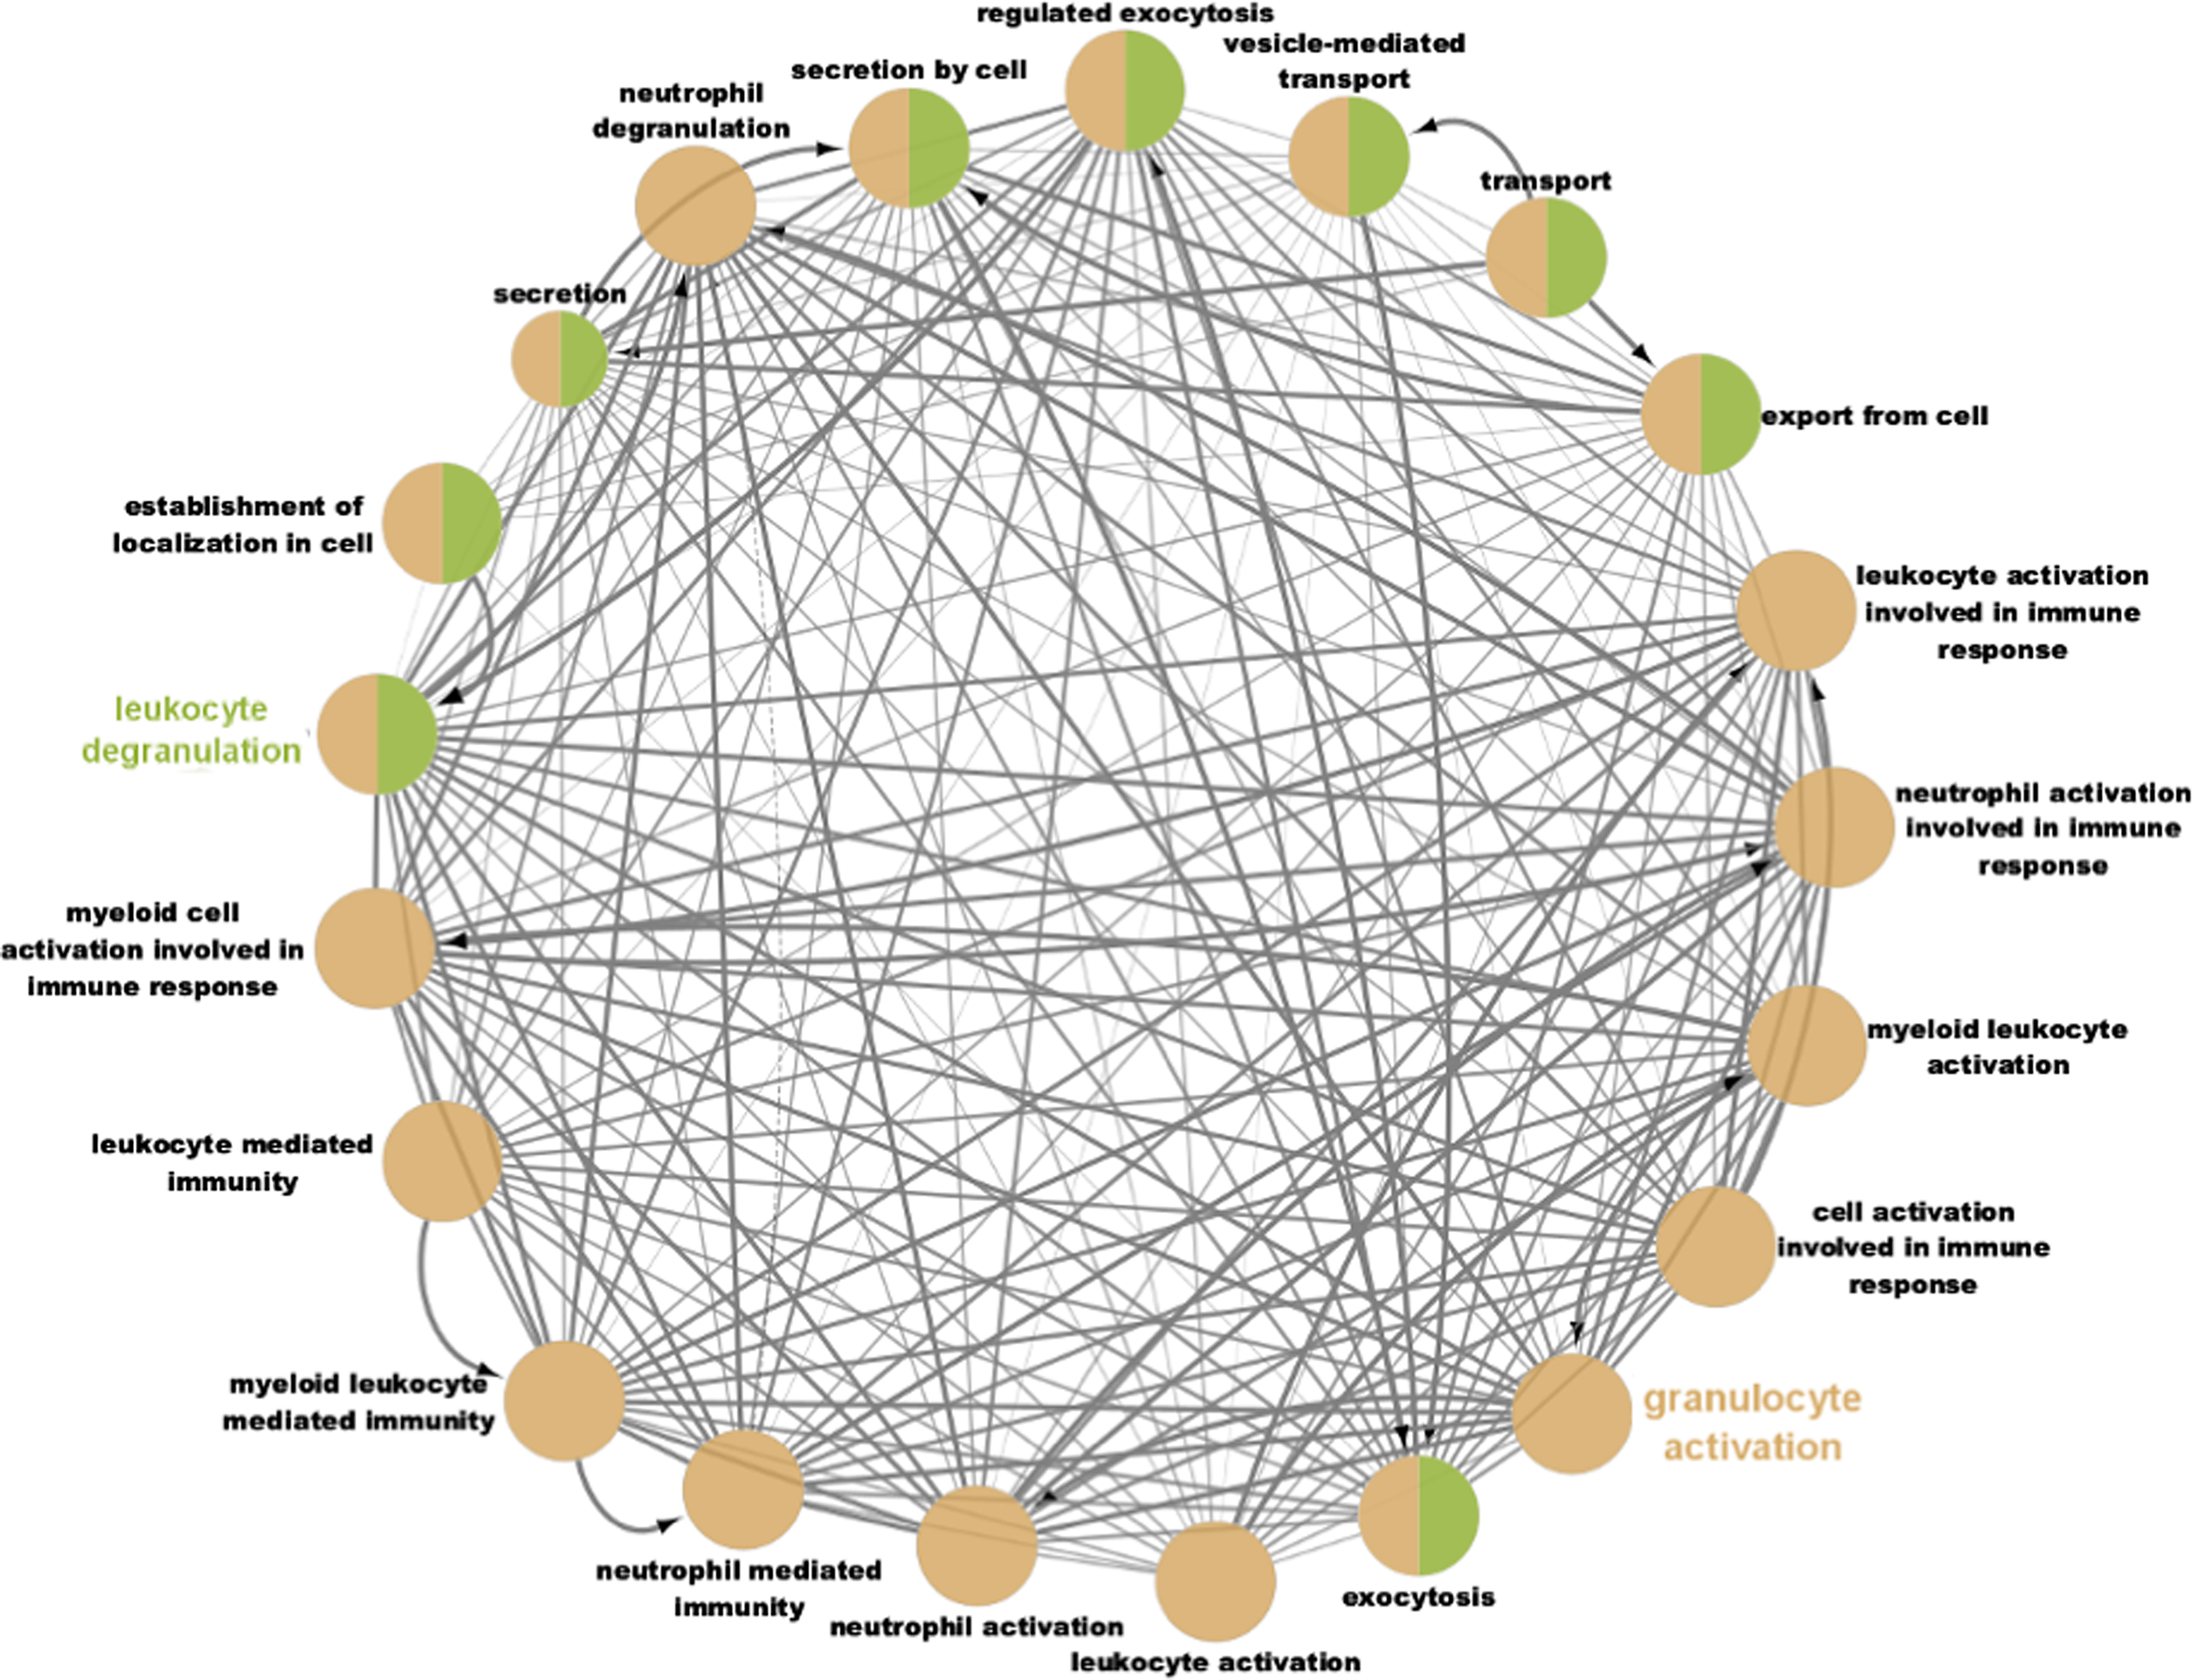
Fig. 2. Network connectivity map of gene ontology terms enriched for the genes downregulated in twin A and upregulated in twin B following weight loss (log-fold change > −.58 or < −0.58, 2280 genes). Terms were considered enriched with an adjusted FDR < .05 and grouped into networks with a connectivity kappa threshold of 0.4. These networks were broadly characterised as leukocyte degranulation and granulocyte activation.
Table 3. The 10 most enriched gene ontology terms for the genes oppositely regulated between the twins following weight loss. All top ten terms were significantly enriched after Bonferroni adjusted for multiple testing (adj.p value < .01).

The majority of the top terms related to the broader ontologies of ‘granulocyte activation’ and ‘leukocyte degranulation’; the interaction network between these terms is shown in Figure 1. These terms were also enriched between genes with lower expression levels in Twin B than Twin A at baseline.
Discussion
This case report presents the differential changes in the PBMC transcriptome between adolescent monozygotic male twins before and following a 16-week weight loss intervention. Both twins achieved a >10% body weight reduction (Twin A: 12%, Twin B: 14%) after a 16-week dietitian-led weight management program, with the majority comprised of fat mass loss. This level of body composition change would be anticipated to result in optimal metabolic changes and resolve MetS (Look AHEAD Research Group, 2014). However, while changes in some markers of MetS improved in Twin B, and indeed showed larger reductions than Twin A, the criteria for MetS were still met in Twin B following the intervention due to continued elevated triglycerides. These shifts in metabolic markers following weight loss were accompanied by differences in gene expression changes, with nearly half (48%) of the genes that decreased in expression in Twin A, increased in Twin B. Genes related to immune function (leukocyte degranulation and granulocyte activation) were upregulated at baseline but downregulated following the intervention in Twin A compared to Twin B, suggesting Twin A had a greater capacity for change in expression of genes related to immune functions than Twin B. The baseline discordance observed in gene expression related to immune function between the twins may underlie the differences in gene expression following the intervention.
Differences in whole blood and PBMC gene expression levels have been previously identified between people with metabolically healthy and metabolically unhealthy obesity, particularly for genes related to lipid metabolism and some immune functions (TRIM11, ADAMTSL2; Plaza-Florido et al., Reference Plaza-Florido, Altmäe, Esteban, Cadenas-Sanchez, Aguilera, Einarsdottir, Katayama, Krjutškov, Kere, Zaldivar, Radom-Aizik and Ortega2021), suggesting that differences in gene expression may underlie different metabolic phenotypes and transcriptomic differences could, in this case, precede differences in classical pro-inflammatory markers. A recent review into differences in PBMC gene expression between responders to a weight-loss intervention demonstrated consistent changes in toll-like receptor signalling between high responders to a weight loss intervention (Day et al., Reference Day, Dordevic, Truby, Southey, Coort and Murgia2021), which belongs to the same broader gene ontological process of ‘activation of immune response’ as leukocyte and neutrophil activation, which were observed in the current study (Figure 2). A study into PBMC gene expression of African American males with obesity observed that neutrophil specific genes were upregulated in obesity, suggesting a role of neutrophils in obesity and its treatment (Xu et al., Reference Xu, Su, Wang, Barnes, De Miguel, Ownby, Pollock, Snieder, Chen and Wang2015).
Both genomewide association studies and twin studies have been used to characterize the heritability of body weight and body shape (Locke et al., Reference Locke, Kahali, Berndt, Justice, Pers, Day, Powell, Vedantam, Buchkovich and Yang2015; Min et al., Reference Min, Chiu and Wang2013; Thorleifsson et al., Reference Thorleifsson, Walters, Gudbjartsson, Steinthorsdottir, Sulem, Helgadottir, Styrkarsdottir, Gretarsdottir, Thorlacius, Jonsdottir, Jonsdottir, Olafsdottir, Olafsdottir, Jonsson, Jonsson, Borch-Johnsen, Hansen, Andersen, Jorgensen, Lauritzen, Aben, Verbeek, Roeleveld, Kampman, Yanek, Becker, Tryggvadottir, Rafnar, Becker, Gulcher, Kiemeney, Pedersen, Kong, Thorsteinsdottir and Stefansson2009). Genomewide association studies have suggested that less than 1−3% of BMI variation can be explained by differences in genotype (Locke et al., Reference Locke, Kahali, Berndt, Justice, Pers, Day, Powell, Vedantam, Buchkovich and Yang2015; Thorleifsson et al., Reference Thorleifsson, Walters, Gudbjartsson, Steinthorsdottir, Sulem, Helgadottir, Styrkarsdottir, Gretarsdottir, Thorlacius, Jonsdottir, Jonsdottir, Olafsdottir, Olafsdottir, Jonsson, Jonsson, Borch-Johnsen, Hansen, Andersen, Jorgensen, Lauritzen, Aben, Verbeek, Roeleveld, Kampman, Yanek, Becker, Tryggvadottir, Rafnar, Becker, Gulcher, Kiemeney, Pedersen, Kong, Thorsteinsdottir and Stefansson2009). Despite this, a systematic review of twin studies has suggested moderate heritability of weight at birth, which increases to a maximum heritability of 79% at around 20 years of age before waning again into adulthood (Min et al., Reference Min, Chiu and Wang2013); suggesting that the genetic influence of body weight wanes with increasing age and that environmental impacts may accumulate over time before reaching a critical threshold to impact phenotype. Interestingly, this places the twins reported here close to their peak age of body weight heritability. Indeed, body weight at baseline and follow-up were similar between twins, despite differences in gene expression responses at both baseline and in response to the dietary intervention. The birth weights of the twins described here were borderline discordant (17.8% difference), compared to the criteria (≥18% difference) for assessing birthweight-associated adverse outcomes (Breathnach et al., Reference Breathnach, McAuliffe, Geary, Daly, Higgins, Dornan, Morrison, Burke, Higgins and Dicker2011). In several large cohort and twin studies, low birth weight has been associated with obesity and lower lean mass in adulthood, independent of genetic and maternal influences (Hertfordshire Study, 2005; Labayen et al., Reference Labayen, Moreno, Ruiz, González-Gross, Wärnberg, Breidenassel, Ortega, Marcos, Bueno and Group2008; Loos et al., Reference Loos, Beunen, Fagard, Derom and Vlietinck2001). Low birth weight is an indicator of in-utero stress, which can be caused by multiple factors, including undernutrition (Mayer & Joseph, Reference Mayer and Joseph2013) and multiple pregnancy (Sankilampi et al., Reference Sankilampi, Hannila, Saari, Gissler and Dunkel2013). Multiple pregnancies may be more susceptible to fetal undernutrition due to competition for maternal and placental supply, and this competition may lead to differences in birth weight that can impact upon body weight and adiposity later in life (Fox et al., Reference Fox, Rebarber, Klauser, Roman and Saltzman2011). In the twins described here, the twin with a lower birth weight presented at baseline with a higher BMI, waist circumference, and percentage body fat, although there were no differences in the criteria for MetS.
The contrasting response of the PBMC transcriptome following similar weight loss in these twins is particularly puzzling given the similarity in phenotypic response. Body composition changes were similar between twins and most metabolic outcomes were similarly decreased, as one would anticipate with substantial body weight loss. Interestingly, despite very similar reductions in weight and body fat, it was the twin with the higher birth weight who still met the criteria for MetS following the 16-week intervention, due to minimal change in fasting triglycerides from baseline. Hyperlipidaemia can lead to activation of circulating leukocytes via increased fatty acid uptake, and mouse models have shown that MetS increases circulating immune cell counts (Alipour et al., Reference Alipour, Oostrom, Izraeljan, Verseyden, Collins, Frayn, Plokker, Elte and Cabezas2008; Kanneganti & Dixit, Reference Kanneganti and Dixit2012) and may explain the persistent upregulation of immune-related genes in Twin B compared to Twin A. Excessive fatty acid uptake in monocytes leads to the establishment of foam cells, an initial step in the formation of atherosclerotic plaques (Angelovich et al., Reference Angelovich, Hearps and Jaworowski2015; Swirski et al., Reference Swirski, Libby, Aikawa, Alcaide, Luscinskas, Weissleder and Pittet2007). We were interested to see whether CRP was reflective of the discordance in fasting triglycerides; however, this was not observed in this case study. CRP is a nonspecific marker of both acute and chronic inflammation, susceptible to multiple environmental factors that influence the immune system (Sproston & Ashworth, Reference Sproston and Ashworth2018). It is therefore probable that other factors, not measured in the current study as such acute illness history, could have impacted measured CRP.
The divergent gene expression changes following weight loss between these twins may be a precursor to more traditional markers of pro-inflammation and may underlie the mechanism behind the MetS only resolving in one twin. Central obesity and the immune system are closely linked (Hotamisligil, Reference Hotamisligil2006). Many metabolic derangements arising from obesity, such as insulin resistance and atherosclerosis, involve inappropriate activation of the immune system. Evidence from both mouse and human studies suggests that an upregulation of immune signalling genes and stress markers on the surface of adipocytes precedes macrophage recruitment to the adipose tissue microenvironment (Bai & Sun, Reference Bai and Sun2015), and the adhesion of monocytes to the endothelium in the initial stages of atherosclerosis development (Wu et al., Reference Wu, Chang, Chang and Chen2020). Increased expression of the toll-like receptor and the cluster of differentiation (CD) families of genes precedes fibrosis development in mouse adipose tissue following a high fat diet (Kwon et al., Reference Kwon, Shin, Cho, Jung, Kim, Park, Park, Yun, McGregor, Park and Choi2012). Additionally, individuals with hyperlipidemia have a higher number of primed PBMCs in circulation compared to healthy controls, which precedes adhesion to the endothelium during atherosclerotic plaque formation (Mazor et al., Reference Mazor, Shurtz-Swirski, Farah, Kristal, Shapiro, Dorlechter, Cohen-Mazor, Meilin, Tamara and Sela2008). This suggests that changes in the expression of immune signalling genes may precede metabolic dysfunction and the presence of classical pro-inflammatory markers.
The epigenome is a key regulator of gene expression, inhibiting access of transcriptional machinery to DNA. It has been proposed that differences in the epigenome arise due to epigenetic drift over the life course, and as such the culmination of environmental impacts on gene expression and regulation can result in different phenotypic outcomes (Poulsen et al., Reference Poulsen, Esteller, Vaag and Fraga2007). One of the first studies to record this evaluated the epigenomes of 3-year-old and 50-year-old twins and found that epigenetic differences between twin pairs were greater in the older twins (Fraga et al., Reference Fraga, Ballestar, Paz, Ropero, Setien, Ballestar, Heine-Suñer, Cigudosa, Urioste and Benitez2005). These differences were stable over the short term (12 weeks), suggesting long-term exposure is necessary to promote changes in the epigenome (Fraga et al., Reference Fraga, Ballestar, Paz, Ropero, Setien, Ballestar, Heine-Suñer, Cigudosa, Urioste and Benitez2005). Obesity may also promote epigenetic divergence (Barrès & Zierath, Reference Barrès and Zierath2016) and has been suggested to accelerate biological aging measured through DNA methylation signatures (de Toro-Martín et al., Reference de Toro-Martín, Guénard, Tchernof, Hould, Lebel, Julien, Marceau and Vohl2019; Nevalainen et al., Reference Nevalainen, Kananen, Marttila, Jylhävä, Mononen, Kähönen, Raitakari, Hervonen, Jylhä, Lehtimäki and Hurme2017) and telomere length (Buxton et al., Reference Buxton, Walters, Visvikis-Siest, Meyre, Froguel and Blakemore2011). Differences in the epigenome between twins may lead to differences in gene expression and ultimately phenotypic outcomes, suggesting that the divergent PBMC transcriptomic response observed in the current study may be through DNA methylation differences accumulated through different environmental exposures, which would be an interesting avenue for future exploration.
Monozygotic twins provide a unique model to examine the variability in gene expression following weight loss. This case provides some evidence that changes in the transcriptome may precede the development of more traditional biomarkers of chronic inflammation in susceptible individuals. Further exploration of the transcriptome with weight trajectory over the life course is needed to determine whether expression of genes relating to immune function or alterations in the transcriptome can precede traditional metabolic disease risk factors and to determine what age or developmental stage would be optimal to intervene.
Data availability
Data is available upon reasonable request to the corresponding author.
Acknowledgments
The authors would like to thank the twins and their parents for their involvement and consent to publish this case study.
Financial support
This work has been supported by the National Health and Medical Research Council (grant number 1128317).
Conflict of interest
None.
Ethical standards
The authors assert that all procedures contributing to this work comply with the ethical standards of the relevant national and institutional committees on human experimentation and with the Helsinki Declaration of 1975, as revised in 2008.


 Open access