


Introduction
The need to increase food production to meet future world demands is a major concern for scientists and practitioners. Alongside agronomic constraints, climate change has increased the uncertainty around our ability to meet this goal (van Dijk et al. Reference van Dijk, Morley, Rau and Saghai2021). Although there has been a strong emphasis on studying factors such as drought and temperature stress on crop productivity, less attention has been paid to changes in biotic dynamics (e.g., pest–crop interactions) in agroecosystems. This is particularly important for changes in weed growth responses to the environment. Weeds are the most important biotic cause of crop yield loss worldwide (Oerke Reference Oerke2006); nevertheless, little is known about the type and magnitude of evolutionary adaptations that may be occurring in these organisms in response to agronomic and environmental factors (Baucom and Holt Reference Baucom and Holt2009). Although the idea that weeds can rapidly evolve to adapt to changes in their environments is common in the literature, apart from herbicide resistance, this has not been demonstrated for complex life-history traits.
Historically, herbicide resistance has been the most widely studied evolutionary trait in weeds, partially because herbicides are the greatest cause of mortality for weeds but also due to the ease of testing changes in sensitivity to herbicides. Since the introduction of Bt and glyphosate-resistant crops, resistance management has been an important consideration in those crop systems (Duke Reference Duke2018; Gould Reference Gould1988). Unlike insect pests and pathogens, most weeds only complete a single life cycle per year. Therefore, evolutionary processes likely occur at a slower pace in weeds and take more time to be detected. Furthermore, the study of evolutionary adaptations of complex life-history traits (e.g., competitive ability, growth rate, flowering time, seed production) has been scarcer, because these traits are difficult to measure due to high variation resulting from control by multiple genes, genetic epistasis, and genotype by environment interactions. For this reason, any study of life history traits requires considerable time and large sample sizes. However, adaptive changes beyond herbicide resistance might be key to explaining why most weeds of economic importance have not been driven to local extinction despite experiencing frequent and intense mortality events over extended periods of time (Jordan and Jannink Reference Jordan and Jannink1997; Kuester et al. Reference Kuester, Wilson, Chang and Baucom2016).
The study of rapid evolutionary changes in plants has been based on research using phylogenetic characterization of populations that are presumably in different evolutionary stages based on geographic distribution and ecosystem dynamics or by monitoring changes of a lineage over time (Branderburger et al. Reference Branderburger, Maslen, Sherwin and Moles2022; Franks et al. Reference Franks, Sim and Weis2007; Grant and Grant Reference Grant and Grant2006). Neither of those approaches allows direct assessment of changes in competitive adaptations under the same temporal, spatial, and environmental conditions. More recently, researchers have germinated seeds that were produced and stored in different years to generate plants of a given species with genetic structures from different times, so they can be compared under the same environmental conditions (Franks et al. Reference Franks, Sim and Weis2007). These “resurrection” studies have documented decadal changes in life-history traits such as flowering time, self-pollination rates, growth responses to increased atmospheric CO2, and competitive ability (Cheptou et al. Reference Cheptou, Imbert and Thomann2022; Franks et al. Reference Franks, Sim and Weis2007; Ziska Reference Ziska2017; Ziska et al. Reference Ziska, Morris and Goins2004). The main limitation of those studies is that they only compare two populations or genotypes (i.e., a single old vs. a single modern genotype). Although phenotypic and genotypic changes have been demonstrated using only two time points, this approach does not enable assessment of whether the changes resulted from a major and sudden alteration of the genetic diversity of the species (e.g., genetic bottlenecks) or from progressive changes in genome architecture (e.g., natural selection, genetic drift) (Lande Reference Lande1976) in which, over time, new and more fit genotypes can outcompete and displace the older ones, as proposed by Darwin (Reference Darwin1859).
We hypothesized that weed success in intensively disturbed agroecosystems is not only the result of weed shifts due to herbicide use patterns and cultural practices (e.g., conservation tillage) but also of changes in growth and competitive ability and that these changes can occur progressively in just a few years.
Materials and Methods
Seed Collection and Increase
Seeds of giant foxtail (Setaria faberi Herrm.) were collected annually from the same field under a corn (Zea mays L.)–soybean [Glycine max (L.) Merr.] rotation in Story County, IA (42.005°N, 93.675°W) between 1983 and 2017. Seed collection was done as part of the maintenance of the weed germplasm bank of the Iowa State University Weed Science Program. Each year, at least 20 plants were randomly selected from a 250-m radius (same area every year), and seeds were collected, pooled, and stored in a seed storage vault. In 2018 and 2019, seeds were germinated and grown in 4-L pots in a growing mixture of peat moss and vermiculite (Fafard® 4P Mix, Sun Gro Horticulture, Agawam, MA, USA), and after plants reached maturity, their seeds were harvested for later use in the experiments. This seed increase was done to produce seeds of all year-lines under the same conditions and reduce maternal factors.
Growth and Morphology Characterization
Due to limitations of low seed numbers, many years did not have samples that would properly represent the genetic diversity of the population. Therefore, only the 1983, 1991, 2009, 2013, and 2015 year-lines were used for this study. Seeds germinated from pooled seed from each year-line, and twenty seedlings were randomly selected and grown in an outdoor, pot, common garden experiment. Pots (8-L) with single plants were placed 2 m apart, arranged in a completely randomized design. Pots were watered with a drip irrigation system to ensure conditions close to field capacity during the experiment. Plants were grown to physiological maturity, when they were harvested and measured to determine plant height, width, number of leaves, number of panicles, panicle length, number of tillers, primary leaf length and width, leaf area, plant dry weight, and seed production. The phenotyping study was done twice in the summers of 2019 and 2020.
Data analysis was performed using SAS software v. 9.4 (SAS Institute, Cary, NC, USA). After confirmation of normality and homoscedasticity assumptions, measurements were analyzed with ANOVA, considering year-line as main effect and replication and experimental run as random effects. Means separation was conducted using Tukey’s honestly significant difference with a significance level of α = 0.05.
Herbicide Sensitivity Study
Year-lines 1983, 1991, 1996, 1998, 2009, and 2017 were selected for the next studies because they had 20 to 81 individual lines (i.e., mother plants) that produced enough seed to characterize the genetic diversity of the lines more adequately and to conduct herbicide sensitivity and competitive ability studies and genotyping. Plants were grown in trays with 5 cm by 5 cm cells in a growing mixture of peat moss and vermiculite under greenhouse conditions: a 14-h photoperiod in which supplemental lighting was provided to extend the daylength to 14 h and temperature maintained at 30/26 C day/night. Each year-line had one plant per cell.
The experiment was arranged as a completely randomized design with 12 single-plant replications per treatment. The experiment was conducted twice. Herbicides used for this study included glyphosate (Roundup PowerMax® II, Bayer CropScience, Research Triangle Park, NC, USA) and imazamox (Raptor®, BASF, Research Triangle Park, NC, USA). Each herbicide had six doses, including a nontreated control (Table 1). Herbicides were applied using a CO2-pressurized backpack sprayer with four XR 11002 nozzles (TeeJet® Technologies, Spraying Systems, Springfield, IL, USA) calibrated to deliver 187 L ha−1 at 206 kPa. Herbicides were sprayed at the 4- to 6-leaf stage, which is the optimum growth stage to maximize control based on herbicide label recommendations. Plants were rated for injury every 5 d by visual estimation on a scale from 0% (no injury) to 100% (plant death). Plants were harvested at the flowering stage, and biomass was collected for fresh and dried samples.
Table 1. Herbicide doses applied to Setaria faberi in the dose–response experiment.
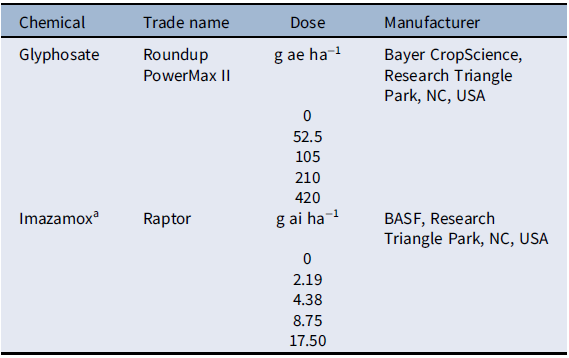
a Imazamox was applied with nonionic surfactant (NIS; Helena AgriEnterprises, Collierville, TN, USA) at 0.25% vol/vol, as recommended by the manufacturer.
Data analysis was performed using SAS software v. 9.4 (SAS Institute). Herbicide injury and biomass were analyzed with ANOVA using PROC GLIMMIX. Each herbicide was analyzed separately. Herbicide dose, year-line, and their interaction were considered fixed effects, while replication and experimental run were considered random. Means separation was conducted using Tukey’s honestly significant difference with a significance level of α = 0.05. Data were subject to linear and nonlinear regression analysis using SigmaPlot software v. 14.0 (Systat Software, San Jose, CA, USA) with herbicide dose as the independent variable and plant injury and biomass reduction as the dependent variables.
Replacement Series Study
A replacement series study was conducted under greenhouse conditions to assess the competitive ability of each year-line. Plants were grown in 4-L pots filled with a peat moss and vermiculite mix substrate (Fafard® 4P Mix, Sun Gro Horticulture) and watered twice daily and fertilized with a nutrient solution to meet all macro- and micronutrient requirements. Greenhouse conditions consisted of a 14-h photoperiod in which supplemental lighting was provided to extend the daylength to 14 h and temperature maintained at 30/26 C day/night. The experiment was arranged as a randomized complete block design with 25 treatments (5 year-lines and 5 competitive ratios) and 3 replications and was conducted twice. There were four plants per pot using five ratios: 4:0, 3:1, 2:2, 1:3, 0:4 (oldest vs. newer year-line). Due to limited seed availability, a full pairwise comparison of all year-lines was not possible. For this reason, we evaluated how each year-line performed against 1983, the oldest year-line; doing this with multiple newer year-lines allowed us to identify trends in changes in competitive ability over time, if present.
Once seedlings emerged, counts were made to ensure correct ratios. Two plants from each pot were tagged and measured throughout the growing period. These plants were then measured weekly until harvest for height, width, leaf number, index of relative chlorophyll content (SPAD 502 Plus Chlorophyll Meter, Spectrum Technologies, Aurora, IL, USA), and tiller number. In pots with treatments of 4:0 or 0:4, two of the same year plants were chosen, and in pots with treatments including 1:3, 2:2, or 3:1, the two plants chosen included one plant from the oldest year and one plant from the newer year. The two tagged plants were measured weekly for height, width, chlorophyll content, and tiller number. Plant harvest occurred when all lines had initiated flowering. This was done to avoid loss of biomass and leaf area due to senescence. At harvest, the plant height, width, leaf number, tiller number, index of relative chlorophyll content, leaf area, and biomass were collected from all four plants. Leaf area was measured using a leaf area meter (LI-3100, LI-COR Biosciences, Lincoln, NE, USA). Biomass was determined after drying plants at 60 C until constant weight. For simplification purposes, only the most representative and informative variables are presented here.
Data analysis was performed using SAS v. 9.4 (SAS Institute). Treatments were considered fixed effects, and block and experimental run were considered random effects in the analysis due to lack of interactions between the block and experimental run with the treatment effects (P > 0.05). Measurements taken throughout the growing period, including height, width, leaf number, tiller number, and index of relative chlorophyll content, were analyzed with repeated measures using PROC GLM, with days after planting as the repeated measure. Biomass and leaf area were analyzed with ANOVA using PROC GLIMMIX, and means separation was conducted using Tukey’s honestly significant difference with α = 0.05.
Genome-wide Association Study
To explore the genetic mechanisms and identify loci explaining the changes in competitive ability, we conducted a genome-wide association study (GWAS) (Risch and Merikangas Reference Risch and Merikangas1996) and evaluated whether there were changes in the frequency of single-nucleotide polymorphisms (SNPs) that were consistent with the increase in competitive ability of S. faberi during the studied period indicating selection. For the genotyping-by-sequencing (GBS) study, we collected fresh leaves from 173 individuals (∼30 individuals per year-line) of S. faberi grown under optimum temperatures in the greenhouse. Further, DNA was isolated from the fresh leaves with the Macherey-Nagel Plant II DNA extraction kit (Duren, Germany) as per the manufacturer’s protocol. DNA concentration was verified using the Quant-iT™ PicoGreen® dsDNA kit (Life Technologies, Grand Island, NY, USA). After confirmation of the DNA quality and integrity, the DNA samples were shipped to CD Genomics (Shirley, NY, USA) for GBS. Libraries were prepared as described in Elshire et al. (Reference Elshire, Glaubitz, Sun, Poland, Kawamoto, Buckler and Mitchell2011) with minimal modification; in short, 150 ng of DNA was digested using PstI and BfaI (New England Biolabs, Ipswich, MA, USA), after which bar-coded adapters amenable to Illumina sequencing were added by ligation with T4 ligase (New England Biolabs). The 96 adapter-ligated samples were pooled and amplified to provide library quantities adequate for sequencing, and adapter dimers were removed by SPRI bead purification. Quality and quantity of the finished libraries were assessed using the Agilent Bioanalyzer High Sensitivity Chip (Agilent Technologies, Santa Clara, CA, USA) and Qubit® dsDNA HS Assay Kit (Life Technologies), respectively. Libraries were sequenced targeting at least 300 million reads on a NovaSeq6000 (Illumina Inc., San Diego, CA, USA).
Raw reads were demultiplexed using fastq-multx (Aronesty Reference Aronesty2013). Further, Trim Galore (https://www.bioinformatics.babraham.ac.uk/projects/trim_galore) was used for adapter trimming and quality control for raw data of individual samples. The clean sequencing data were then used for further downstream processing. We used the DeNovoGBS module in NGSEP v. 4 software for individual read mapping and SNP mining (Parra-Salazar et al. Reference Parra-Salazar, Lozano-Arce, Reyes-Herrera and Duitama2022). The NGSEP v. 4 software analysis called a total of 526,550 SNPs. Further, for filtering the SNPs, we implemented the software vcftools (Danecek et al. Reference Danecek, Auton, Abecasis, Albers, Banks, DePristo, Handsaker, Lunter, Marth, Sherry, McVean and Durbin2011). The parameters for SNP filtering consisted of: (1) ≤30% missing data, (2) read coverage between 10X to 100X, (3) minor allele frequency (MAF) less than 0.01, and (4) multiple SNP alternatives for the same site. The filtering step reduced the number of SNPs to 65,433, and the contigs were then assigned to chromosome and SNP position based on homology with the green foxtail [Setaria viridis (L.) P. Beauv.] reference genome downloaded from Ensembl Plants (https://plants.ensembl.org/Setaria_viridis/Info/Index). We aligned the sequences to the S. viridis reference genome to call SNPs for the GWAS (Bennetzen et al. Reference Bennetzen, Schmutz, Wang, Percifield, Hawkins, Pontaroli, Estep, Feng and Vaughn2012), as no reference genome was available for S. faberi at the time of the study. After anchoring the contigs on the S. viridis genome, we performed a GWAS. We used GAPIT software (Lipka et al. Reference Lipka, Tian, Wang, Peiffer, Li, Bradbury, Gore, Buckler and Zhang2012) for the GWAS study, using the GLM model. After SNPs associated with changes in competitive ability were identified, we explored sequences 100 kbp up- and downstream from each SNP and used BLAST to identify putative genes in those regions.
Results and Discussion
To test our hypothesis, we collected seed annually from 1983 to 2017 of S. faberi, a weed species of economic importance in many row crops. Although the seed was stored under conditions intended to maintain viability (i.e., low temperature and relative humidity), when seed viability was tested in 2018 and 2019, most years had few or no viable seeds. Only year-lines from which there were enough plants to represent the genetic diversity of the population each year (i.e., 20 to 81 plants) were selected. Therefore, we chose a total of 8 year-lines across an expanse of 34 years, including before and after major changes in agroecosystems related to the introduction of acetolactate synthase–inhibiting herbicides and glyphosate-resistant crops. Those lines were allocated to each experiment based on seed availability.
Growth and Herbicide Sensitivity Characterization
We first evaluated the sensitivity of 6 year-lines to imazamox (acetolactate synthase inhibitor) and glyphosate (Figure 1). The dose to reduce growth 50% (GR50) ranged from 0.80 to 2.29 g ai ha−1 for imazamox and 50 to 142 g ae ha−1 for glyphosate. However, there was no clear trend over time, and in both cases, the GR50 was largely below the field use dose (44 to 78 g ai ha−1 and 420 to 840 g ae ha−1, respectively). These results suggested that any changes in S. faberi growth were not likely the result of herbicide-mediated selection. Next, we characterized the growth of individual plants (noncompetitive conditions) in a common garden experiment. Analysis of variance and Tukey’s honestly significant difference tests indicated that plant width (F (4, 202) = 4.16; P = 0.0029), leaf number (F (4, 202) = 2.46; P = 0.047), panicle number (F (4, 202) = 2.68; P = 0.033), biomass (F (4, 202) = 3.6; P = 0.0073), and seed number (F (4, 202) = 2.42; P = 0.05) were higher for plants from the newest year-line than those from the oldest; the rest of the studied years exhibited intermediate values (data not shown).
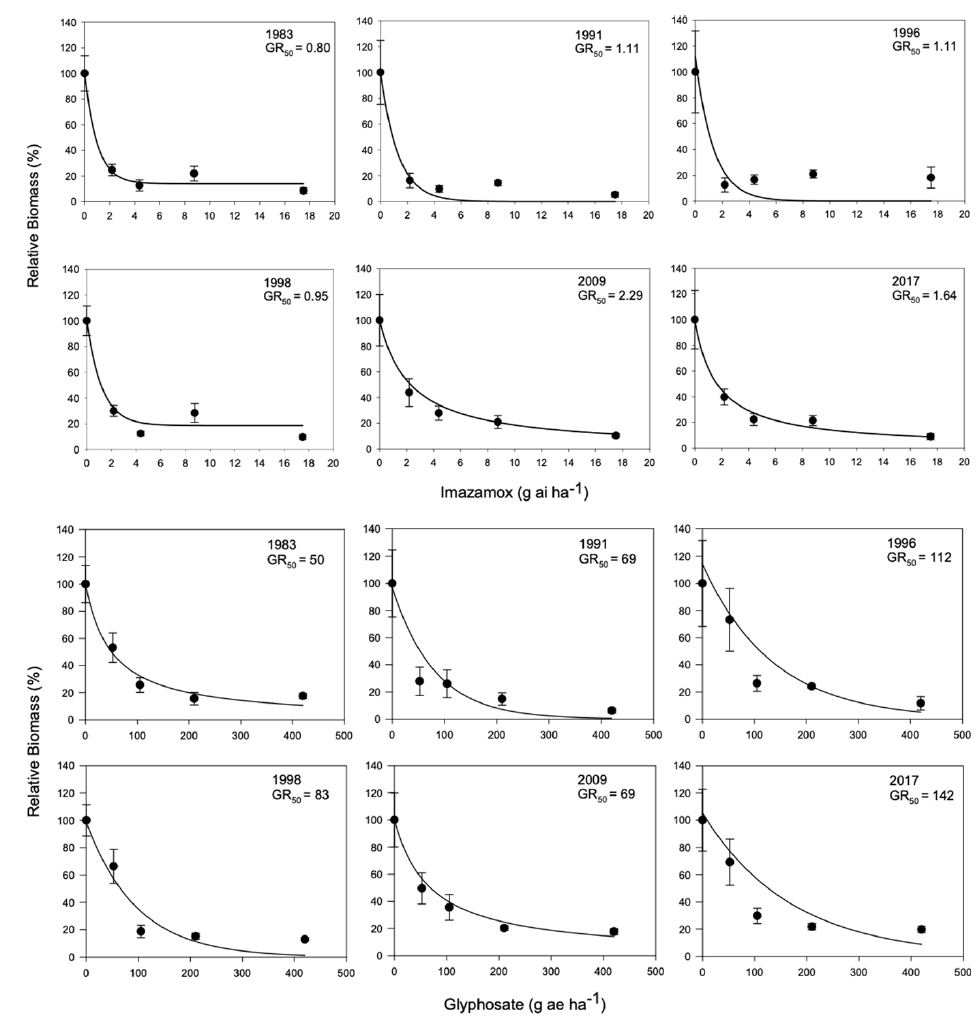
Figure 1. Biomass of Setaria faberi relative to the nontreated control for 6 year-lines in response to increasing doses of imazamox and glyphosate. The dose required to reduce growth 50% (GR50) is indicated for each year-line.
Competitive Ability
Because of these differences in growth, we hypothesized that more recent year-lines are more competitive than older ones and that competitive ability would increase progressively over time. Therefore, we conducted a replacement series experiment comparing the competitive ability of plants from 5 year-lines against the oldest line (i.e., 1983), which was used as the reference point to identify any evolutionary adaptation. Plants grown in monoculture exhibited the same biomass and total leaf area regardless of the year (Figure 2), but there were differences in height, with the three most recent year-lines being taller. Interestingly, differences in biomass detected in the experiment under noncompetitive interactions were not large enough to be maintained under competitive conditions. Despite the lack of differences in biomass production in monoculture, the presence of differences in plant height could give newer year-lines a competitive advantage in polycultures. We predicted that deviations in the polycultures from predicted relative biomass production under neutral competition would be the result of competitive responses and not constitutive morphological differences.
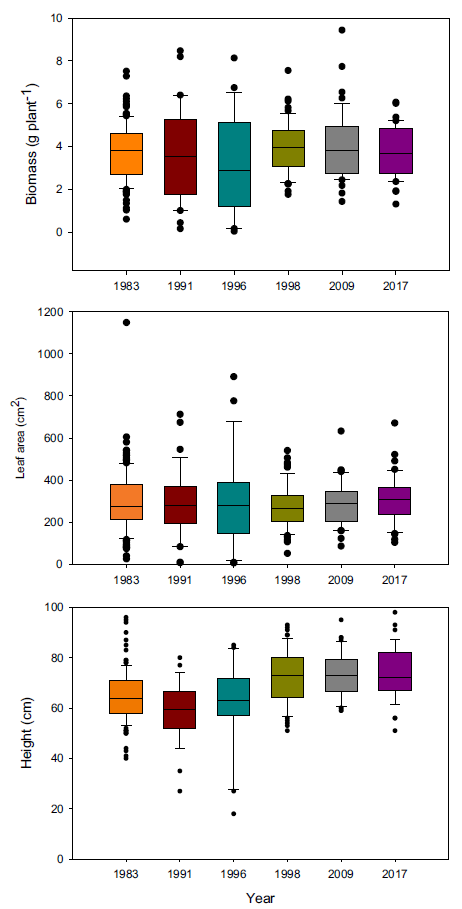
Figure 2. Plant biomass, total leaf area, and height of Setaria faberi from 6 year-lines grown in monoculture. No differences in growth potential were found among lines for biomass (F (5, 318) = 1.04; P = 0.39) and leaf area (F (5, 329) = 0.79; P = 0.56), but height differences were detected among year-lines (F (5, 308) = 12.5; P < 0.0001).
When plants were placed under 3:1, 2:2, and 1:3 ratios (1983:newer year-line) in polyculture, the relative competitive ability of S. faberi, measured as relative biomass accumulation, increased consistently over time in all cases (0.58% to 0.62% per year, P < 0.0001 to 0.018), confirming our hypothesis (Figure 3; Table 2). However, in contrast to our prediction, 1983 was not the line with the lowest competitive ability. In fact, 1983 was more competitive than 1991 and 1996, and from that point forward, competitiveness of year-lines increased until plants from 2017 were more competitive than those from 1983. The increase in competitive ability was mainly due to larger leaf area in more recent year-lines than in 1983 (0.60% to 0.82% per year, P < 0.0001 to 0.012). Although the differences among year-lines in monoculture were for height, not for total leaf area, this latter factor trended most similarly to biomass increase. These results indicate that individuals from a given year-line were able to modify their growth and produce larger leaf areas, limiting the growth of older year-lines. The decrease (from 1983 to 1991) and increase (from 1996 to 2017) in competitive ability indicate that this S. faberi population was possibly undergoing oscillating selection (Gibbs and Grant Reference Gibbs and Grant1987). Oscillating selection occurs when different selection forces or different levels of intensity of a given selection force act sequentially, resulting in positive and negative (i.e., opposite) changes in the competitive ability of the progeny of the plants under selection (Gibbs and Grant Reference Gibbs and Grant1987; Grant and Grant Reference Grant and Grant1995; Kellogg Reference Kellogg1975). Furthermore, these results provide evidence that not only can weeds evolve rapidly and vary their competitive ability, but they do so by a progressive process that might result in the continuous displacement of older genotypes.
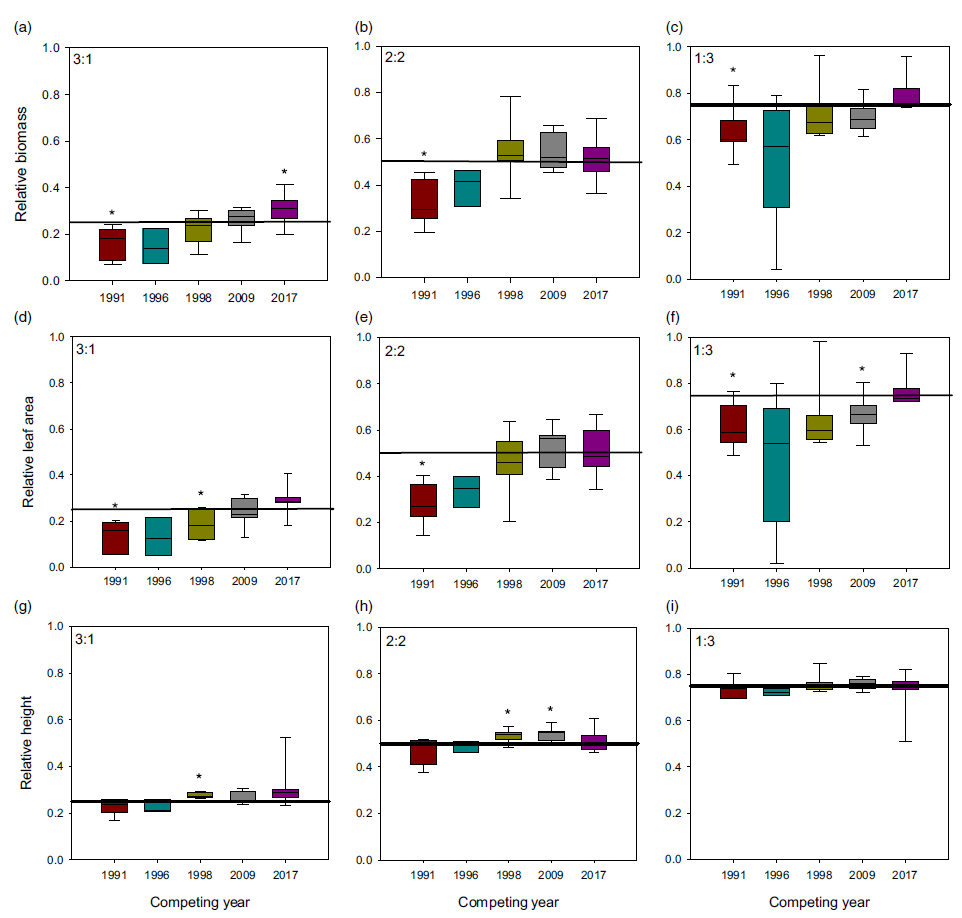
Figure 3. Relative biomass, total leaf area, and height of Setaria faberi from 5 year-lines, in competition with year-line 1983 in 3:1, 2:2, and 1:3 proportions (1983:newer year-line). The horizontal bar indicates the expected relative biomass under neutral competition. Values under the expected neutral competition indicate that plants from 1983 were more competitive than the respective alternative year-line, indicating uneven competitive ability between year-lines. Conversely, when the alternative year-line surpasses the neutral competition threshold, this indicates that it was more competitive than the 1983 year-line In all three competitive conditions, competitive ability increased over time. Asterisks indicate when a year-line was different from the predicted relative biomass based on neutral competition (P < 0.05).
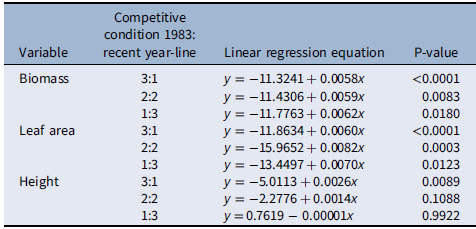
Table 2. Linear regression of relative changes in biomass, leaf area, and height (y) of Setaria faberi under different competitive conditions over time (x = year) as presented in Figure 3.
Identification of Loci Associated with Competitive Ability Evolution
Previous studies have taken advantage of population and quantitative genetics to detect evolutionary changes in life-history traits in weeds (Kuester et al. Reference Kuester, Wilson, Chang and Baucom2016; Leon et al. Reference Leon, Bassham and Owen2006; Leon and van der Laat Reference Leon and van der Laat2021), although genome mapping of the loci responsible for those changes has been lacking. The modifications in biomass and leaf area production under polyculture provided evidence that the differences in competitive ability were not just due to evolution of structural morphological traits (e.g., plant height), but instead a physiological mechanism, likely controlled genetically, evolved to respond to the presence of other plants. To characterize the evolutionary nature of those changes, we sequenced the genomes of 30 randomly selected individuals of each year-line and aligned the sequences to the S. viridis reference genome to call SNPs for the GWAS (Bennetzen et al. Reference Bennetzen, Schmutz, Wang, Percifield, Hawkins, Pontaroli, Estep, Feng and Vaughn2012), as no reference genome was available for S. faberi at the time of the study. Setaria faberi is an allotetraploid (n = 18) closely related to diploid S. viridis (n = 9), and both share an A genome. The second genome of S. faberi seems to be from a common ancestor to both species (Benabdelmouna et al. Reference Benabdelmouna, Abirached-Darmency and Darmency2001; Kellogg Reference Kellogg, Doust and Diao2017; Layton and Kellogg Reference Layton and Kellogg2014). Therefore, using S. viridis reference genome allowed us to better align the sequencing reads and generate more informative and reliable SNPs. A total of 65,443 SNPs were identified for which frequencies could be tracked across the 6 year-lines. Those SNPs provided an extensive coverage of the nine reference chromosomes. The average distance between SNPs was 6,045 bp. In our analysis, we found maximum SNPs in chromosome 5 (Table 3). The data were analyzed to identify SNPs that increased or decreased in frequency as competitive ability increased over time. Therefore, the directionality of the change was considered to be part of the selection criteria for SNP calling, making this process more rigorous than identifying SNPs based on comparisons of pairs of year-lines. The results confirmed that several SNPs were associated with changes in competitive ability under the three competitive conditions (i.e., 3:1, 2:2, and 1:3; Figure 4). In total, we found about 15 SNPs showing strong correlation with the phenotypic data. Importantly, chromosomes 3, 5, and 8 had SNPs that were consistently associated with competitive ability changes in both 3:1 and 1:3 conditions, strongly indicating that their locations are in close proximity to loci that were under directional selection during the last three decades.
Table 3. Chromosome-wise distribution of putative single-nucleotide polymorphisms (SNPs) in Setaria faberi based on the Setaria viridis reference genome.
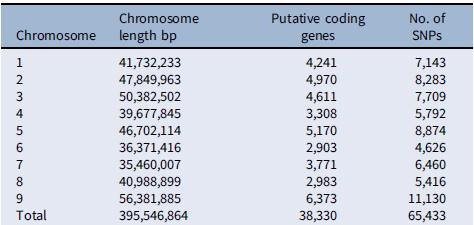
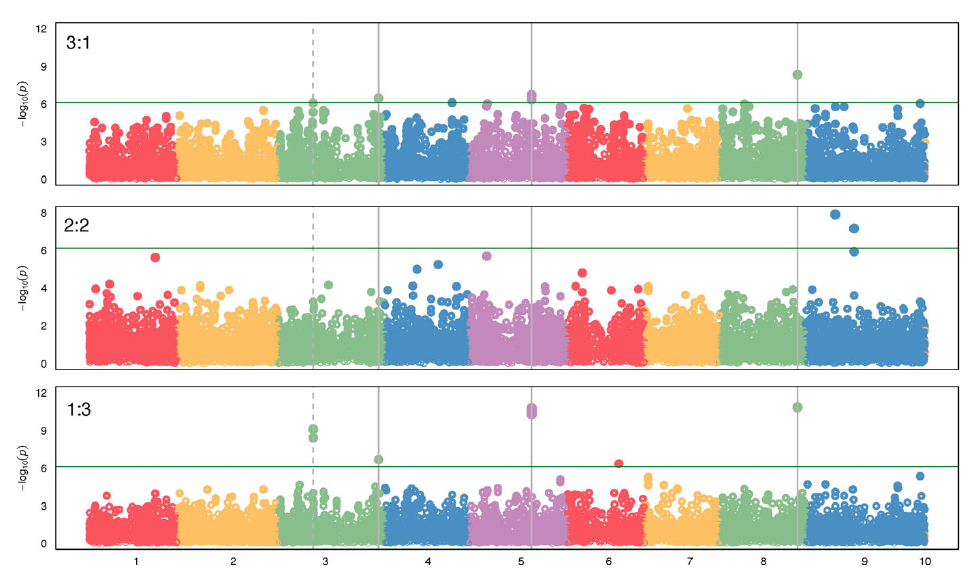
Figure 4. Genome-wide association study (GWAS) results indicating single-nucleotide polymorphisms (SNPs) associated with competitive ability in a Setaria faberi from year-lines 1991, 1996, 1998, 2009, and 2017 in competition with year-line 1983 in 3:1, 2:2, and 1:3 proportions (1983:newer year-line). The analysis was done using the Setaria viridis reference genome consisting of nine chromosomes (x axis). Only SNPs that changed over time in either of the three competitive conditions are shown. SNPs above the green horizontal bar were significant and were considered strongly associated with increase in competitive ability over time. Vertical, solid bars indicate SNPs that were significant under the extreme competitive conditions 3:1 and 1:3. The dashed line shows SNPs that were significant in the 1:3 condition and were at the limit of significance in the 3:1 condition. The horizontal line indicates the minimum level of significance for SNP association with competitive ability.
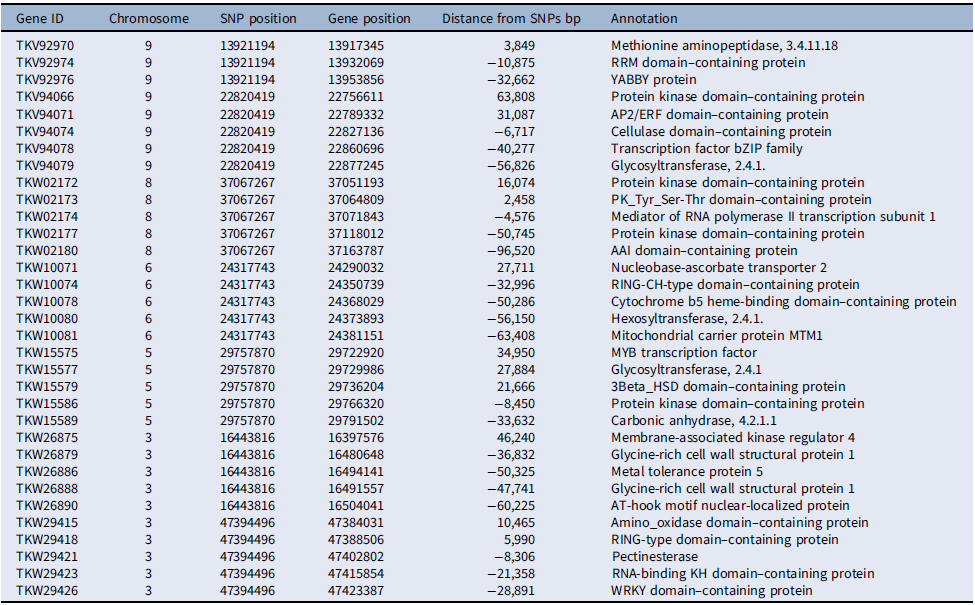
Several of the putative genes in the vicinity of the loci associated with competitive ability had domains frequently found in transcription factors, such as RRM, YABBY, AP2/ERF, and bZIP in chromosome 9, MYB in chromosome 5, and WRKY in chromosome 3 (Table 4). Additionally, several protein kinase domain–containing genes were associated with loci in chromosomes 5, 8, and 9. The involvement of putative transcription factors and protein kinases indicates that selection likely acted upon the genetic structure of signal-transduction pathways, presumably affecting competitive ability (Pierik et al. Reference Pierik, Mommer and Voesenek2013). Also, the detection of genes related to cell metabolism and growth, including genes coding for cellulases, pectin esterases, glycosyltransferases, and glycine-rich cell wall structural proteins, suggests that genetic determinants of cell growth responses are part of the evolutionary changes in competitive ability documented here, which agrees with the role of cell wall proteins in stress responses in plants (Ezquer et al. Reference Ezquer, Salameh, Colombo and Kalaitzis2020; Le Gall et al. Reference Le Gall, Phillipe, Domon, Gillet, Pelloux and Rayon2015).
Table 4. Chromosome-wise distribution of select putative genes associated with single-nucleotide polymorphisms (SNPs) under selection for competitive ability in Setaria faberi based on the Setaria viridis reference genome.
Historical Context
Individuals from 1991 were less competitive than those from 1983 (i.e., lower relative biomass than the neutral competition prediction), and it was after 1996 that competitive ability shifted and started increasing in the newer year-lines. The present study does not allow us to determine the cause of this shift. However, it is worth noting that it was in 1996 that glyphosate-resistant crops were introduced to the area where the studied S. faberi population was located (Duke Reference Duke2018). It is unlikely that the changes in competitive ability in this weed were the direct result of the increased use of glyphosate, especially considering that no major change in sensitivity to this herbicide was observed. Also, field commercial doses were high enough to ensure the same selection pressure in all year-lines. Therefore, we propose that the uniformity in the agricultural landscape resulting from the widespread adoption of glyphosate-resistant crops created conditions favoring the evolution of more competitive biotypes (Bravo et al. Reference Bravo, Leon, Ferrell, Mulvaney and Wood2017; Leon and van der Laat Reference Leon and van der Laat2021; Owen Reference Owen2008). Landscape fragmentation and diversity favor genetic diversity and dispersal-related traits in human-disturbed landscapes. Conversely, uniform, stable, less diverse landscapes tend to favor competitive ability (Cheptou et al. Reference Cheptou, Hargreaves, Bonte and Jacquemyn2017; Legrand et al. Reference Legrand, Cote, Fronhofer, Holt, Ronce, Schtickzelle, Travis and Clobert2017; Urquhart and Williams Reference Urquhart and Williams2021). In the present case, it is likely that the reduction in the use of integrated management practices decreased the diversity of factors driving the mortality of weeds, and this occurred at an unprecedented scale in the U.S. Midwest with the advent of glyphosate-resistant crops. Thus, competition between individuals surviving or avoiding glyphosate applications would become more important to maintain and increase reproductive output. The progressive changes in morphological traits due to competition for food has been robustly demonstrated in long-term studies such as those of Darwin’s finches (Gibbs and Grant Reference Gibbs and Grant1987; Grant and Grant Reference Grant and Grant2002, Reference Grant and Grant2006). The fact that weeds are at the same trophic level as crops makes competitive ability particularly important in agroecosystems, because niche differentiation via evolution can only occur if the weed adapts. The crop, due to human breeding and agronomic management, will not evolve to optimize its access to available resources, in contrast to plants experiencing coevolutionary processes in natural systems (Luescher and Jacquard Reference Luescher and Jacquard1991).
Evolution of Increased Competitive Ability
The findings of the present study provide a different perspective on the evolution of increased competitive ability (EICA) hypothesis (Blossey and Notzold Reference Blossey and Notzold1995), which has been used to explain the observation that invasive plant species tend to grow more and faster in alien environments than in their original environments. This hypothesis has been predominantly tested under the premise that those species do not encounter natural enemies in invaded areas. However, there have been contradictory results (Cripps et al. Reference Cripps, Hinz, McKenney, Price and Schwarzlander2009; Felker-Quinn et al. Reference Felker-Quinn, Schweitzer and Bailey2013; Siemann et al. Reference Siemann, DeWalt, Zou and Rogers2017; van Kleunen and Schmid Reference van Kleunen and Schmid2003), and researchers have proposed alternatively the evolution of reduced competitive ability (ERCA) hypothesis (Bossdorf et al. Reference Bossdorf, Prati, Auge and Schmid2004). Although S. faberi is a weed, and not an invasive species of natural systems per se, our results demonstrated that there can be evolutionary bidirectional changes in competitive ability within the same plant population (Gibbs and Grant Reference Gibbs and Grant1987; Grant and Grant Reference Grant and Grant2002), and those can occur, or at least be expressed, without the influence of phytophagous insects or pathogen infections. Therefore, invasive biology must consider the fact that evolution can occur by kin competitive relations (File et al. Reference File, Murphy and Dudley2012), and the natural enemy release effect might act independently from or in conjunction with this process to ultimately yield the commonly reported rapid evolution of competitive ability (Siemann et al. Reference Siemann, DeWalt, Zou and Rogers2017).
Caveats
It is possible that in the present study there were limitations in the identification of SNPs associated with competitive ability. Calling SNPs without having an assembled reference genome for S. faberi likely reduced the resolution of our analysis, so it is conceivable that there are other loci that were under selection, and we were not able to detect them, especially for the B genome. Even under these constraints, the level of significance of association of the SNPs identified across the studied years and the fact that they were consistently detected under different competitive conditions provide robust evidence that the detected loci were under directional selection. It is also important to recognize that studying a single population still leaves open the question of whether the results are unique to that population and the conditions under which it evolved or whether the phenomenon documented here might be more widespread within this and perhaps other species. Regardless of this limitation, the results clearly illustrate the potential for very rapid evolution of polygenic, complex traits that can indeed increase weediness and invasiveness. Another limitation of our study is that we did not have year-lines between 1983 and 1991, so it was not possible to describe how the decrease in competitive ability during this period occurred or could be explained. The simplest explanation is that selection pressure of processes other than intraspecific competitive ability were more important for the fitness of S. faberi during the 1980s than in the 1990s. However, we recognize that the present study is more informative for changes that occurred after 1991.
This is the first report of rapid directional evolution of competitive ability in a natural (nonexperimental) plant population determined by comparing multiple year-lines under the same environmental conditions. Our results help explain the contradictory results reported for the EICA hypothesis and seem to indicate that, given current trends, weeds might be evolving and becoming better competitors at a rate unknown until now. This should motivate researchers to pay more attention to how evolutionary processes in weeds and pests can modify biological interactions, ultimately making crop production in agroecosystems more difficult. Whether the shift in competitive ability in S. faberi is the result of homogenization of selection pressure is yet to be determined. However, having variable or oscillating selection might prevent the progressive increase in competitive ability (Gibbs and Grant Reference Gibbs and Grant1987; Schluter et al. Reference Schluter, Price and Rowe1991). This might be more likely to be achieved by diversification of crops and agronomic and ecological management, rather than by the current trend of relying on simple, more aggressive, but still uniform, control tools (Jordan and Jannink Reference Jordan and Jannink1997; Mortensen et al. Reference Mortensen, Egan, Maxwell, Ryan and Smith2012; Owen Reference Owen2008; Owen et al. Reference Owen, Beckie, Leeson, Norsworthy and Steckel2015).
Acknowledgments
This research was supported in part by U.S. Department of Agriculture grants NIFA 2017-6505-26807, CPPM Grant 2018-70006-28933, and Hatch Project NC-02653. The authors declare no conflict of interests.


 Open access