


Obesity is a significant risk factor for mortality and multiple morbidities including heart disease, certain cancers and type 2 diabetes(Reference Must, Spadano and Coakley1–Reference Campbell, Newton and Patel6). A lot of attention has been focused on the contributions of the food environment to the rapid rise in obesity. Numerous studies have investigated the role of access to healthy food outlets(Reference Caspi, Sorensen and Subramanian7), but interventions focused solely on creating new grocery stores have shown inconsistent results, with no significant changes in BMI(Reference Abeykoon, Engler-Stringer and Muhajarine8–Reference Cummins, Flint and Matthews11). This suggests other aspects of the food environment may also impact eating behaviours and obesity risk. The consumer food environment, conceptualised by Glanz and colleagues (2005), is characterised by what the consumer may encounter near and within a retail food outlet, which includes features such as pricing, marketing and range of choices(Reference Glanz, Sallis and Saelens12). Certain aspects of the consumer food environment have been related to eating behaviours and obesity(Reference Alber, Green and Glanz13–Reference Franco, Diez-Roux and Nettleton19). However, the majority of these studies have focused on the availability or pricing of certain foods. Little is known regarding the impact of product placement or marketing on eating behaviours or BMI(Reference Ghosh-Dastidar, Cohen and Hunter14). In addition, most studies characterise grocery stores in participants’ neighbourhoods rather than where they actually report shopping(Reference Alber, Green and Glanz13,Reference Lear, Gasevic and Schuurman16–Reference Franco, Diez-Roux and Nettleton19) .
In this study, we built on the existing literature on the consumer food environment by using perceived and objective measures of the food outlet where participants reported shopping most frequently to analyse cross-sectional associations of four domains of the consumer food environment (price, availability, marketing and product placement) with BMI and fruit and vegetable consumption(Reference Glanz, Sallis and Saelens12,Reference Glanz, Bader and Iyer20) . We hypothesised higher food prices, lower healthy food availability, limited healthy food marketing and having unhealthy foods available at checkout would be related to higher BMI and lower fruit and vegetable intake.
Methods
Study population
Data were collected in the context of the Chicago Healthy Eating Environments and Resources Study (CHEERS) between September 2016 and October 2017; 228 women aged 18–44 years were enrolled in the study through non-proportional quota sampling in four racial/ethnically and socio-economically diverse neighbourhoods in Chicago, IL. Pregnant women were not eligible for the study. Survey data were collected in-person in community centres, libraries, participants’ homes or our clinic. Additional information on the CHEERS, including recruitment and data collection methods, have been published elsewhere(Reference Mayne, Jose and Mo21). The study was approved by the Northwestern Feinberg School of Medicine Institutional Review Board (study number STU00203035).
Measures
This study examined consumer food environment exposure through four separate domains: price, availability, marketing and product placement. Using an instrument combining the Nutrition Environment Measures Survey(Reference Glanz, Sallis and Saelens22) and the Bridging the Gap Food Store Observation Form(Reference Rimkus, Powell and Zenk23), audits were conducted in stores that participants reported shopping at most frequently. Three stores were excluded because they were farmers’ markets and did not have the items or layout needed to assess the four domains of the consumer environment as described below. The Perceived Nutrition Environment Survey(Reference Green and Glanz24) was used to assess participants’ perceptions of the consumer food environment.
Price
Price was measured in two ways: as the cost of a food staple basket and the cost of a junk food basket(Reference Ghosh-Dastidar, Cohen and Hunter14). Data were collected using grocery store audits. The food staple basket price was the total price per ounce of four standard items commonly found in grocery stores: whole milk, white bread, high sugar cereal and low sugar cereal. The junk food basket was the sum of the total price per ounce of a 2-litre family size bottle of full sugar soda and the price of an 11-ounce bag of chips. For each item, either a standard brand or a store brand was used where possible: store brand for whole milk (52 % of all stores; 32 % were Deans brand), Sara Lee for white bread (50 %), Honey Nut Cheerios for high sugar cereal (91 %), Cheerios for low sugar cereal (83 %), Coke for full sugar soda (76 %) and Lays for bag of chips (81 %). In addition, one standard size was chosen whenever possible: half gallon for milk (82 % of all stores); 20 ounces for bread (72 % of all stores); 12·25 ounces for high sugar cereal (69 % of all stores); 12 ounces (47 % of all stores) or 8 ounces (34 % of all stores) for low sugar cereal. If the standard brand or size was not available, we used a comparable alternative. All prices reflect the non-sale price; grocery stores that did not have all the items listed (or a comparable alternative) were excluded (n 7). The price basket sum was then divided by the standard deviation and analysed continuously.
Availability
Availability was assessed differentially based on the outcome. Participants were asked: ‘At the store where you buy most of your food, how hard or easy is it to get each of these types of foods: fresh fruits and vegetables, canned or frozen fruits and vegetables, lean meats, and low fat products’. Possible responses ranged from very easy to very hard; both availability measures were dichotomised as all items are very or somewhat easy to obtain v. at least one item is not easy to obtain.
Marketing
Marketing information was taken from Perceived Nutrition Environment Survey questions on perceived store marketing of healthy and unhealthy foods. For healthy food marketing, participants were asked the extent to which they agree or disagree with two statements: ‘I notice signs that encourage me to purchase healthy foods’ and ‘I see nutrition labels or nutrition information for most packaged food at the stores’. For unhealthy food marketing, five items were used: ‘There are a lot of signs and displays encouraging me to buy unhealthy foods’; ‘I often buy food items that are located near the register’; ‘The unhealthy foods are usually located near the end of the aisles’; ‘I often buy items that are at eye level on the shelves’; ‘The foods near the cash register are mostly unhealthy choices’. All items were asked on a five-point scale of strongly disagree to strongly agree. Scores ranged from 1 to 5, with higher scores for healthy and unhealthy food marketing indicating more healthy/unhealthy items being promoted. Outcomes included BMI and daily fruit and vegetable consumption. BMI was calculated as weight in kg divided by height in metres squared; height and weight measurements were taken during in-person visits. Participant height (without shoes) was measured using a Seca 213 portable stadiometer. Participant weight was measured using a TANITA SC-240 Body Composition Analyzer. One person was excluded from the BMI measure because their height was reported incorrectly. Fruit and vegetable intake information was collected with questions from the Centers for Disease Control and Prevention’s Behavioral Risk Factor Surveillance System. The survey assesses self-reported frequency of different sources of fruits and vegetables, using a six-item FFQ(25). Previous studies have shown moderate reliability and validity of this measure(Reference Nelson, Holtzman and Bolen26). Total cups of fruits and vegetables consumed per day were then estimated for each participant using a previously developed model(Reference Moore, Dodd and Thompson27).
Placement
Placement was assessed through food store audits as types of items available at checkout. Items recorded included water, produce, candy and sugar-sweetened beverages. These items were combined and classified as dichotomous indicators of healthy item placement (presence of water and/or produce) and unhealthy item placement (presence of candy and/or sugar-sweetened beverages).
Statistical analysis
Analyses were conducted in 2019 with SAS 9.4 (SAS Institute). Unadjusted mean and frequency statistics were obtained for all study covariates for each outcome and measure of the consumer food environment exposures. The covariates age, neighbourhood, education, race/ethnicity and financial burden were assessed through questionnaire data. Age was analysed continuously; all other demographic variables were coded categorically. Neighbourhood was categorised as Beverly, Humboldt Park, Logan Square and Uptown. Education was categorised as less than high school, high school or some college, bachelor’s degree and graduate degree. Race was categorised as Hispanic/Latina, non-Hispanic White, non-Hispanic Black and non-Hispanic other. Financial burden was measured as the self-reported extent to which participants found it difficult to pay for basics like food and heating. Answers were then categorised as very hard or hard, somewhat hard and not hard at all(Reference Matthews, Kiefe and Lewis28).
The relationship between the consumer food environment and each outcome was estimated using multivariable linear regression models adjusted for all covariates. These were assessed through four models: model 1 (staple and junk food price), model 2 (availability), model 3 (marketing) and model 4 (product placement). For models 2 and 4, availability and product placement were analysed differently for BMI v. fruit and vegetable consumption. Specifically, for fruit and vegetable consumption, availability was assessed based on self-reported ease in buying fresh, canned, or frozen fruits and vegetables only, and placement was assessed based only on produce being available at checkout.
Among the BMI models, eight participants were excluded from the model 1 staple food basket analysis and twenty-two participants were excluded from the junk food basket analysis because seven and twenty-one participants did not have all price basket items at their corresponding grocery store, respectively, and one participant had missing BMI data. In model 4, three participants were excluded because the placement information was not available and one participant had missing BMI data. For the fruit and vegetable consumption models, seven and twenty-one participants were excluded from model 1 staple food basket and junk food basket analysis, respectively, due to unavailable price basket items. In model 4, three participants were excluded for missing placement data. Statistical significance was determined at the level of α = 0·05.
Results
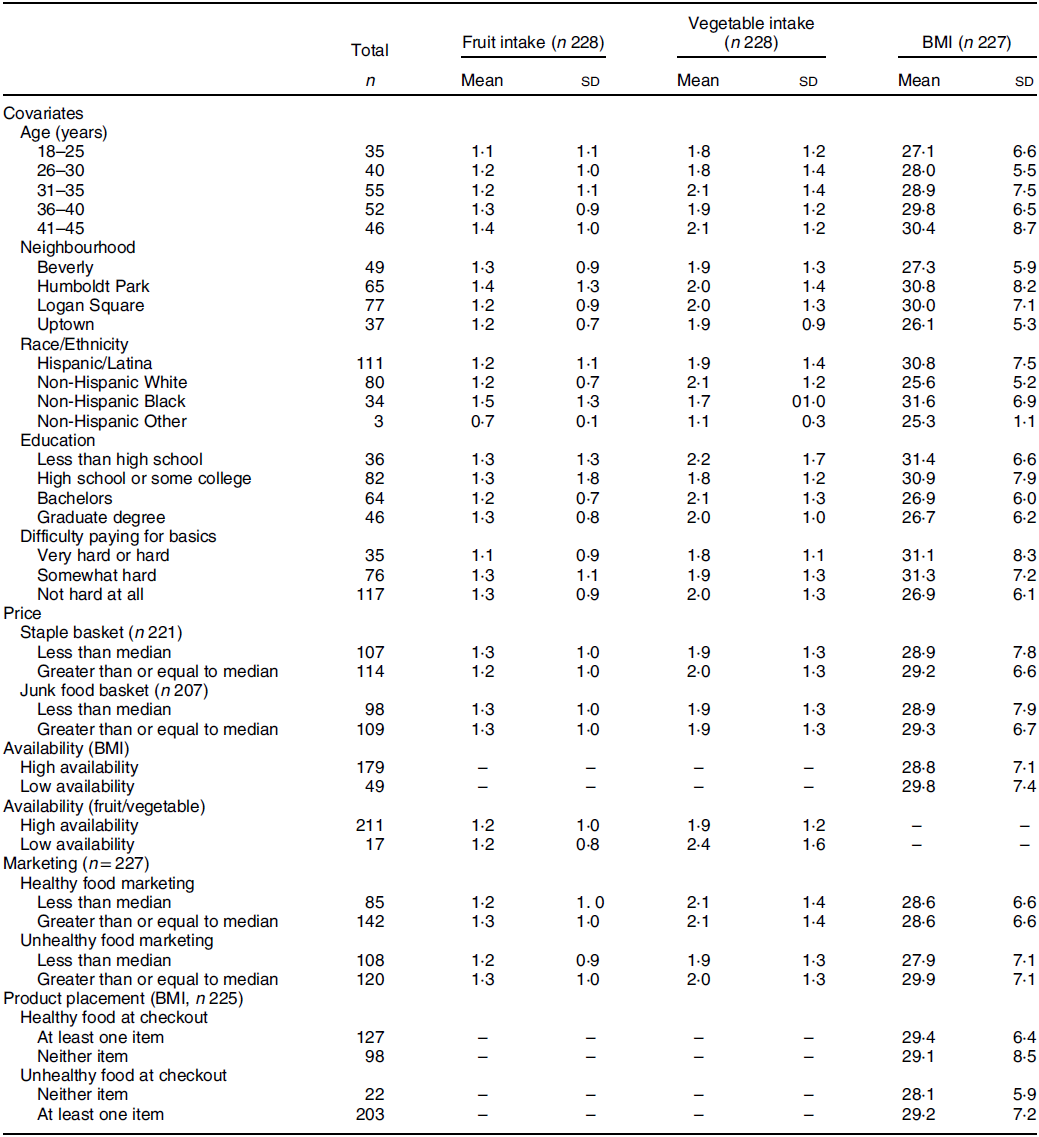
The mean age of participants was 33·8 years, and almost half (48·7 %) were Hispanic/Latina (not shown in tables). Mean BMI was 29·0 (sd 7·1) kg/m2, and participants ate an average of 1·3 (sd 1·0) cups of fruit and 2·0 (sd 1·3) cups of vegetables daily. A large percentage graduated college or graduate school (48·3 %), and over half (51·3 %) had no difficulty paying for basics. The median price for the food staple basket and junk food basket was $12·65 and $7·10, respectively. In the store where they shopped, most participants reported high availability of healthy foods (86·1 and 92·5 %, respectively, for the BMI and fruit/vegetable measures), and having at least one healthy item (56·4 %) and at least one unhealthy item (90·2 %) available at checkout. Few stores had fruits or vegetables available at checkout (0·9 %), so the association between placement and fruit/vegetable consumption was not evaluated.
Participants with a low availability of healthy foods and greater awareness of unhealthy food marketing had higher mean BMI (Table 1). There was no difference in mean fruit consumption for the fruit and vegetable availability measure, while those with high availability of fruits and vegetables had lower mean vegetable consumption. Both mean fruit and vegetable consumption were lower for less awareness of healthy food marketing.
Table 1 Mean fruit and vegetable intake (cups per day) and BMI (kg/m2) by study covariates; participants of the Chicago Healthy Eating Environments and Resource Study, Chicago, IL 2016–2017
No measure of the consumer food environment was significantly related to BMI after adjusting for age, neighbourhood, education, financial burden and race/ethnicity (Table 2). However, there was some suggestive evidence (P < 0·10) that participants who shopped at stores that were more expensive (β = −0·90, 95 % CI −1·94, 0·14) had lower BMI.
Table 2 Multivariable linear regression of BMI (mean kg/m2) and measures of the consumer food environment; participants of the Chicago Healthy Eating Environments and Resource Study, Chicago, IL 2016–2017*
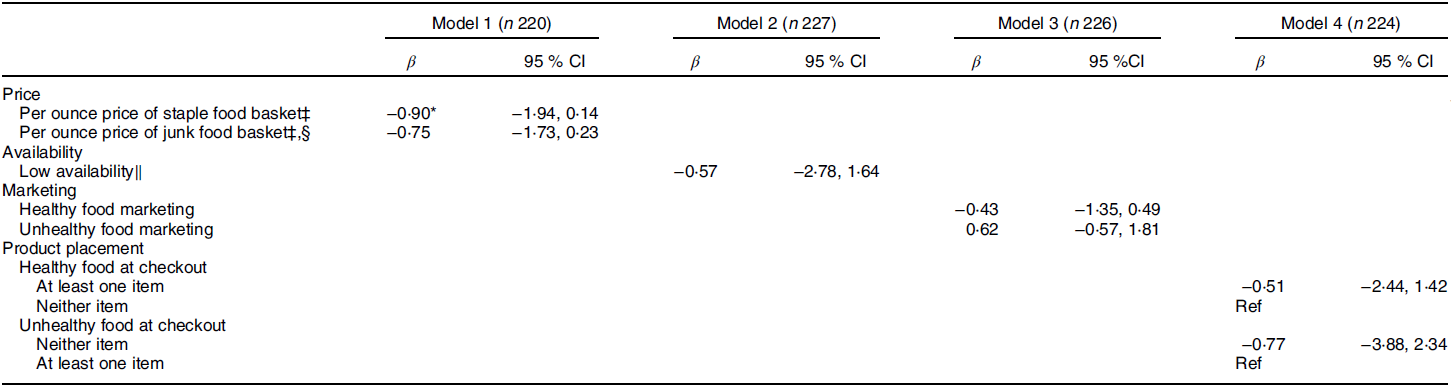
* P < 0·10, **P < 0·05, ***P < 0·01
† All models are adjusted for age, neighbourhood, education, race/ethnicity and financial burden.
‡ Beta-coefficient represents change in BMI associated with each sd increase in price.
§ n = 206.
‖ Self-reported difficulty obtaining at least one of the following: fresh fruits and vegetables, canned or frozen fruits and vegetables, lean meats, low fat products.
Marketing was the only consumer food environment measure associated with vegetable intake (Table 3). Participants who were exposed to greater healthy food marketing consumed roughly 0·24 cups more vegetables per day than those who did not (95 % CI 0·06, 0·42). None of the consumer food environment measures was related to fruit intake.
Table 3 Multivariable linear regression of fruit and vegetable intake (mean cups per day) and measures of the consumer food environment; participants of the Chicago Healthy Eating Environments and Resource Study, Chicago, IL 2016–2017†
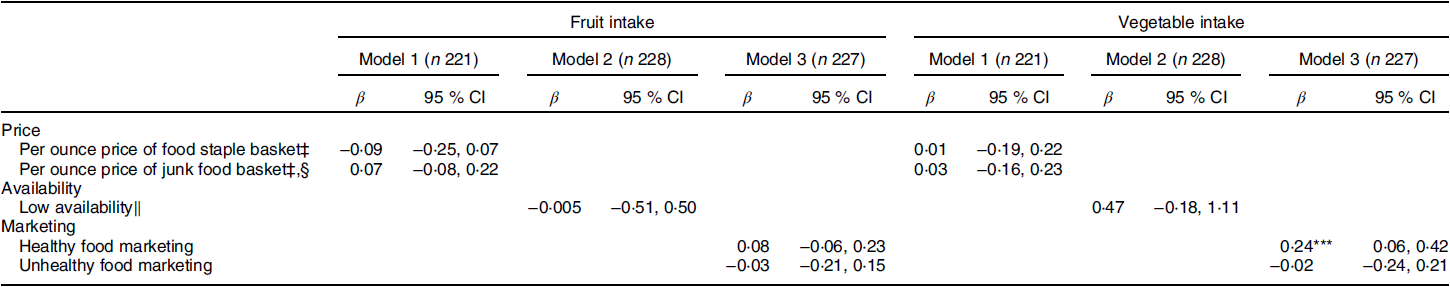
*P < 0·10, **P < 0·05, ***P < 0·01.
† All models are adjusted for age, neighbourhood, education, race/ethnicity and financial burden.
‡ Beta-coefficient represents change in BMI associated with each sd increase in price.
§ n = 207.
‖ Self-reported difficulty obtaining at least one of the following: fresh fruits and vegetables, or canned or frozen fruits and vegetables.
Discussion
This study found scant evidence on associations of the consumer food environment with BMI and vegetable consumption. We found that healthier in-store marketing in the consumer food environment was significantly related to vegetable intake but not with BMI. Though there have been studies examining the relationships of grocery store marketing with fruit and vegetable intake, they largely focus on food purchasing rather than individual intake(Reference Glanz, Bader and Iyer20). Grocery store signage has not been widely studied as a factor that impacts individual eating behaviours, but research suggests unhealthy food signage and displays likely influence shoppers’ purchases(Reference Ghosh-Dastidar, Cohen and Hunter14,Reference Chandon, Hutchinson and Bradlow29) . Our findings support this, as those who reported more healthy food signs in their grocery store had higher vegetable intake.
Studies on the impact of healthy food availability on eating behaviour have indicated mixed results(Reference Caspi, Sorensen and Subramanian7,Reference Bodor, Rose and Farley17,Reference Franco, Diez-Roux and Nettleton19,Reference Franco, Diez Roux and Glass30–Reference Gustafson, Sharkey and Samuel-Hodge32) . For example, a multi-site study found that those who had the lowest food availability in their nearest store were less likely to eat whole grains and fruit and more likely to eat fats and processed meats(Reference Franco, Diez-Roux and Nettleton19). In contrast, and consistent with our study, when examining the food stores that participants reported frequenting, a North Carolina study found that there was no significant association between healthy food availability and BMI, weight, or fruit and vegetable consumption(Reference Gustafson, Sharkey and Samuel-Hodge32).
While not statistically significant, the direction of our findings for price and BMI independent of individual socio-economic status is consistent with previous studies that used objective measures of price(Reference Ghosh-Dastidar, Cohen and Hunter14,Reference Lear, Gasevic and Schuurman16) . One explanation for this inverse relationship is that lower prices may correlate with lower quality, which would discourage shoppers from buying healthier items even if they are cheaper(Reference Hendrickson, Smith and Eikenberry33). Another is that less expensive stores are more likely to display and market unhealthy foods(Reference Ghosh-Dastidar, Cohen and Hunter14). Our findings suggest a need to examine characteristics of the consumer food environment outside of simple access. Though previous studies have shown a relationship between supermarket density and lower prevalence of obesity, overweight and BMI(Reference Morland, Diez Roux and Wing34,Reference Dubowitz, Ghosh-Dastidar and Eibner35) , this does not guarantee that individuals will shop there(Reference LeDoux and Vojnovic36,Reference Hillier, Cannuscio and Karpyn37) and, more importantly, consume the food.
A major strength of this study was that the grocery stores audited were those that participants reported visiting most frequently. In addition, objective measures were used to assess price and placement. Limitations to the study include the use of a cross-sectional design, small, non-representative sample size, and our use of self-reported measures of availability and marketing. Self-reported measures could be a potential source of bias if participants who prefer to eat healthy are more likely to notice healthy signage and nutrition information, or the extent to which certain food items are available. Further work is needed using more objective measures to determine the extent to which this is an issue.
In summary, these findings provide some evidence that the consumer food environment is associated with vegetable intake and BMI. More work is needed to better understand what specific aspects of the consumer food environment could serve as a target for future interventions to promote healthy eating and prevent obesity.
Acknowledgements
Acknowledgements: Not applicable. Financial support: This work was supported by the National Institutes of Health (K.N.K., grant number K01-HL133531). A.W.Z. was supported by the Brown University Royce Fellowship. Conflict of interest: None. Authorship: A.W.Z. and K.N.K. formulated the research question and designed the study. A.W.Z. and C.C.M. analysed the data and drafted the manuscript. K.N.K. and S.N.Z. provided critical feedback on manuscript drafts. Ethics of human subject participation: This study was conducted according to the guidelines laid down in the Declaration of Helsinki, and all procedures involving human subjects/patients were approved by the Northwestern University Institutional Review Board. Written informed consent was obtained from all subjects.


