


Food-based dietary guidelines are recommendations on what to eat in terms of foods, rather than nutrients, targeting the general public and using language and symbols that are easy to understand( 1 ). Promotion of better health in the population is the ultimate goal of dietary guidelines, and the FAO and WHO have advocated the use of food-based dietary guidelines for more than two decades( 1 , Reference Montagnese, Santarpia and Buonifacio 2 ). In Denmark, national food-based dietary guidelines were introduced in the 1970s and have since been updated several times, most recently in 2013. The 2013 update of the Danish food-based dietary guidelines was based on the current scientific evidence for the relationship between foods and risk of non-communicable diseases( Reference Tetens, Andersen and Astrup 3 ) and on the Nordic Nutrition Recommendations 2012( 4 ). The ten guidelines cover recommendations regarding fruits and vegetables, fish, whole grains, meat, dairy products, saturated fat, salt, sugar, water, diet variety and physical activity (Table 1)( 5 ).
Table 1 Diet quality index based on the 2013 Danish food-based dietary guidelines
E%, energy percentage.
Diet quality indices based on the 2005 edition of the Danish food-based dietary guidelines have previously been associated with both macro- and micronutrient intakes in studies using data from the national representative dietary survey( Reference Knudsen, Fagt and Trolle 6 – Reference Pedersen, Sisse and Groth 9 ). These studies showed that compliance with the national food-based dietary guidelines was fairly low in the Danish population( Reference Knudsen, Fagt and Trolle 6 , Reference Biltoft-Jensen, Fagt and Groth 7 ). For example, only 5 % complied with the guideline to reduce saturated fat intake to less than 10 % of energy and only 13 % consumed the recommended daily amount of dietary fibre of 3 g/MJ( Reference Biltoft-Jensen, Fagt and Groth 7 ). However, the most direct way to evaluate dietary guidelines is to investigate if adherence to the guidelines is associated with better health( Reference Willett and McCullough 10 ). While trials may provide essential information on the effects of dietary guidelines on short-term health outcomes like blood pressure and other biomarkers of disease risk, randomised controlled trials of dietary patterns and chronic diseases like IHD have proved difficult to conduct due to low compliance( Reference Willett and McCullough 10 ). Observational studies may thus contribute important information about the value of dietary guidelines in promoting better health and preventing non-communicable diseases. Diet quality measured with an index based in part on indices of overall diet quality and in part on previous editions of the Danish food-based dietary guidelines has been associated with CVD risk factors in a cross-sectional study, whereas no association was observed with risk of CHD in a cohort study( Reference Toft, Kristoffersen and Lau 11 , Reference Osler, Helms Andreasen and Heitmann 12 ).
The aim of the present study was to develop an index to assess adherence to the 2013 Danish food-based dietary guidelines and to investigate if higher adherence to the guidelines was associated with a lower risk of myocardial infarction (MI), a leading cause of morbidity and mortality( 13 ), in a large follow-up study of both men and women.
Participants and methods
Study design and population
The present study was based on data from the Danish follow-up study Diet, Cancer and Health. From December 1993 to May 1997, all men and women aged 50–64 years, born in Denmark, living in the greater areas of Aarhus or Copenhagen and with no previous cancer diagnosis registered in the Danish Cancer Registry were invited to participate in the study (n 160 725). In total, 57 053 (35 %) participants were recruited (Fig. 1). At baseline, the participants completed an FFQ enclosed with the invitation and they visited one of the study clinics. In the study clinic, the participants filled in a questionnaire about lifestyle and health and they underwent a physical examination including anthropometric measurements. The study design and measurement procedures have been described in detail by Tjønneland et al. ( Reference Tjønneland, Olsen and Boll 14 ).
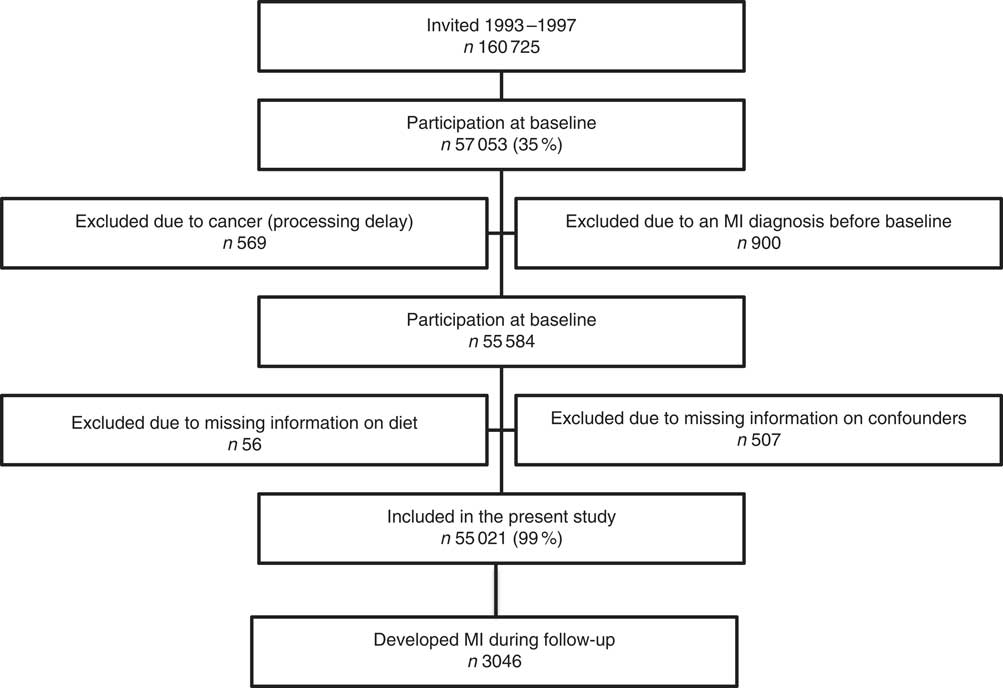
Fig. 1 Flowchart of the study population of Danish men and women from the Diet, Cancer and Health study (MI, myocardial infarction)
Dietary assessment
A 192-item semi-quantitative FFQ, which had been specifically developed for the Diet, Cancer and Health cohort, was mailed to the participants prior to the visit at the study clinic( Reference Overvad, Tjønneland and Haraldsdottir 15 ). The participants were asked to report their average intake of different food and beverage items over the previous 12 months, ranging from never to eight times or more per day. The FFQ was processed by optical scanning at the study centres and checked for reading errors and missing information. All unclear information was then clarified with the participant during a computer-guided interview. The software program FoodCalc (http://www.ibt.ku.dk/jesper/foodcalc/) based on the Danish food composition tables( Reference Møller and Saxholt 16 ) was used to calculate average daily intakes of foods and nutrients using standardised recipes and portion sizes( Reference Tjønneland, Haraldsdottir and Overvad 17 ). The FFQ was validated against two 7 d weighed diet records( Reference Tjønneland, Overvad and Haraldsdottir 18 ). Classification of the nutrient intake distributions into quintiles was used to evaluate the agreement between the two instruments. On average, 70 % of subjects were classified in the same (±1) quintile. Whole grains were defined in accordance with the definition by the American Association of Cereal Chemists( 19 ) and intake of whole grains in absolute amounts (g/d) was estimated based on information on the wholegrain content in specific products reported in 24 h dietary recalls conducted in a random sub-sample of participants. A detailed description of the estimation of whole grains intake is available elsewhere( Reference Kyrø, Skeie and Dragsted 20 ).
An index was developed to assess adherence to the current edition of the national Danish food-based dietary guidelines from 2013 (Table 1). This index, the Danish Dietary Guidelines Index, was constructed in concordance with the approach used by Knudsen et al. ( Reference Knudsen, Fagt and Trolle 6 ) when constructing an index based on the 2005 Danish food-based dietary guidelines with the addition of index components for intakes of whole grains and red meat. The following foods and nutrients were included in the new index: intake of fruits and vegetables, intake of fish, intake of whole grains, intake of red and processed meat, energy contribution from saturated fat and energy contribution from added sugar.
Intake of potatoes and mushrooms did not contribute to the intake of vegetables and up to 100 g of fruits could be replaced by juice( 21 ). The 2013 Danish food-based dietary guidelines do not specify how much saturated fat and added sugar may be allowed in a healthy diet. However, the Nordic Nutrition Recommendations state that both saturated fat and added sugar should contribute less than 10 % of total energy intake each, which was therefore used as cut-off when constructing the index components for these two guidelines( 4 ). The percentages of energy from saturated fat and added sugar were calculated based on total energy from carbohydrates, proteins and fat, excluding alcohol.
The guidelines ‘Choose low-fat dairy products’, ‘Eat food with less salt’, ‘Drink water’ and ‘Eat a variety of foods, but not too much, and be physically active’ were not included in the index. Most fat in milk and other dairy products is saturated fat. Thus, intake of fat from dairy products is reflected in the total intake of saturated fat, which is included as a separate index component. The guideline on meat advises not to consume more than 500 g of red and processed meat in total per week and this recommendation is included as a component in the Danish Dietary Guidelines Index. However, an index component has not been constructed for the recommendation to choose lean meat and cold meats, because the intake of fat from meat products is also reflected in the total intake of saturated fat. If the recommendation to drink water instead of soft drinks is followed, this should be reflected in a lower intake of added sugar. Guidelines on alcohol consumption are not part of the national Danish dietary guidelines and therefore alcohol is not included in the index. Dietary variety may be calculated as the number of different foods consumed during a given time period( Reference Thiele, Mensink and Beitz 22 , Reference Waijers, Feskens and Ocke 23 ). However, it would be possible to obtain a high total Danish Dietary Guidelines Index score only with a varied diet, since the index contains multiple items that capture the intakes of different foods or nutrients( Reference Waijers, Feskens and Ocke 23 ). Therefore, we decided not to include an item for dietary variety in the Danish Dietary Guidelines Index. The guideline on salt intake was also not included in the index since Na intake was poorly estimated in the FFQ.
Items were scored proportionally to compliance with the dietary guidelines and the score for each item ranged from 0 to 1, with 1 point assigned to an intake complying with the corresponding dietary guideline (Table 1). Scores were calculated as the ratio between the actual intake and the recommended intake for guidelines with a minimum recommended intake, and an item score of 1 point was assigned if the guideline was fully met. Thus, no extra points were given for eating more than the minimum recommended amount. For foods and nutrients with an upper limit of recommended intake, scores were calculated as 1 minus the difference between actual intake and recommended intake divided by the recommended intake ([1 – (actual intake – recommended intake)]/recommended intake). Negative item scores were replaced by 0 to ensure a score range between 0 and 1 for guidelines with maximum recommended intakes. Thus, participants consuming at least twice the maximum recommended intake would receive a score of 0 points. The guidelines ‘Eat fruits and lots of vegetables’ and ‘Eat more fish’ consisted of a recommended lower limit of total intake and a recommended lower limit of intake of vegetables and fatty fish, respectively. The scores for these two guidelines were constructed as a weighted sum of the subcomponents using equal weights. Thus, the score for the guideline ‘Eat fruits and lots of vegetables’ was calculated as follows: score=[(total intakefruit+vegetables/600 g)×0·5] + [(intakevegetables/300 g)×0·5]. Similarly, the score for the guideline ‘Eat more fish’ was calculated as follows: score=[(intaketotal fish/350 g)×0·5] + [(intakefatty fish/200 g)×0·5].
The individual guidelines of the 2013 Danish food-based dietary guidelines are not prioritised or ranked; therefore, no weighting was applied when constructing the index and the scores of the individual items were simply summed. The total score of Danish Dietary Guidelines Index thus ranged from 0 points (no compliance) to 6 points (full compliance).
Outcome
The outcome was incident non-fatal and fatal MI (International Classification of Diseases, revision 8 (ICD-8) codes: 410–410.99; International Classification of Diseases, revision 10 (ICD-10) codes: I21.0–I21.9). Participants with sudden cardiac death (ICD-8 code: 427.27; ICD-10 codes: I46.0–I46.9) were also included as cases if the cardiac death was believed to be caused by MI. Cases were identified by record linkage to the Danish National Patient Register and the Danish Causes of Death Register using the unique identification number assigned to all Danish citizens( Reference Schmidt, Schmidt and Sandegaard 24 , Reference Helweg-Larsen 25 ). From enrolment and until 31 December 2003, cases were validated by review of medical records in accordance with the guidelines of the American Heart Association and the European Society for Cardiology( Reference Luepker, Apple and Christenson 26 ). From 1 January 2004 and until end of follow-up (2 July 2013), and for participants whose medical records had not been available in the previous period, participants with an MI diagnosis from a hospital ward were included as cases without validation, as the positive predictive value of these diagnoses was >90 %( Reference Joensen, Jensen and Overvad 27 ).
Covariates
Information on smoking, physical activity, education and history of hypertension, hypercholesterolaemia and diabetes was obtained from the self-administered lifestyle questionnaire at baseline. Smoking was reported as ‘never’, ‘former’ or ‘current’; duration of smoking in years; and the number of cigarettes, cigars, cheroots and tobacco pipes smoked per day. For current smokers, tobacco consumption was calculated in grams per day by using conversion factors of 1·0 for cigarettes, 4·5 for cigars and 3·0 for cheroots and tobacco pipes. Leisure-time physical activity during the past year was reported as hours per week engaged in walking, gardening, housework, home maintenance, biking and sports during summer and winter. Moderate-to-vigorous leisure-time physical activity was calculated as the average number of hours per week spent on biking and sports during the whole year. Length of education was reported in predefined categories (≤7 years, 8–10 years and >10 years). History of hypertension, hypercholesterolaemia and diabetes was recorded as ‘yes’, ‘no’ or ‘don’t know’ and whether medication was taken for the condition or not (‘yes’, ‘no’). Participants were classified as having the condition if they answered ‘yes’ to having the condition or to taking medication for it.
Trained laboratory technicians obtained baseline measures of height, body weight and waist circumference. Height was measured to the nearest 0·5 cm when participants were standing without shoes. Body weight was measured with a digital scale with participants wearing light underwear and recorded to the nearest 100 g. Waist circumference was measured at the narrowest circumference between the lower rib and the iliac crest (the natural waist), or if waist narrowing was indeterminable, halfway between the lower rib and the iliac crest, and recorded to the nearest 0·5 cm.
Exclusions
Participants with a cancer diagnosis before baseline, which had not been registered in the Danish Cancer Registry at the time of invitation due to processing delay, were excluded according to the inclusion criteria. Furthermore, participants with a diagnosis of MI before enrolment were excluded. Finally, participants with missing information on dietary intake or any of the potential confounders were excluded.
Statistical analyses
The Cox proportional hazards model was employed to estimate hazard ratios (HR) with 95 % CI for the association between the Danish Dietary Guidelines Index and incidence of MI. The analyses were conducted in men and women separately. We used age as the underlying time scale and all analyses were adjusted for baseline age and stratified by tertiles of date of enrolment since the assumption of conditional independence between entry time, i.e. age and date at entry in the Diet, Cancer and Health cohort, and event time underlying Cox survival analyses was not fulfilled in all models. Participants were considered at risk from the date of enrolment into the Diet, Cancer and Health study until the time of MI (n 3046), death due to other causes (n 7968), emigration (n 349), change in personal identification number (n 2) or 2 July 2013, whichever came first.
For the analyses, the Danish Dietary Guidelines Index was categorised into four groups: <3 points; 3–<4 points; 4–<5 points; and ≥5 points. The two middle categories had a range of 1 point corresponding to compliance with one extra guideline. Due to few participants with scores <3 and ≥5 points, respectively, the lowest and the highest category of adherence covered a broader score range than the two middle categories to secure sufficient numbers of cases in each category.
Potential confounders were selected a priori based on established risk factors for CVD. Model 1a included adjustment for age and enrolment date only, while the following variables were included as potential confounders in model 1b: alcohol intake (yes, no; g/d), leisure-time physical activity (h/week), smoking (never, former, current smoker <15 g tobacco/d, 15–25 g tobacco/d, >25 g tobacco/d) and education (≤7 years, 8–10 years, >10 years). Finally, model 2 included adjustments for the following potential intermediate variables: BMI (kg/m2), waist circumference (cm) and self-reported history of hypertension (yes, no, don’t know), hypercholesterolaemia (yes, no, don’t know) and diabetes mellitus (yes, no, don’t know).
All continuous covariates were included in the models using restricted cubic splines with three knots placed at the 10th, 50th and 90th percentiles as recommended by Harrel( Reference Harrell 28 ). The Danish Dietary Guidelines Index was analysed both as a categorical and as a continuous variable. When analysed as a continuous variable, the Danish Dietary Guidelines Index was modelled using restricted cubic splines with three knots and a Wald test was used to test for non-linearity by testing if the second spline parameter was statistically significantly different from zero. Since non-linearity was detected, linear estimates are not provided.
The proportional hazards assumption was tested in each tertile of enrolment date with log-rank tests based on Schoenfeld residuals and further assessed with log–log plots. No considerable violations were found. Analysis time was also split into three age periods (50–64 years, 65–74 years and ≥75 years) so that participants contributed to successive periods over the course of follow-up, starting with 50–64 years of age at recruitment. The analyses were then repeated to investigate if the association between adherence to the 2013 Danish food-based dietary guidelines and incidence of MI differed across age.
In supplementary analyses, the associations between the individual index components and risk of MI were investigated. The score of each index component was dichotomised according to compliance (no/yes) and the items were analysed in mutually adjusted models. We also conducted supplementary analyses of the association between the Danish Dietary Guidelines Index and risk of MI stratified by baseline self-reported disease.
All reported tests are two-tailed and P values below 0·05 were considered statistically significant. The statistical software package Stata version 13.1 was used to conduct the analyses.
Results
A flowchart of the study population is shown in Fig. 1. A total of 57 053 subjects were recruited at baseline; however, 569 subjects were later removed from the cohort due to a cancer diagnosis prior to enrolment. Nine hundred participants were excluded due to an MI diagnosis before baseline, information on dietary intake was missing for fifty-six participants and 507 participants were excluded due to missing information on potential confounders. Thus, 55 021 subjects (53 % women) were included in the present study. During a median follow-up of 16·9 years, 3046 participants were diagnosed with a first-time MI.
Intakes of fruit and vegetables, fish, whole grains, vegetable oils and low-fat dairy were positively associated with the Danish Dietary Guidelines Index, whereas intakes of red and processed meat, saturated fat, butter and added sugar were inversely associated with the Danish Dietary Guidelines Index (see online supplementary material, Supplemental Table 1). No clear tendencies were observed for intakes of salt and high-fat dairy. The correlation coefficients between the individual components and the total Danish Dietary Guidelines Index ranged from r=0·43 to r=0·62 for all index components except the added sugar component, where the correlation with the total index was r=0·28 (Supplemental Table 2). The correlations between the individual index components ranged between r=−0·20 and r=0·34. Compliance with the guidelines was low except for the guideline regarding added sugar (Supplemental Table 1). The proportion of men was lower across higher Danish Dietary Guidelines Index scores. Thus, men composed 67 % of the participants with a score of <3 but only 24 % of the participants with a score of ≥5. The maximum score of the Danish Dietary Guidelines Index was obtained by only 0·04 % of the cohort, while 6·8 % had a total score of ≥5. In general, the proportion of subjects with a healthy lifestyle was higher across higher Danish Dietary Guidelines Index scores (Supplementary Table 1). For example, 53 % of the male participants with a score of <3 were current smokers compared with 21 % of the male participants with a Danish Dietary Guidelines Index score of ≥5. In women, the equivalent proportions were 52 and 19 %, respectively.
Characteristics of the study population are shown in Table 2. The median Danish Dietary Guidelines Index score was 3·6 (5th–95th percentile: 2·4–4·9) among men and 4·0 (5th–95th percentile: 2·7–5·2) among women. Intakes of fruits and vegetables, fish, whole grains and low-fat dairy were slightly lower in cases compared with the total study population, whereas intakes of red and processed meat and saturated fat were slightly higher among cases (data not shown). In addition, the median BMI and waist circumference were higher among cases and the proportion of current smokers and the proportion with ≤7 years of education were higher in cases compared with the total study population.
Table 2 Characteristics of the total study population of Danish men and women (n 55 021) from the Diet, Cancer and Health study
E %, energy percentage.
Values are medians with 5th–95th percentiles (P5–P95) unless otherwise indicated.
* Defined as fish containing >1 g n-3 PUFA/100 g; includes trout, salmon, herring, mackerel and lumpfish roe.
† Includes skimmed (0·5 g fat/100 g product) and semi-skimmed milk (1·5 g fat/100 g product), buttermilk (0·5 g fat/100 g product), low-fat yoghurt (1·5 g fat/100 g product), cottage cheese (5 g fat/100 g product), cheese, firm (16 g fat/100 g product), low-fat ice cream (3 g fat/100 g product), processed cheese (17 g fat/100 g product) and unripened smoked cheese (0·5 g fat/100 g product).
‡ Includes whole milk (3·5 g fat/100 g product), whole milk yoghurt (3·5 g fat/100 g product), cream (13 or 38 g fat/100 g product), cheese, firm (25 g fat/100 g product), brie (28 g fat/100 g product), camembert (22 g fat/100 g product), Roquefort/Danish blue (30 g fat/100 g product), cream cheese (37 g fat/100 g product), ice cream (10 g fat/100 g product) and unripened smoked cheese (10 g fat/100 g product).
In men, a statistically significant inverse association was observed between the Danish Dietary Guidelines Index and incidence of MI (P=0·009; Table 3). After adjustment for potential confounders, the hazard of MI was 13 % lower among men with a Danish Dietary Guidelines Index score of 3–<4 (HR=0·87; 95 % CI 0·78, 0·96) and 18 % lower among men with a score of 4–<5 (HR=0·82; 95 % CI 0·72, 0·93) compared with men with a score of <3 (model 1b). The corresponding HR for MI in women with a score of 3–<4 and 4–<5 were 0·76 (95 % CI 0·63, 0·93) and 0·74 (95 % CI 0·60, 0·91), respectively (Table 4). However, there was no statistically significant linear trend across the Danish Dietary Guidelines Index in women (P=0·214). In both men and women, participants with a score of ≥5 had a 10 % lower hazard of MI compared with participants with a score of <3; however, the HR were not statistically significant. When modelling the association between the Danish Dietary Guidelines Index and incidence of MI using restricted cubic splines, an inverse association was observed up to a score of 4, where the association levelled off (Fig. 2). A similar pattern was observed in men, but less distinct, and the association between the Danish Dietary Guidelines Index and risk of MI was statistically significantly non-linear only among women (women, P=0·021; men, P=0·088).
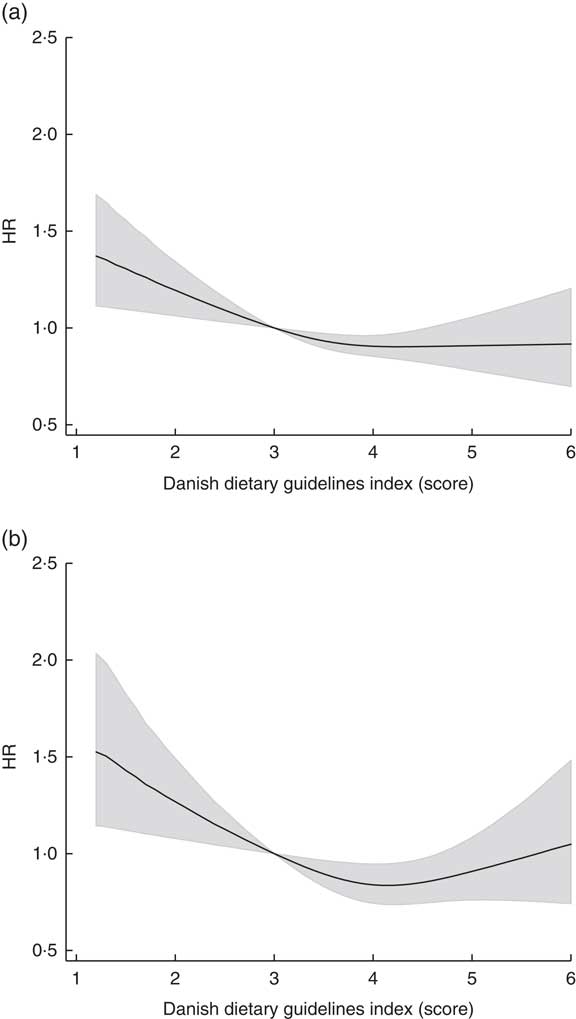
Fig. 2 Hazard ratio (HR) of myocardial infarction across the Danish Dietary Guidelines Index, with a score of 3 as reference, among Danish men (a) and women (b) (n 55 021) from the Diet, Cancer and Health study. The solid line is the HR and the shaded area is the 95 % CI. The Danish Dietary Guidelines Index was modelled using restricted cubic splines with three knots and model 1b, which adjusted for baseline age, alcohol intake, alcohol abstinence, physical activity, smoking and education, and was stratified by date of enrolment
Table 3 Hazard ratios (HR) and 95 % CI of myocardial infarction by adherence to the Danish Dietary Guidelines Index in men (n 25 961) from the Diet, Cancer and Health study
Ref., referent category.
All analyses were stratified by date of enrolment (tertiles).
Model 1a: adjusted for length of follow-up (i.e. baseline age).
Model 1b: model 1a plus alcohol intake, alcohol abstinence, physical activity, smoking and education.
Model 2: model 1b plus baseline BMI, waist circumference, hypertension, hypercholesterolaemia and diabetes.
* Test for trend was performed by including the categorised index as a linear variable in the model.
Table 4 Hazard ratios (HR) and 95 % CI of myocardial infarction by adherence to the Danish Dietary Guidelines Index in women (n 29 060) from the Diet, Cancer and Health study
Ref., referent category.
All analyses were stratified by date of enrolment (tertiles).
Model 1a: adjusted for length of follow-up (i.e. baseline age).
Model 1b: model 1a plus alcohol intake, alcohol abstinence, physical activity, smoking and education.
Model 2: model 1b plus baseline BMI, waist circumference, hypertension, hypercholesterolaemia and diabetes.
* Test for trend was performed by including the categorised index as a linear variable in the model.
In general, the estimates in women were slightly lower than in men. However, the CI were also wider in women.
The association between the Danish Dietary Guidelines Index and risk of MI was also present after adjustment for potential intermediate variables (model 2; Tables 3 and 4).
When analysis time was split into three age periods, stronger inverse associations were found in the age period <65 years than in the age period 65–74 years, and in the age period ≥75 years positive associations between the Danish Dietary Guidelines Index and risk of MI were observed, albeit with wide CI (see online supplementary material, Supplemental Tables 3 and 4).
In men, statistically significant inverse associations were observed between the guidelines concerning whole grains and sugar and risk of MI (see online supplementary material, Supplemental Table 5). In women, a statistically significant positive association was observed between compliance with the guideline to eat less saturated fat and risk of MI (Supplemental Table 6). No other significant association between individual guidelines and risk of MI was observed.
In the supplementary analyses stratified by baseline self-reported disease, the same patterns were observed as in the main analyses (see online supplementary material, Supplemental Table 7).
Discussion
In the present study, we found that higher adherence to the 2013 Danish food-based dietary guidelines was associated with a lower risk of MI. The inverse association was observed up to a Danish Dietary Guidelines Index score of 4, which corresponds to full compliance with four out of six guidelines, above which the association levelled off.
The strengths of our study include the follow-up design, detailed information on potential confounders and nearly complete ascertainment of vital status. The negligible censoring due to unknown vital status (0·6 %), which was due to emigration, limits the concern for selection bias.
A potential limitation of our study is the dietary assessment, which was conducted using a self-administered FFQ at enrolment into the study. Some misclassification of dietary intake is inevitable, but due to the follow-up design, any misclassification was probably non-differential with respect to the outcome, which generally leads to an underestimation of the true association. However, diet was assessed once only and participants may have changed their dietary intake during follow-up. If changes in dietary intake are associated with risk of MI, it could bias our results. Most likely people who perceive themselves as being at higher risk of CVD would try to adopt a healthier diet, thus leading to an underestimation of the risk associated with consuming a less healthy diet at entry to the study. Another limitation was the low validity of the information on salt intake in the study population, which meant that an item for the recommendation to reduce salt intake was not included in the Danish Dietary Guidelines Index( Reference Cobb, Anderson and Elliott 29 ).
As in all observational studies, residual confounding cannot be ruled out. However, our data allowed profound adjustment for many potential confounders. Moreover, all continuous confounders were modelled using restricted cubic splines, which limits the possibilities of residual confounding from these risk factors( Reference Greenland 30 ). In previous studies of diet quality, relative risks have been consistently attenuated after adjustment for age, BMI, physical activity, smoking and education( Reference Wirt and Collins 31 ). We also found that the associations between the Danish Dietary Guidelines Index and risk of MI were attenuated after adjustment for potential confounders (model 1b). Since BMI may be considered an intermediate variable we did not adjust for it in our main model. However, the association between the Danish Dietary Guidelines Index and risk of MI was also present after adjustment for BMI and other potential intermediate variables (model 2).
A plateau was observed in the association between Danish Dietary Guidelines Index score and risk of MI indicating that no further effect on MI risk is gained by adherence to more than four guidelines. However, fewer than 7 % of the study population obtained a score of ≥5 and the CI for this category is therefore wide. Those who have adapted a very healthy diet may be subjects with underlying diseases or family predisposition to CVD. A higher proportion among both men and women with a score of ≥5 reported hypertension, hypercholesterolaemia and diabetes at entry to the study compared with participants with a score of <5. Thus, confounding by indication might explain why we find indications of a higher risk of MI among participants with a score ≥5 compared with participants with a score of 4–<5. However, the same pattern was observed when the analysis was stratified by baseline self-reported disease.
Many different indices of diet quality exist and they have been applied in different study populations using different study designs, which makes comparison across studies difficult( Reference Waijers, Feskens and Ocke 23 , Reference Fransen and Ocke 32 , Reference Wirfalt, Drake and Wallstrom 33 ). In addition, national food-based dietary guidelines reflect national dietary habits and may not be applicable across different populations. However, since dietary guidelines are generally also based on the available scientific evidence on diet and non-communicable diseases, similarities do exist between national guidelines in different countries. Thus, it is common for national guidelines to include recommendations on a high intake of fruits and vegetables and to recommend low intakes of added sugar and saturated fat( Reference Montagnese, Santarpia and Buonifacio 2 , 34 ). However, although the major food groups are often similar across countries, there is still no agreement on how to group specific foods. For example, while the majority of European countries including Denmark group potatoes together with grains, some countries consider potatoes as vegetables( Reference Montagnese, Santarpia and Buonifacio 2 ). This further contributes to difficulties in comparing studies of dietary guidelines from different countries, and warrants national studies of food-based dietary guidelines.
Numerous foods and nutrients have been associated with risk of CHD including fruits, vegetables, fish and whole grains, which are all incorporated in the Danish food-based dietary guidelines( Reference Mente, de Koning and Shannon 35 – Reference Aune, Keum and Giovannucci 38 ). It is therefore not surprising that adherence to the 2013 Danish food-based dietary guidelines was inversely associated with the risk of MI. Yet, previous cohort studies in other countries with national dietary guidelines similar to the Danish food-based dietary guidelines have not unequivocally found adherence to be associated with lower risk of CVD( Reference Struijk, May and Wezenbeek 39 – Reference Hlebowicz, Drake and Gullberg 41 ). Nevertheless, adherence to the 2005 Swedish dietary guidelines, which are based on the Nordic Nutrition Recommendations, was associated with lower risk of CVD( Reference Hlebowicz, Drake and Gullberg 41 ). Diet quality measured with an index based on the 1994 Danish food-based dietary guidelines has also been inversely associated with absolute risk of IHD (the Copenhagen Risk Score), total cholesterol, LDL cholesterol, TAG and homocysteine in a cross-sectional study( Reference Toft, Kristoffersen and Lau 11 ).
In accordance with studies in other Danish cohorts of previous editions of the Danish food-based dietary guidelines( Reference Knudsen, Fagt and Trolle 6 , Reference Biltoft-Jensen, Fagt and Groth 7 ), we found that compliance with the 2013 Danish food-based dietary guidelines was low. Only an infinitesimal 0·04 % of the participants complied fully with all six included guidelines, while approximately 7 % complied with at least five of the guidelines. The only exception was the guideline to eat less sugar, where nearly 85 % of the Diet, Cancer and Health cohort reported an intake below the maximum recommended intake of 10 % of energy, which may be explained by a low consumption of sugar-sweetened beverages in the recruited age groups. The lowest compliance was seen for intake of fruits and vegetables and intake of whole grains, where the proportion of compliers was less than 10 %. The recommendation for a high intake of fruits and vegetables has been part of the Danish food-based dietary guidelines since the 1994 edition, whereas the recommendation on whole grains is relatively new and was first included in the guidelines in 2009. In that connection it may be noted that the dietary data in our study were collected between 1993 and 1997, and the intake of whole grains may have increased since then due to a larger focus on whole grains in the media and a greater supply of wholegrain products.
The individual components in the Danish Dietary Guidelines Index were scored proportionally to the recommended intake when constructing the total index. It may be considered a limitation with the scoring that dishes and composite foods were reported as not fully continuous frequencies in the FFQ and then disaggregated into separate foods, which were translated into a continuous value between 0 and 1. The proportional scoring method was chosen over a simpler binary approach to avoid low discriminating power, and thus low contribution to the overall index, for items where only a small proportion of the participants met the recommendation. Still, using this approach the component for added sugar intake contributed little to the total score, since a very high proportion of the participants met this guideline. In the supplementary analyses of the individual guidelines, items were scored dichotomously, thus only given points for full compliance, to let the coefficients have a simple interpretation. In general, inverse or null associations were observed between adherence to the individual dietary guidelines and risk of MI. A positive association was observed between compliance with the guideline to eat less saturated fat and risk of MI, which is in the opposite direction of what would be expected. However, these supplementary analyses do not take substitutions into account, and, as has been observed in other studies, it may be important what macronutrient replaces saturated fat with regard to risk of CHD( Reference Jakobsen, O’Reilly and Heitmann 42 ).
Total energy intake was not taken into account when constructing the majority of components comprising the Danish Dietary Guidelines Index since the recommendations in the 2013 Danish food-based dietary guidelines are not expressed relative to energy intake in the official pamphlet or on the associated website( 5 , 43 ). Exceptions are the components for saturated fat and added sugar, where scores were calculated based on the energy percentages stated in the Nordic Nutrition Recommendations. As a result, subjects with a high energy intake will more easily meet the recommendations for intakes of fruits and vegetables, fish and whole grains, and thus receive a high score, although the quality of their diet may not be healthier than that of individuals with lower energy requirements. This could introduce confounding and it may be argued that total energy should be adjusted for in the Cox regression model. However, if total energy intake is added to the model, unspecified food substitutions would be introduced, obscuring the interpretation of the results. For these reasons, total energy intake was not allowed for when constructing the dietary index nor adjusted for in the analyses.
Conclusion
In conclusion, we found that adherence to the national Danish food-based dietary guidelines was associated with a lower risk of MI and our study thus supports the effectiveness of the 2013 Danish food-based dietary guidelines in prevention of MI in the general population. Food-based dietary guidelines aim to ensure the nutrient needs of the general population, promote better health and reduce the risk of non-communicable diseases. Future cohort studies are needed to elucidate the effectiveness of the 2013 Danish food-based dietary guidelines in reducing the risk of other major chronic diseases.
Acknowledgements
Acknowledgements: The authors thank the Danish Cancer Society and the staff at the Diet, Cancer and Health study for the collection and administration of data. Financial support: This work is part of the project ‘Diet and prevention of ischemic heart disease: a translational approach’ (DIPI; http://www.dipi.dk), which is supported by the Danish Council for Strategic Research (today, Innovation Fund Denmark) (contract number 0603-00488B). The Danish Council for Strategic Research had no role in the design, analysis or writing of this article. Conflict of interest: None. Authorship: C.P.H., C.C.D. and K.O. formulated the research question and designed the study; A.T. and K.O. collected the data; C.P.H. conducted the statistical analyses and drafted the manuscript; C.P.H., C.C.D., K.O., I.T., E.T.P., M.U.J. and K.O. contributed to the interpretation of the results and the critical revision of the manuscript. All authors read and approved the final manuscript. Ethics of human subject participation: This study was conducted according to the guidelines laid down in the Declaration of Helsinki and all procedures involving human subjects were approved by the ethics committees in Aarhus and Copenhagen. Written informed consent was obtained from all subjects.
Supplementary material
To view supplementary material for this article, please visit https://doi.org/10.1017/S1368980017003822


