


Hypertension is considered a public health problem worldwide, affecting about 22 % of adults aged 18 years old and older(Reference Zhou, Bentham and Di Cesare1). Besides its high magnitude, hypertension is the most important risk factor for CVD, which are the leading cause of death worldwide(2). Hypertension is estimated to be responsible for at least 45 % of deaths related to ischemic heart disease and 51 % related to cerebrovascular disease(3).
In Brazil, the National Health Survey showed that the prevalence of hypertension in 2013 was 32·5 % in the adult population (31·7 % women and 33 % men)(Reference Malta, Gonçalves and Machado4). In addition, CVD accounted for more than 27 % of all deaths in 2017(5).
The primary guidelines for the prevention of hypertension advocate for increased consumption of diets rich in fruits and vegetables; regular practice of physical activity; weight loss; and reduced alcohol intake and smoking as strategies that can contribute to the gradual decrease in blood pressure (BP)(3,Reference Whelton, Carey and Aronow6–Reference Williams, Mancia and Spieringet8) .
Recent longitudinal studies have shown that the degree of food processing is associated with chronic diseases(Reference Martínez, Juul and Neri9–Reference Mendonça, Pimenta and Geaet12) and mortality(Reference Rico-Campà, Martínez-González and Alvarez-Alvarez13). However, few investigations have evaluated if consumption according to the degree of food processing increases the risk of hypertension. To our knowledge, only one Spanish prospective cohort study has found a positive association between the consumption of ultra-processed foods (UPF) and the incidence of hypertension(Reference Mendonça, Lopes and Pimenta14).
Moreover, this study presents the particularity of evaluating the association of all food processing groups proposed in the NOVA classification with hypertension, as well as estimating the outcome based on the cut-off points recently proposed by the American College of Cardiology/American Heart Association (ACC/AHA)(Reference Whelton, Carey and Aronow6), aspects not yet explored in another research with the same theme.
We believe that the consumption of each NOVA classification food group has different effects in the development of hypertension. Higher consumption of processed foods and UPF increases the risk of this disease, while higher consumption of unprocessed/minimally processed foods and culinary preparations (U/MPF&CP) is a protective factor against the occurrence of hypertension.
Thus, the objective of this study was to prospectively analyse the association between food consumption according to the degree of processing and the incidence of hypertension in the Cohort of Universities of Minas Gerais (CUME) participants, Brazil.
Methods
Type of study
The CUME project is an observational, open cohort epidemiological study conducted in Brazil since 2016 with alumni from five universities in the state of Minas Gerais. Its objective is to evaluate the impact of Brazilian dietary patterns and nutrition transition on chronic non-communicable diseases.
The recruitment of participants is permanent, allowing a continuous sample size growth with each follow-up wave, which occurs every 2 years. Thus, previously recruited participants receive new questionnaires (Q_2, Q_4, …, Q_n), while new participants receive the baseline questionnaire (Q_0).
The project design, dissemination strategies and baseline first participants’ profile were detailed in a previous publication(Reference Gomes-Domingos, Miranda and Pimenta15).
Data collection
The online baseline questionnaire answered by the participants between March and August 2016 on the CUME virtual platform consisted of two question blocks. The first block contained questions about sociodemographic and economic aspects, lifestyle, reported morbidity, medication use, personal history of clinical and biochemical tests over the past 2 years and anthropometric data. The second block was a FFQ validated for the Brazilian population and composed of 144 food items(Reference Henn, Fuchs and Moreira16), separated into eight food groups (dairy, meat and fish, cereals and legumes, oils and fats, fruits and vegetables, beverages and other foods including food preparations, sugar, honey, sweets, among others).
The first follow-up questionnaire, answered by the participants between March and August 2018 on the same platform, consisted of sociodemographic and economic data, lifestyle, reported morbidity, medication use, personal history of clinical and biochemical tests from the past 2 years, anthropometric data and eating habits. Its main objective was to evaluate changes in the participants’ lifestyle and disease incidence.
Study population
The baseline and first follow-up wave constituted the database of this study. In 2016, a total of 81 147 alumni were invited to participate in the CUME project. Among them, 3282 filled out both question blocks in the baseline questionnaire, which represented a response rate of 4 %. In 2018, 2496 baseline participants also answered the first follow-up questionnaire and the retention rate was 76 %. Among them, we excluded those with the following characteristics at baseline: (1) total energy intake predefined as extreme (low: <2 092 000 kJ/d or high: >25 104 000 kJ/d; (n 54))(Reference Schmidt, Duncan and Mill17); (2) pregnant women and women who had children in the last year prior to the application of the questionnaires (n 245); (3) foreigners (n 6) and Brazilian residents abroad (n 104) and (4) prevalent hypertension – according to ACC/AHA criteria, a systolic blood pressure (SBP) ≥ 130 mmHg and/or a diastolic blood pressure (DBP) ≥ 80 mmHg and/or antihypertensive medication use (n 866)(Reference Whelton, Carey and Aronow6), resulting in a final sample of 1221 participants (Fig. 1).
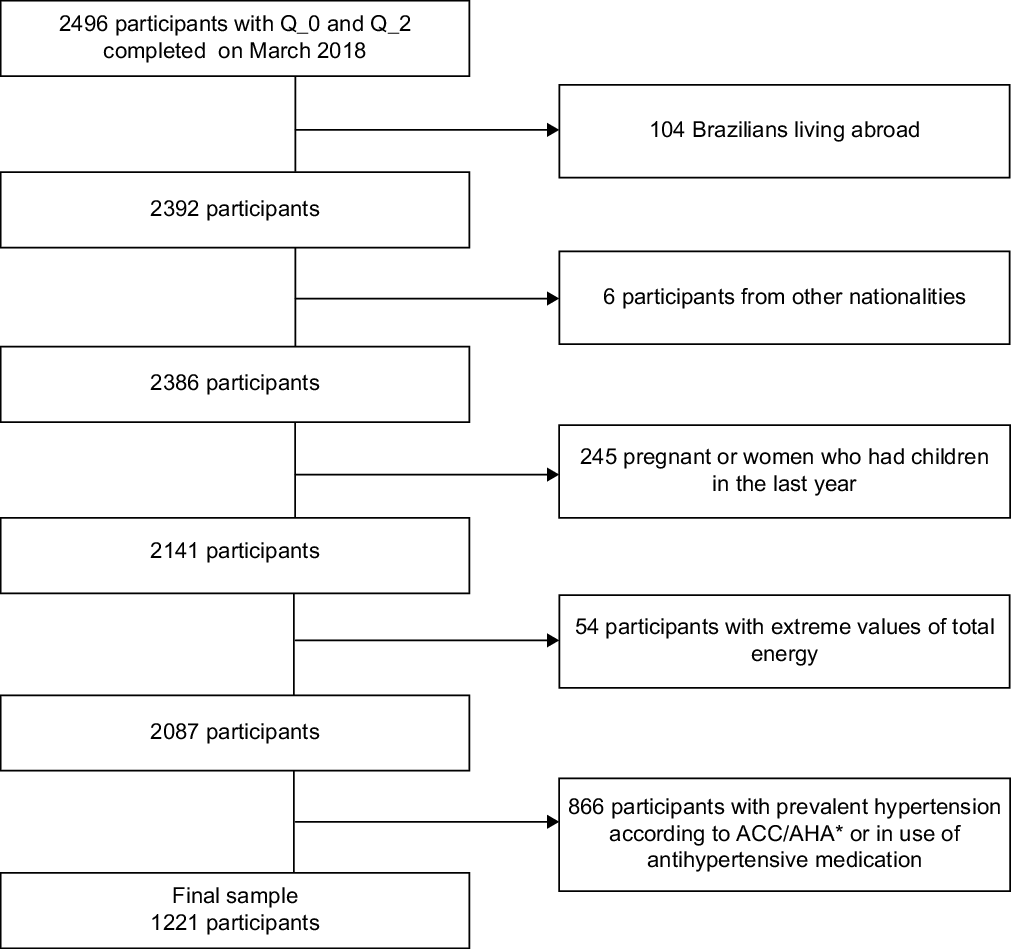
Fig. 1 Participant inclusion flow chart in the Cohort of Universities of Minas Gerais (CUME) Study, Minas Gerais, Brazil, 2016–2018
Outcome variable: incidence of hypertension
In the baseline and follow-up questionnaires, the participants provided information on medical diagnosis of hypertension, recent blood pressure values and antihypertensive medication use.
The incidence of hypertension was defined when disease-free participants at baseline were classified as hypertensive during the follow-up evaluation.
In this study, the criteria used for the definition of hypertension were the recent cut-off points proposed by ACC/AHA (BP ≥ 130/80 mmHg)(Reference Whelton, Carey and Aronow6). In addition, participants who reported a medical diagnosis of the disease and those using antihypertensive medication were also considered hypertensive.
The self-reported SBP, DBP values and medical diagnosis of hypertension were validated in a specific study with a subsample of 172 participants from the CUME project, showing moderate to substantial agreement with values directly measured (intraclass correlation coefficient (ICC) = 0·67 for SBP, ICC = 0·49 for DBP and kappa value = 0·56 for the diagnosis of hypertension)(Reference Miranda, Ferreira and Oliveira18).
Exposure variables: food consumption according to degree of processing
Information on food intake was taken from the FFQ. A list of items composing the food groups was presented at the beginning of each page, and the participants were supposed to select those they had consumed in the previous year. After selecting a given food, the participants were supposed to report the size of the portions consumed, expressed in household measures commonly used in Brazil (teaspoon, tablespoon, ladle, knife tip, pasta picker, saucer, cup or glass) or traditional portions of food (units, slices or pieces) and the frequency of consumption (daily, weekly, monthly or annually). Images of the food items and utensils were provided to help the respondents to estimate the portions’ size.
Thus, the intake frequencies (weekly, monthly, annually) of each food were transformed into daily consumption. Subsequently, daily food intake (g or ml) was calculated by multiplying the serving size by frequency of consumption. To calculate energetic (kJ) and nutrients intake, the Brazilian tables of nutritional composition(Reference Rodriguez-Amaya, Kimura and Amaya-Farfán19,20) were used and, when necessary, the United States Department of Agriculture food composition table(21).
The food items were classified into groups according to the NOVA classification(Reference Monteiro, Cannon and Moubarac22) based on the degree of industrial processing: (1) U/MPF&CP; (2) processed food; (3) UPF (see online supplementary material, Supplementary Table 1).
In this study, the group of unprocessed/minimally processed foods was clustered with the group of culinary preparations because culinary preparations are not meant to be consumed by themselves and are normally used in combination with unprocessed/minimally processed foods to make freshly prepared drinks, dishes and meals(Reference Monteiro, Cannon and Moubarac22).
The percentage contribution of daily energetic intake (%/d) of each group according to the degree of food processing was obtained by adding the energies of each food group and dividing the result by total energy intake. The values were divided into quintiles, and the lowest quintile was used as a reference for data analysis.
Total energy and nutrient values calculated from the self-reported FFQ data were validated in a specific study with a subsample of 146 CUME project participants, showing moderate agreement with the values measured directly from the 24-h recalls by telephone (overall ICC = 0·44; ICC = 0·36 for U/MPF&CP; ICC = 0·54 for processed foods; ICC = 0·60 for UPF). In this same study, the reproducibility of self-reported FFQ also was evaluated, with the participants answer this questionnaire twice in an interval of 1 year. There was a good agreement between the two assessment of the dietary intake of our participants (overall ICC = 0·76; ICC = 0·76 for U/MPF&CP; ICC = 0·82 for processed foods; ICC = 0·82 for UPF) (unpublished results).
Covariables
The covariates were obtained from the baseline questionnaire, and they included sociodemographic characteristics (sex, age, skin colour, marital status, family income and number of individuals living in the same home), health history (personal and family), medication use, anthropometric measurements (weight and height) and lifestyle (smoking, alcohol consumption and physical activity).
The per capita income was calculated by dividing family income by the number of individuals living in the same home. Finally, we converted the result in the current value of American Dollar (US$) in 2 April 2020 respect to Real (R$ 5·27, the official currency in Brazil).
The self-declared values of weight, height and body mass index (BMI) – BMI (weight (kg)/height (m2))(23) – were validated in a specific study with a subsample of 172 CUME project participants. The ICC values were: 0·99 (weight), 0·99 (height) and 0·98 (BMI)(Reference Miranda, Ferreira and Oliveira18).
BMI was categorised according to the values recommended by the WHO for the definition of obesity (BMI ≥ 30 kg/m2) in adults(23).
Physical activity was assessed using a list of twenty-four leisure activities and was expressed in min/week(Reference Farinatti24). Individuals who have ≥150 min/week of moderate intensity activity or ≥75 min/week of vigorous intensity activity or ≥150 min/week of vigorous and moderate intensity activity were considered active. Physical inactivity was defined as the absence of leisure-time physical activity(25).
Statistical analysis
The characteristics of the participants were expressed as absolute and relative frequencies for categorical variables and means and standard deviations for continuous variables, according to the diagnosis of hypertension. Statistical differences were assessed using Pearson’s χ 2 test (categorical variables) or Student’s t test (continuous variables).
Poisson regression models with robust variances were designed to assess the association between the exposure variables and the incidence of hypertension, adjusted for potential confounders. The first model was adjusted for sex and age (model 1), while the second was additionally adjusted for marital status, skin colour, per capita income, physical activity, smoking, obesity, family history of hypertension, alcohol consumption, previous medical diagnosis of type 2 diabetes, hypercholesterolaemia and hypertriglyceridaemia (model 2). A third model was fitted to analyse the association of consumption of processed foods and UPF with hypertension, excluding alcohol intake of the % of energies of processed foods and UPF, and keeping it as an adjustment (model 3).
Thus, the strength of the associations was estimated by relative risks (RR) and their respective 95 % CI.
In addition, linear trend tests were conducted using the median of each quintile of the percentage contribution of energetic intake of each food group by degree of processing as a continuous variable in their respective multivariate Poisson regression models.
All data analysis was performed using Stata/se version 13.1 statistical software (StataCorp) at a 5 % significance level.
Results
During the 2-year follow-up (2016–2018), 370 new cases of hypertension (152/1000 person-years; n 113, 193/1000 person-years in males and n 257, 138/1000 person-years in females) were identified.
Daily energetic percentage from each group according to degree of processing was: (1) 64·3 (sd 12) % for U/MPF&CP; (2) 9·9 (sd 5·8) % for processed foods; and (3) 25·8 (sd 11) % for UPF (Table 1).
Table 1 Baseline characteristics of participants according to incidence of hypertension, Cohort of Universities of Minas Gerais (CUME) study, 2019 (n 1221)
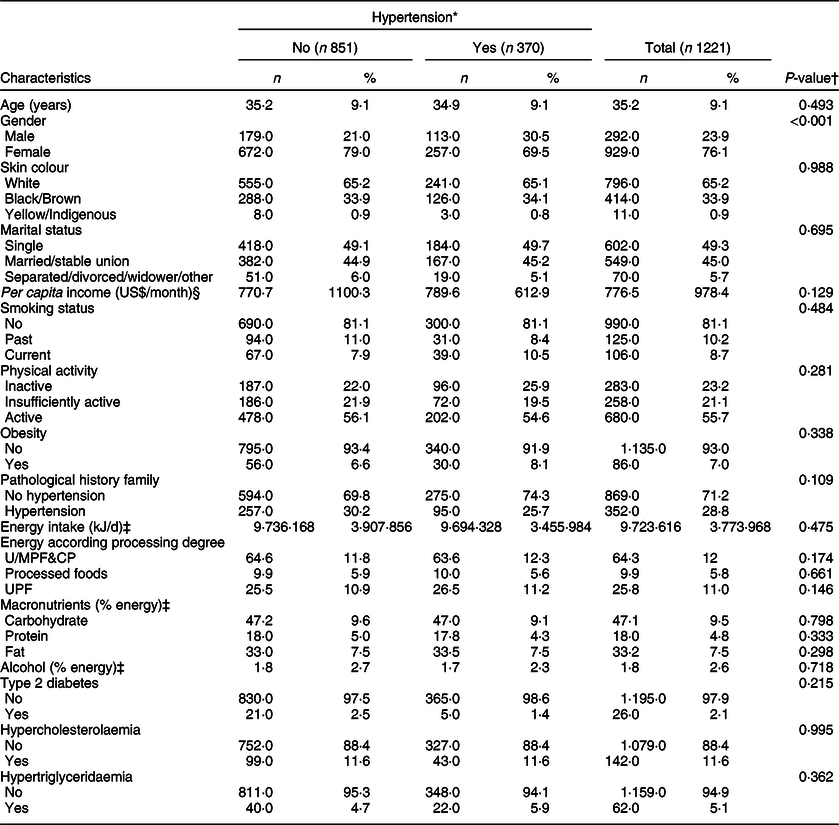
U/MPF&CP, unprocessed/minimally processed foods and culinary preparations; UPF, ultra-processed foods.
* Hypertension was defined according to American College of Cardiology/American Heart Association (ACC/AHA) criteria.
† P values according to trend χ 2 test (categorical variables) or Student’s t test (continuous variables) when appropriate.
‡ Data are mean and sd or absolute frequency and relative frequency in %.
§ Per capita income: 1 US$ (Dollar) = 5·27 R$ (Real – official currency in Brazil) in 2 April 2020.
Participants were more likely to be female, white, single, physically active and carbohydrate consumers. They also presented the following characteristics: 8·7 % of them were current smokers, 7 % had obesity, 28·8 % had a family history of hypertension, 2·1 % had type 2 diabetes, 11·6 % had hypercholesterolaemia and 5·1 % had hypertriglyceridaemia. Age, per capita income and energy intake averages were, respectively, 35·2 years, US$ 776 and 9·723·616 kJ/d. The macronutrients and alcohol contribution related to the total energetic intake were: 47·1 % from carbohydrate, 18·0 % from protein, 33·2 % from lipid and 1·8 % from alcohol (Table 1).
Characteristics of participants according to quintiles of energetic consumption of each food group were presented in see online supplementary material, Supplementary Tables 2 through 4.
In the multivariate analysis, participants in the upper quintile of daily energetic intake of U/MPF&CP presented a reduced risk of hypertension (RR: 0·72; 95 % CI 0·52, 0·98), regardless of sex, age, marital status, skin colour, per capita income, physical activity, smoking, alcohol consumption, obesity, family history of hypertension, previous medical diagnosis of type 2 diabetes, hypercholesterolaemia and hypertriglyceridaemia. On the other hand, participants in the upper quintile of daily energetic intake of UPF presented an increased risk of hypertension (RR: 1·35; 95 % CI 1·01, 1·81) (model 2, Table 2).
Table 2 Relative risk (RR) and 95 % CI for incidence of hypertension by energetic contribution of food consumption according to industrial processing degree (n 1·221). Cohort of Universities of Minas Gerais (CUME) study, 2019*, †, ‡, §
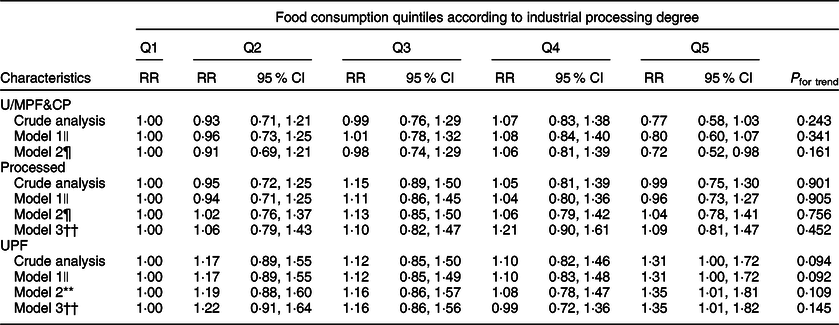
U/MPF&CP, unprocessed/minimally processed foods and culinary preparations; UPF, ultra-processed foods.
* Q1, first quintile; Q2, second quintile; Q3, third quintile; Q4, fourth quintile; Q5, fifth quintile.
† Lowest quintile was used as reference.
‡ Hypertension was defined according to American College of Cardiology/American Heart Association (ACC/AHA) criteria.
§ Energy consumption of unprocessed/minimally processed foods (Q1: 15·9–47·1%; Q2: 47·1–54·1%; Q3: 54·2–60·7%; Q4: 60·8–68·0%; Q5: 68·1–92·3 %); Energy consumption of culinary ingredients (Q1: 0–2·5%; Q2: 2·5–4·3%; Q3: 4·3–6·5%; Q4: 6·5–9·9%; Q5: 9·9–40·1%); Energy consumption of processed foods (Q1: 0–4·8%; Q2: 4·8–7·7%; Q3: 7·7–10·6%; Q4: 10·6–14·6%; Q5: 14·6–39·1%). Energy consumption of UPF (Q1: 0·8–16·6%; Q2: 16·6–22·3%; Q3: 22·3–27·3%; Q4: 27·3–34·6; Q5: 34·6–76·2%). Data are expressed as RR and 95 % CI.
|| Adjusted by gender and age.
¶ Adjusted by gender, age, marital status, skin colour, per capita income, physical activity, smoking, obesity, family history of hypertension, alcohol consumption and previous diagnosis of type 2 diabetes, hypercholesterolemia and hypertriglyceridemia.
** Adjusted by all potential confounding factor, except alcohol consumption.
†† Adjusted by all potential confounding factor, excluding alcohol consumption of the % of energies of processed food and UPF.
Finally, when we excluded alcohol intake of the % of energies of UPF, the highest consumption of this food group remained independently associated with increasing incidence of hypertension (RR: 1·35; 95 % CI 1·01, 1·82) (model 3, Table 2).
Discussion
In this prospective study, the highest percentage of daily energetic intake of U/MPF&CP was independently associated with a decreased risk of developing hypertension. On the other hand, the highest consumption of UPF was related to an increased risk of this disease, adjusted for potential confounders.
Our results support the consistency in the relationship between the consumption of foods considered healthy and the lower risk for developing hypertension, since the highest percentage of daily energetic intake of U/MPF&CP was independently associated with the lower incidence of the disease. Moreover, this finding corroborates with results from studies that evaluated the consumption of specific groups of unprocessed/minimally processed foods and the risk of developing hypertension(Reference Wu, Sun and He26,Reference Li, Li and Wang27) , providing evidence of the benefits of increased and long-term ingestion of these foods.
The association between the consumption of U/MPF&CP and hypertension involves different mechanisms. Foods in this group grant a larger supply of macro and micronutrients that provide higher quality and lower energy density to the diet(Reference Shay, Stamler and Dyer28).
Fruits and vegetables are sources of micronutrients, such as K, P, Mg, Fe, folic acid, vitamin C, B-complex vitamins, folacin and riboflavin, associated with blood pressure reduction(Reference Li, Li and Wang27,Reference Tzoulaki, Patel and Okamura29–Reference Aburto, Hanson and Gutierrez31) . Such foods also increase fibre intake in the diet(Reference Whelton, Hyre and Pedersen32) and are rich in antioxidants and anti-inflammatory substances which have a protective role in chronic diseases(Reference Borgi, Murakiet and Satija33–Reference Silveira, Oliveira and Andrade35).
It is known that polyphenols such as flavonoids (found in some fruits, vegetables, tea, wine and cocoa) and anthocyanins (found in red fruits and vegetables such as açai, grapes, apples, strawberries, cherries, acerola and red cabbage) are beneficial to health, although its evidence is not conclusive(Reference Godos, Vitale and Micek36–Reference Vendrame and Klimis-Zacas38).
Furthermore, vegetable consumption is often associated with the use of olive oil. This typical culinary ingredient is a source of MUFA. Olive oil also has antihypertensive, anti-thrombotic, antioxidant, anti-inflammatory and anti-carcinogen effects. Its cardioprotective effect and its association with increased in longevity have been reported as well(Reference Carlos, De La Fuente-Arrillaga and Bes-Rastrollo34,Reference Buckland and Gonzalez39) .
Weight management is another factor that may help explain the association between the highest percentage of daily consumption of U/MPF&CP and hypertension. After a 40-year follow-up, the Nurses’ Health Studies showed that a diet rich in fruits, vegetables, whole grains, nuts and white meat was related to lower weight gain(Reference Hruby, Manson and Qi40).
Despite the fact that each food or group of similar food has their beneficial effects, we underline the relevant role of adopting healthy eating patterns such as the Nordic(Reference Ndanuko, Tapsell and Charlton41), DASH(Reference Van Horn, Carson and Appel42,Reference Schwingshackl, Bogensberger and Hoffmann43) , Mediterranean(Reference Mendonça, Lopes and Pimenta14,Reference Carlos, De La Fuente-Arrillaga and Bes-Rastrollo34,Reference Nissensohn, Román-Viñas and Sánchez-Villegas44) and Vegetarian ones(Reference Chuang, Chiu and Lee45,Reference Yokoyama, Nishimura and Barnardet46) . All these dietary patterns combine several U/MPF&CP, which is paramount to decrease the risk of developing hypertension and CVD.
Our results are also consistent with the ones of a Spanish cohort in which an association between higher consumption of UPF and hypertension was found after 9·1-year follow-up(Reference Mendonça, Lopes and Pimenta14). Additionally, our results reinforce findings from systematic reviews and previous meta-analyses(Reference Tzoulaki, Patel and Okamura29,Reference Schwingshackl, Schwedhelm and Hoffmann47–Reference Zhang and Zhang50) on the association between unhealthy food consumption and risk of hypertension.
Such studies show that a higher consumption of foods not only rich in simple carbohydrates, saturated and trans fats, and Na, as UPF(Reference Monteiro, Cannon and Moubarac22) but also a high consumption of alcohol(Reference Tzoulaki, Patel and Okamura29,Reference Xi, Huang and Reilly48,Reference Jayalath, de Souza and Ha49) , red and processed meat(Reference Schwingshackl, Schwedhelm and Hoffmann47,Reference Zhang and Zhang50) , and sugar-sweetened beverages(Reference Schwingshackl, Schwedhelm and Hoffmann47–Reference Zhang and Zhang50) have been associated with the occurrence of hypertension. Moreover, the consumption of UPF is associated with low intake of protein, fibre, vitamin and minerals(Reference Louzada, Ricardo and Steele51), which may favour the development of hypertension as well.
Sodium is one of the main ingredients added in the process of producing ready-to-eat food such as instant noodles, microwave popcorn, powdered soups, chips and processed meat(Reference Mendonça, Lopes and Pimenta14,Reference Monteiro, Cannon and Moubarac22,Reference Louzada, Ricardo and Steele51) , and it is well established that avoiding excessive sodium consumption is crucial to prevent hypertension and to reduce cardiovascular risk(Reference Gay, Rao and Vaccarino52,Reference Oparil, Acelajado and Bakris53) .
Regarding saturated and trans-fat, the consumption of food rich in these nutrients, it is not advisable as they are known for increasing cardiovascular risk. A systematic review of studies showed that replacing saturated fat for unsaturated fat is related to a decrease of this risk(Reference Hooper, Martin and Abdelhamid54). UPF consumption is also associated with the highest intake of added sugar, total and saturated fat, lower protein, and dietary fibre intake(Reference Marrón-Ponce, Flores and Cediel55).
Furthermore, in a study conducted with Spanish adults(Reference Mendonça, Pimenta and Geaet12), UPF consumption was associated with weight gain. It is well known that increased consumption of food with high-energy density, high saturated fat, notably trans-fat, refined grains, added sugar, as well as excessive consumption of alcohol, sweetened beverages drinks or industrialised fruit juice is related to weight gaining(Reference Hruby, Manson and Qi40,Reference Suliga, Koziel and Cieśla56–Reference González-Muniesa, Mártinez-González and Hu59) which is one of the most important risk factor to hypertension(Reference Whelton, Carey and Aronow6,Reference James, Oparil and Carter60) . The association between UPF and weight gain was also verified in a recent randomised clinical trial(Reference Hall, Ayuketah and Brychta61).
Our study has important strengths. First, its prospective design, its relatively large sample size and high level of education of the participants that enable them to understand better the online questionnaire, and hence providing an increase of the internal validation of our results.
Moreover, we adopted the NOVA classification which allows the grouping of foods according to the extent and purpose of industrial processing(Reference Monteiro, Cannon and Moubarac22), contrary to classifications based on similarity in nutritional composition(Reference Suliga, Koziel and Cieśla56,Reference Noel, Newby and Ordovas62) , whose method may favour the occurrence of U/MPF&CP and UPF to the same group(Reference Monteiro, Cannon and Moubarac22).
In addition, to our knowledge, it is the first epidemiological study to evaluate the association between all degrees of food processing proposed by NOVA classification and the risk of hypertension. Thus, our findings both highlight the importance of promoting and strengthening healthy and sustainable eating habits and show the risk associated with the consumption of unhealthy foods. Therefore, they are consistent not only with the Dietary Guidelines for the Brazilian population(63), which encourages regular consumption of U/MPF&CP and restriction of UPF, but also with the WHO recommendations for a healthy diet(Reference Te Morenga, Howatson and Jones64).
Moreover, our FFQ had a good reproducibility (overall ICC = 0·76), demonstrating that the dietary intake of our participants was constant even after 1 year (unpublished results). Therefore, we believe that they did not change substantially their dietary intake over time.
Some limitations should be considered when interpreting our results. The hypertension was defined according to self-reported data, yet its diagnosis was properly validated(Reference Miranda, Ferreira and Oliveira18). Furthermore, food consumption was also self-reported in a FFQ of 144 food items. Even though this questionnaire was previously validated (unpublished results), we cannot disregard the possibility of food misclassification, considering the scarcity of details as it was not designed to collect data considering this new classification of foods.
Additionally, we need to consider that in the validation study of FFQ used in the CUME project, ICC for U/MPF&CP group was low (0·36), yet close to the value considered acceptable (0·40)(Reference Nusser, Fuller, Lyberg, Biemer and Collins65). Finally, we must assume that our sample may not be representative of all alumni of the universities included in this study. However, generalisation of results in epidemiology should be based on biological mechanisms rather than on statistical representativeness(Reference Rothman, Gallacher and Hatch66).
Conclusion
In this prospective cohort of Brazilian middle-aged adult university graduates, the highest consumption of U/MPF&CP was associated with a reduced risk of hypertension, whereas such risk was increased with the highest consumption of UPF. We acknowledge that additional longitudinal studies are needed to confirm our results.
Acknowledgements
Acknowledgements: The authors thank the volunteers participating in the CUME study, and all members of the CUME project. Financial support: This research was funded by FAPEMIG (Minas Gerais, Brazil), grant numbers (CDS-APQ-00571/13, CDS-APQ-02407/16, CDS-APQ-00424/17). A.C.S.L., H.H.M.H. and J.B. are research productivity fellows of CNPq (Ministry of Science and Technology, Brazil). Conflict of interest: None. Authorship: K.R.-A. was responsible for project design, data analysis, results interpretation and drafted the initial and subsequent versions of the manuscript; H.H.M.H. and J.B. were responsible for project design and reviewed the paper; A.E.S.M. participated in the data analysis and article review; A.C.S.L. initiated the idea of the paper and reviewed it; A.M.P. was responsible for project design, data collection and analysis, results interpretation, review and writing of the article. Ethics of human subject participation: ‘This study was conducted according to the guidelines laid down in the Declaration of Helsinki, and all procedures involving study participants were approved by the Research Ethics Committee of the Federal University of Minas Gerais (CAAE – 44 483 415.5.1001.5149). Online informed consent was obtained from all subjects.’
Supplementary material
For supplementary material accompanying this paper visit https://doi.org/10.1017/S1368980020002074


