


Iodine is an essential dietary element, required for the thyroid gland to synthesize thyroxine by iodination of tyrosine. Iodine is present in soil to a variable degree and so is found in low amounts in many foods. Dairy products and seafood are rich sources and supply most human iodine intake( Reference Haldimann, Alt and Blanc 1 ). If dietary iodine is insufficient to produce enough thyroxine, blood thyroid-stimulating hormone (TSH) rises and the thyroid gland enlarges (‘goitre’) to compensate. If blood thyroxine and its active derivative triiodothyronine fall, many organs fail to function optimally and classical symptoms of hypothyroidism develop. The impacts of hypothyroidism on pregnancy include spontaneous abortion, stillbirth, perinatal death and stunted growth( Reference Fisher, Tran and Biggs 2 ).
Depending on severity, iodine deficiency in pregnancy can cause miscarriage and ultimately infertility. It can cause neonatal hypothyroidism( Reference Kochupillai, Pandav and Godbole 3 ), growth failure( Reference Blazer, Moreh-Waterman and Miller-Lotan 4 ), neonatal goitre and neurological impediment( Reference Pop, Brouwers and Vader 5 , Reference Haddow, Palomaki and Allan 6 ). Iodine is critical for the maturation of the central nervous system, particularly for myelination. Brain damage increases with the degree of iodine deficiency, the severest consequence being overt cretinism with severe mental retardation, deaf-mutism, stunting, impaired gait and motor function( Reference Delange 7 ). In areas of iodine deficiency cretinism may be uncommon but milder degrees of neurological damage can affect a substantial number, and iodine supplementation improves cognition-deficient children( Reference Patel, Landers and Li 8 , Reference Melse-Boonstra, Gowachirapant and Jaiswal 9 ). Dietary iodine insufficiency is common in India, with an estimated total of 71 million affected( Reference Chakrabarty 10 , Reference Kochupillai and Mehta 11 ). Consumption of few dairy products or seafood and large amounts of goitrogen-containing foods may compound this issue( Reference Lightowler and Davies 12 ). Moreover, the Indian soil may be more iodine deficient because of high rainfall and flooding, leading to mineral depletion( Reference Kapil 13 ). Iodine deficiency disorders have been tackled in India via the National Iodine Deficiency Disorders Control Programme (NIDDCP)( Reference Kochupillai and Mehta 11 , Reference Kumar 14 ) but iodine status has seldom been considered in Indian pregnancies( Reference Menon, Skeaff and Thomson 15 , Reference Kapil, Saxena and Ramachandran 16 ), with studies focusing on defining iodine deficiency in sub-populations( Reference Chakraborty, Chatterjee and Bhadra 17 – Reference Mazumdar, Jaiswal and Chatterjee 19 ). Nevertheless, and despite the effort of the NIDDCP, iodine deficiency remains an issue in some regions( Reference Rendina, De Filippo and Mossetti 20 , Reference Ayturk, Gursoy and Kut 21 ). The prevalence of iodine deficiency may have been overstated, however, due to misunderstanding of the terminology used in the WHO statement( Reference Kapil 22 ).
While iodized salt is available in India, with some states having even banned the use of non-iodized salt, salt iodization (as well as its impact) is still unreliable, in part due to access( Reference Kapil 22 – Reference Kapil 24 ). Indeed, the National Family Health Survey (NFHS-3) 2005–2006 revealed that only 51 % of households in India consume iodized salt( 25 ). Furthermore, general health recommendations are to avoid adding salt to foods. Adequately iodized salt contains ≥15 ppm but according to a recent Indian study, only 17 % of household edible salt samples contained the stipulated iodine content of ≥15 ppm when measured by a titration method( Reference Bulliyya, Dwibedi and Mallick 26 ).
There is substantial iodine storage as iodo-tyrosines in the thyroid, so consumption is not required daily. Iodine supplementation or food fortification can normalize TSH( Reference Moleti, Di Bella and Giorgianni 27 ), reduce endemic goitre and normalize thyroid metabolism( Reference Sooch, Deo and Karmarka 28 , Reference Kochupil, Karmarka and Weightma 29 ). Individual dietary requirements vary: non-pregnant adults have a mean requirement of 95 μg/d( Reference Zimmermann 30 ). Goitre, indicating severe deficiency, is found with iodine intakes below 50 μg/d( Reference Pettigrew-Porter, Skeaff and Gray 31 ). WHO guidelines classify the severity of iodine deficiency in populations according to median urinary iodine concentration (UIC), with 100 μg/l being the lower limit of acceptability for non-pregnant adults( 32 ). During pregnancy and lactation, iodine requirements are increased. Although thyroxine is usually converted in tissues to the more active triiodothyronine, thyroxine itself is required by the developing brain throughout pregnancy( Reference Patel, Landers and Li 8 ). In the first trimester, partial transfer of thyroxine through the placenta to the fetus is essential for fetal neurological development. Later, the fetal thyroid develops sufficiently to produce its own thyroxine, for which extra maternal iodine is still required( Reference Mian, Vitaliano and Pozza 33 ). Dietary requirement may be increased by increased renal clearance in pregnancy and lactation( Reference Delange 34 ) and dietary iodine intake during pregnancy and lactation have recently been revised by WHO and the International Council for the Control of Iodine Deficiency Disorders to 250 μg/d( 32 ). Dietary iodine intake is difficult to measure and urinary iodine is used as the preferred marker for population iodine status (as approximately 90 % of the iodine ingested is excreted), with a lower limit of 150 μg/l as a threshold for sufficiency for the pregnant population( 32 ) (Table 1).
Table 1 Epidemiological criteria for assessing iodine status of the pregnant population based on the median UIC
UIC, urinary iodine concentration.
†The term ‘excessive’ means in excess of the amount required to prevent and control iodine deficiency – not necessarily a damaging excess.
The present study investigated the iodine status of a pregnant Indian population, at different stages of pregnancy, living in both rural and urban settings in the Maharashtra region and the potential for low/marginal maternal iodine status to subtly impair fetal growth and development, without frank hypothyroidism. This may be important because small-for-dates (included in low-birth-weight) babies are more likely to develop hypertension, diabetes and related ‘metabolic syndrome’ disorders in adult life( Reference Barker, Eriksson and Forsen 35 ). Indian women tend to have small babies( Reference Fall, Stein and Kumaran 36 , Reference Margetts, Yusof and Al Dallal 37 ) and Indians are particularly prone to metabolic syndrome( Reference Fall, Stein and Kumaran 36 , Reference Misra, Chowbey and Makkar 38 ), which has an association with subclinical hypothyroidism( Reference Shantha, Kumar and Jeyachandran 39 ) and multinodular goitre in regions with iodine deficiency( Reference Rendina, De Filippo and Mossetti 20 , Reference Ayturk, Gursoy and Kut 21 ).
Materials and methods
Study design
The design of the present study was longitudinal, with follow-up of mothers during pregnancy and follow-up of their infants from birth to 24 months of age, and was part of a larger study funded by the International Atomic Energy Agency on determinants of subsequent metabolic syndrome( Reference Katre, Bhat and Lubree 40 ). We recruited 234 healthy pregnant women who agreed to participate during May 2004 to July 2006 – 118 pregnant women from a rural primary health-care centre at Vadu (∼50 km from Pune city) and 116 pregnant women from the antenatal clinic of King Edward Memorial Hospital, Pune – at routine first-trimester clinics. Pregnant women were recruited unselected, sequentially, as they attended antenatal clinics. Women with multiple gestations, congenital anomaly of the fetus or a risk factor such as previous Caesarean section, fetal death or neonatal death, pre-eclampsia, hypothyroidism or a chronic medical condition (diabetes, hypertension, infective illness, etc.) were excluded. Ethical permission for the study was obtained from King Edward Memorial Hospital Research Centre's ethics committee and all women provided written consent.
Dietary assessment
A trained nutritionist assessed maternal diet at 17 and 34 weeks of pregnancy using a semi-quantitative FFQ, based on local practices and validated for the Indian population( Reference Rao, Yajnik and Kanade 41 ), to obtain the consumption frequency of common food items. Iodine-rich foods (milk, milk products, seafood and eggs) were identified using Indian food composition tables( 42 ). Milk was either cow's or buffalo's milk. Milk products included ghee, butter, curds and cheese (although cheese is very rarely consumed). Seafood included all types of fish and dry fish. For each food group, daily, weekly or monthly frequency of consumption of individual foods was recalled since the participant's previous visit. This frequency was summed to give a composite score of frequency of consumption per month. Frequent consumption was defined as equal to or greater than twice weekly. Although data were collected for most of the iodine-rich food items, the use of iodized salt was not recorded. Data were not available for use of iodine-fortified products.
Maternal measurements
Demographic data including Standard of Living Index (SLI)( 25 ), location (urban or rural) and educational level (in years) were collected at 17 weeks. Gestation was confirmed by ultrasound measurement at all appointments. Standard anthropometric measurements were conducted and bioimpedance measurements were made using a MultiScan 5000 device (Bodystat Ltd, Isle of Man, UK) following standard procedures( Reference Bhat, Thuse and Lubree 43 ).
At each visit, a fasting blood sample was collected from the antecubital vein of each woman, who was in the sitting position, into an EDTA tube. Haematological measurements were carried out as reported previously( Reference Katre, Bhat and Lubree 40 , Reference Rao, Yajnik and Kanade 41 , Reference Bhat, Thuse and Lubree 43 ).
Fresh fasting urine samples were obtained from 166 of the 234 participants at 17, 28 and 34 weeks of pregnancy (132, thirty-one and 151 urine samples, respectively); the samples were collected into sterile containers, sealed and frozen at −70°C until analysis. Specifically, samples at both 17 and 34 weeks were collected for 117 participants. The urine samples collected at 28 weeks are not described here and included only for adjustment purposes (see Statistical methods below). No dip-stick testing was performed, as it has been shown to affect iodine measurements( Reference Chanoine, Bourdoux and Thi 44 ). UIC was measured using the simple microplate method (Bioclone Urinary Iodine Assay Kit UIA0192, with Urinary Iodine Controls UIAC6; Bioclone Australia Pty Limited, Marrickville, Australia) based on the Sandell–Kolthoff reaction using a Victor™ system reader (PerkinElmer, Turku, Finland). The CV as quoted by the manufacturer was 9·2 % for low values and <6 % for medium and high values, both inter- and intra-batches. Samples were analysed in duplicate and iodine concentrations were calculated with reference to external standards.
Neonatal measurements
Detailed neonatal anthropometry was conducted at birth. Birth weight (to the nearest 0·001 kg; ATCO Pvt. Ltd, Mumbai, India), length (to the nearest 0·1 cm, using a Pedobaby Babymeter; ETS J.M.B., Brussels, Belgium) and skinfolds (to the nearest 2 mm using a Harpenden skin calliper; Chasmors Ltd, London, UK) were measured immediately following birth. Follow-up anthropometry and data on breast-feeding were collected at 3, 6, 12 and 24 months. Anthropometric measurements were recorded in duplicate by trained observers, using standardized methods. The CV between the observers for different measurements was 2 %.
Cord blood was collected at birth from the placental end of the cord. The blood was centrifuged at 2500 g for 15 min at 4°C within 1 h of collection and plasma was stored at –70°C until further analysis. Cord plasma glucose and insulin were analysed as per the protocol used for maternal measurements. Data on the Social Interaction Score of each baby were collected at 24 months, as previously described( Reference Bhate, Joshi and Ladkat 45 ).
Statistical methods
Data are presented as mean and standard deviation or median as appropriate for continuous variables, or count and frequencies for discrete variables. Normality of continuous data was tested with the Shapiro–Wilk test. UIC data at 17 and 34 weeks were skewed, and median UIC values are reported for comparison against WHO criteria (Table 1).
Repeat UIC samples, available for 122 out of 166 participants (two samples for ninety-six women, three samples for twenty-six women), were used to generate adjusted distributions accounting for day-to-day (within-person) variation( Reference Zimmermann and Andersson 46 ) following the detailed National Research Council approach( 47 ) as used by Mackerras et al.( Reference Mackerras, Singh and Eastman 48 ) (with the caveat that these samples were collected in pregnancy at different gestational stages). This enabled the use of (adjusted) UIC quartiles to group cases to investigate impact on maternal and neonatal characteristics.
Comparisons between the lowest and highest quartiles (defined using the adjusted distributions) were made using Student's t test and the χ 2 test. Multivariate linear regression was carried out with UIC (17 and 34 weeks, quartiles based on adjusted distributions) and maternal characteristics (maternal age, location, socio-economic status (SLI score), educational level, parity) and (for infant outcomes only) offspring gender, gestational age and feeding mode as predictors. Neonatal and maternal parameters which differed significantly between the lowest and highest UIC quartiles at 17 and 34 weeks (t test, threshold P < 0·1) were selected as outcome measures. Predictors were removed sequentially from the model according to lack of contribution.
Since the study was hypothesis-generating, P < 0·05 was taken to indicate statistical significance, without adjustment for multiple correlations. Analyses used the statistical software package SPSS version 18·0.
Results
The median UIC values of women at 17 and 34 weeks of pregnency were 203 and 211 μg/l, respectively. Individual values ranged from 26 to 800 μl/l. Distributions of crude (unadjusted) UIC at both 17 and 34 weeks are shown in Fig 1, along with the corrected distribution obtained by applying the National Research Council method. There was no correlation between the two urinary iodine measurements, either adjusted (P = 0·681) or not (P = 0·546), indicating that UIC varied within individuals substantially through pregnancy. However, 24 % of the women who had UIC in the lowest quartile at 17 weeks had a follow-up measurement in this same lowest quartile at 34 weeks. Meanwhile, 34 % of the women who had UIC in the highest quartile at 17 weeks had a follow-up measurement in this same highest quartile at 34 weeks.
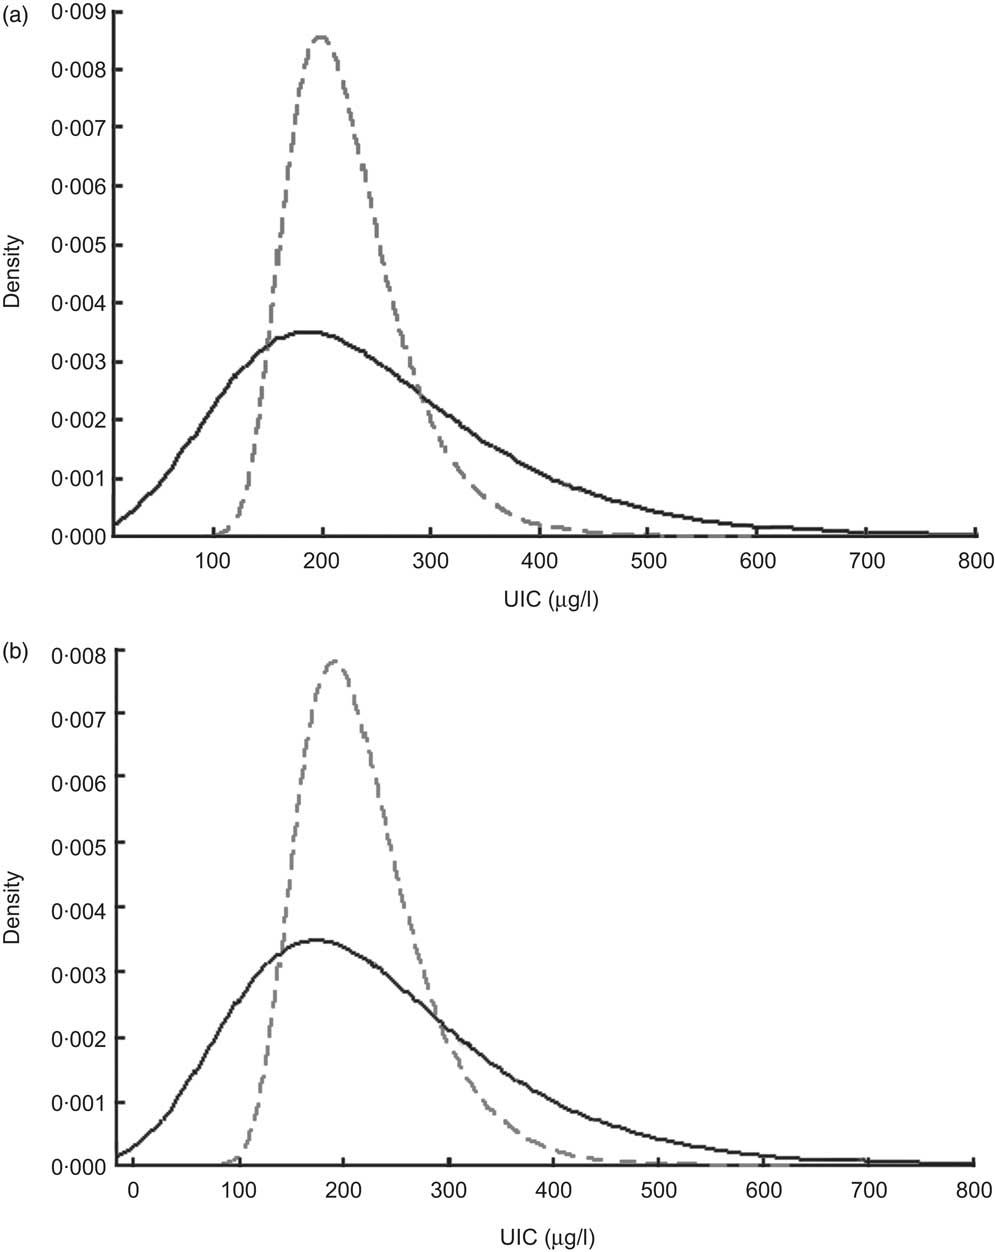
Fig. 1 Distributions of urinary iodine concentration (UIC) among women at (a) 17 weeks of pregnancy and (b) 34 weeks of pregnancy (Maharashtra, India, 2004–2006):
 $$$$
, crude UIC;
$$$$
, crude UIC;
 $$$$
, UIC corrected for within-person variation
$$$$
, UIC corrected for within-person variation
Maternal characteristics and measurements
Maternal characteristics at 17 and 34 weeks of pregnancy are shown in Tables 2 and 3. There was no difference in maternal age, location or parity between the lowest and highest UIC quartiles at either 17 or 34 weeks. However, educational status and socio-economic status (SLI score) were significantly higher for those in the highest UIC quartile at 34 weeks (P < 0·05).
Table 2 Characteristics of mothers at 17 and 34 weeks of pregnancy (Maharashtra, India, 2004–2006)
SLI, Standard of Living Index (indicates socio-economic status); UIC, urinary iodine concentration.
†Frequently consumed = more than twice weekly.
Table 3 Maternal characteristics at 17 and 34 weeks according to adjusted urinary iodine status (Maharashtra, India, 2004–2006)

UIC, urinary iodine concentration; SLI, Standard of Living Index (score indicates socio-economic status).
Mean values were significantly different from those in the lowest quartile within the same gestation time: *P < 0·05.
Maternal measurements carried out during pregnancy (fasting insulin levels, insulin resistance by homeostatic model assessment, fat mass (bioelectrical impedance analysis), vitamin B12 and haematological measures) did not differ between the lowest and highest quartiles at either 17 or 34 weeks, except for mean corpuscular Hb concentration being higher for those with UIC in the lowest quartile at 34 weeks (P = 0·021).
Diet and urinary iodine concentration
The consumption of milk products was significantly higher for women with UIC in the highest quartile at week 34 (P = 0·002, Table 4). No other nutritional parameters differed between women in the lowest and highest UIC quartiles.
Table 4 Average consumption frequency of foods per month during pregnancy, at 17 and 34 weeks, according to adjusted urinary iodine status (Maharashtra, India, 2004–2006)

UIC, urinary iodine concentration.
Mean values were significantly different from those in the lowest quartile within the same gestation time: *P < 0·05.
Entering the four main classes of iodine-rich foods monitored (milk, milk products, eggs and fish) in a multiple linear regression model showed that adjusted UIC at 34 weeks was higher by 0·73 (95 % CI 0·33, 1·12) μg/l for each extra serving of milk products consumed, after adjusting for SLI score and maternal educational status. The R 2 value of this multiple regression model for adjusted UIC was however only 0·13, leaving a large proportion of the variance unexplained.
Influence of maternal urinary iodine concentration on neonatal and infant development measurements
Neonatal and infant development measurements are shown in Table 5 according to maternal UIC status at 17 and 34 weeks. Duration of exclusive breast-feeding did not differ between infants whose mothers had UIC in lowest and highest quartiles at either 17 or 34 weeks (6 and 5 months, respectively; P > 0·05). Among the offspring measures at birth (gestation, placental weight, birth weight, neonatal length, abdomen circumference, mid upper-arm circumference, subscapular and triceps skinfolds), there were no differences according to quartile of maternal UIC at either 17 or 34 weeks. There was also no difference between cord plasma glucose and insulin between the two extreme quartiles for maternal UIC.
Table 5 Characteristics of offspring according to maternal urinary iodine status (Maharashtra, India, 2004–2006)
UIC, urinary iodine concentration.
Mean values were significantly different from those in the lowest quartile within the same gestation time: *P < 0·05.
Similarly, no differences were observed for any of the infant measures at 3 or 6 months between the lowest and highest quartiles of maternal UIC.
At age 12 months, there were significant differences in infants’ subscapular and triceps skinfolds according to whether their mother had UIC in the lowest v. the highest quartile at 34 weeks (both measures P = 0·01). These differences were also seen at 24 months (triceps skinfold P = 0·02, subscapular skinfold P = 0·04). The abdominal circumference of infants at 24 months was significantly different if the maternal UIC at 17 weeks was in the lowest compared with the highest quartile (P = 0·03).
Multiple regression analyses
Maternal adjusted UIC at 17 and 34 weeks were entered in multiple linear regression models (alongside maternal age, location, education status, SLI score, parity and offspring gender) to predict selected infant outcomes which were significantly different according to maternal iodine status (Table 5). UIC at 17 weeks did not predict abdominal circumference at 24 months (P = 0·055). UIC at 34 weeks did not predict triceps skinfold at 12 months (P = 0·07) or subscapular skinfold at 24 months (P = 0·185). UIC at 34 weeks was, however, a significant predictor of subscapular skinfold at 12 months (P = 0·021, with a decrease of 0·006 cm for every extra μg/l in UIC) and triceps skinfold at 24 months (P = 0·035, with a decrease of 0·006 cm for every extra μg/l in UIC). These regression models accounted for only a very small proportion of the variance observed for each outcome (4·0 % and 3·2 %, respectively).
Discussion
Iodine deficiency is one of the WHO's nutritional priorities( 32 ). It is estimated to cause a global loss in intelligence quotient of 13·5 points at population level( Reference Bleichrodt and Born 49 ), constituting the world's greatest single cause of preventable brain damage and mental retardation( Reference Delange, Wolff and Gnat 50 ). Iodine deficiency is still the most widespread cause of maternal hypothyroxinaemia in Western societies. Detection at birth, by TSH estimation, is unlikely to identify mild iodine deficiency and would fail to identify those exposed to a period of iodine deficiency earlier in pregnancy, at a time probably too late for treatment to normalize development. It is therefore possible that many minor learning disabilities may be preventable by advising women to take iodine supplements as soon as pregnancy starts, or earlier if possible( Reference Delange, Wolff and Gnat 50 ).
The median UIC values found in the present study, 203 and 211 μg/l at 17 and 34 weeks of pregnancy respectively, lie in the ‘adequate’ (150–250 μg/l) range for pregnant populations, implying that iodine deficiency is unlikely to be a frequent problem in this population( 32 ). Our results contrast with the study of tribal Indian pregnancies by Menon et al., who found median UIC values of 106 and 71 μg/l at 17 and 34 weeks of pregnancy, respectively( Reference Menon, Skeaff and Thomson 15 ). This difference between UIC measured in different areas of the same country highlights the geographical variation that may be due to cultural/dietary habits, which could include the availability of iodine-fortified products, proximity to the sea and access to fish/seafood (Pune is less than 150 km or a 2 h drive from the sea, while Ramtek is over 750 km/11 h drive from the sea).
None of the women studied had overt iodine deficiency with hypothyroidism, either among the 151 from whom samples were available for the present study or among the 200 women who took part in the larger survey on determinants of subsequent metabolic syndrome( Reference Katre, Bhat and Lubree 40 ), as hypothyroidism was an exclusion criterion. There was a wide range of individual values, from 26 to 800 μg/l, which cannot be explained completely on the basis of the limited dietary information available. It is possible that some consumed iodine-rich food products intermittently, including iodized salt, but the significant association of UIC with dairy products consumption assessed by the ‘Milk Product Score’ confirms the importance of milk and dairy foods for iodine intake in this Indian population. Iodine is present at about 300–400 μg/l in milk( Reference McCance and Widdowson 51 ) and was shown sometimes to occur at higher concentration in Indian milk samples (range 26–604 μg/l)( Reference Longvah, Toteja and Upadhyay 52 ). Although present in many milk-based foods such as yoghurt and ice cream, high intake of milk products is unlikely to account for the highest recorded UIC of 800 μg/l (there was no iodine contamination of our samples from dip-stick testing).
A limitation of the present research is its size, small in epidemiological terms; however, the study was conducted in an area believed to include a proportion at possible risk from iodine deficiency, with a sample size on par with other similar studies( Reference Menon, Skeaff and Thomson 15 ). The results cannot be regarded as quantitatively definitive, in a sample of 166 pregnant women from two Indian antenatal clinics, but the participants were unselected and likely to be representative of the region. Moreover, our sample size at each time point should afford us a precision range of ±10 % (95 % CI)( Reference Andersen, Karmisholt and Pedersen 53 ). The distributions of UIC at 17 and 34 weeks were also corrected for day-to-day (within-person) variation using the National Research Council method relying on repeated spot measurements in the same individuals, as described in a recent review( Reference Zimmermann and Andersson 46 ) and applied in another cross-sectional survey of iodine status( Reference Mackerras, Singh and Eastman 48 ), with the caveat that these samples were collected at different gestational time points. This partly addresses the issue associated with small sample size( Reference Mackerras, Singh and Eastman 48 ) and enabled us to use extreme quartiles to compare the maternal and infant characteristics of our population.
UIC (adjusted or not) at 17 and 34 weeks did not correlate between the two gestational time points, indicating that iodine status fluctuates and that sustained exposure to toxic or extremely low amounts is unlikely. However, a few women (24 %) who had UIC in the lowest quartile at 17 weeks remained in this quartile at the subsequent time point, while 34 % of those with UIC in the highest quartile at 17 weeks had UIC in the same highest quartile at 34 weeks. The lowest level we recorded, 26 μg/l, would almost certainly lead to overt hypothyroidism if maintained. Samples were measured as ‘spot’ concentrations, the most reliable indicator of iodine status for a population( Reference Andersson, de Benoist and Delange 54 ), and would not have been biased downwards, as commonly occurs through having incomplete 24 h collections. However, spot urine samples are not suitable to establish individual iodine status.
The biochemical and physiological measurements made to assess growth and both metabolic and social developments were done by highly trained and reliable staff as part of a larger study funded by the International Atomic Energy Agency on determinants of subsequent metabolic syndrome( Reference Katre, Bhat and Lubree 40 ). It has proved possible to conduct medium- to long-term follow-up studies on the offspring of carefully characterized pregnancies in this setting. This study adds to a number of other recent papers reporting iodine status in pregnancy( Reference Fisher, Tran and Biggs 2 , Reference Kapil, Saxena and Ramachandran 16 , Reference Mian, Vitaliano and Pozza 33 , Reference Hamrosi, Wallace and Riley 55 – Reference Menon, Skeaff and Thomson 57 ). The clinical/pathological effects of overt hypothyroidism are insidious and commonly go undetected. Any adverse effects of mild iodine insufficiency in pregnancy are likely to be very small and slow to develop. Indeed, the reported impact of maternal UIC on clinical offspring outcomes is weak and not consistent (as expected in a population which we found to be iodine sufficient). Our observations suggest that iodine status reflects measures of diet quality as well as educational status and social position, which could affect growth and development both via poorer diet and by other mechanisms.
Our study was not powered to detect associations between maternal iodine status and neonatal or infant developmental outcomes: while some differences in neonatal outcomes were identified according to maternal UIC, these outcome measures were not successfully predicted by maternal UIC during pregnancy (alongside other independent variables such as location, gender of offspring, education and feeding mode). Given the frequency of low median UIC (below the WHO cut-off of 150 μg/l), without clear evidence for detriment in most cases, emerging worldwide in pregnancy, there is a need for a large enough study to exclude detriment from subclinical iodine insufficiency, potentially to revise the WHO criterion.
There are many reasons for poor fetal growth, besides low iodine status, which can interfere with thyroid function. Iodine deficiency is more common in younger and multiparous women and in smokers. Smoking also impairs fetal growth and can cause goitre, and part of this mechanism is by blocking thyroxine synthesis. Thiocyanate is a goitrogenic metabolite of cyanide found in tobacco (and also in some foods such as cabbage and broccoli, as isothiocyanate)( Reference Knudsen, Bulow and Laurberg 58 , Reference Laurberg, Andersen and Knudsen 59 ). However, smoking, albeit rare among Indian women, can cause competitive inhibition of iodide transport into the cell, causing increased TSH which in turn causes overgrowth of the thyroid gland, producing goitre( Reference Knudsen, Bulow and Laurberg 58 ). None of the women recruited in our study were smokers and the consumption of goitrogenic foods was not monitored; however, these factors need to be considered when exploring the topic of iodine status and thyroid function.
Our data also suggest that women do have occasional consumption of very high iodine foods, with corresponding occasional high UIC values up to 800 μg/l. Such values cannot be fully explained on the basis of the dietary information obtained in our study, and may relate to the (occasional) consumption of food very high in iodine or iodized foodstuffs. There is no report of iodine levels in tap water for this region. It is possible that these intermittent consumptions (with ample storage in the thyroid) are sufficient to maintain adequate iodine stores, although the usual dietary intakes and urine concentrations are low. This understanding of iodine and thyroid physiology explains the recent demonstration that, in order to determine the iodine status of individuals, at least ten separate urinary iodine measurements are necessary( Reference Andersen, Karmisholt and Pedersen 53 , Reference Koenig, Andersson and Hotz 60 ). The fact that dietary iodine need only be consumed intermittently also explains the way in which the WHO/UNICEF recommendations are formulated( 32 ). A urinary iodine value below 100 μg/l, or 150 μg/l in pregnancy, does not categorize that individual as deficient: instead, an ‘iodine-deficient population’ is considered to be one whose median for the population is below these cut-offs, in which case there are likely to be some individuals with clinical deficiency. Conversely, a population with median UIC above these values is unlikely to contain many individuals who are clinically deficient. Anxiety has arisen from several reports of (high) prevalence of iodine deficiency in the Indian population and elsewhere. However, it appears that several of the prevalence figures in these reports are based on the proportion of individuals with a spot-sample UIC below the population cut-off (100 or 150 μg/l), a misinterpretation of the use of the WHO criterion for ‘population deficiency’( Reference Laurberg, Andersen and Bjarnadottir 61 ). Statistical methods for adjustment of the UIC distribution obtained following the collection of repeat spot samples are not frequently reported or used( Reference Zimmermann and Andersson 46 , Reference Mackerras, Singh and Eastman 48 ) and the lack of validation of these methods in specific populations makes their use subject to a number of caveats; however, they can be useful to describe subgroups in cross-sectional studies. The adjustment procedure had very limited impact on the population UIC median (raw, unadjusted median values reported were 203 and 211 μg/l at 17 and 34 weeks, respectively, v. 211 and 214 μg/l for the adjusted medians), but allowed the use of quartiles to group cases. Finally, the terminology of the WHO/UNICEF document is confusing: it could be clearer to refer to ‘population iodine insufficiency’ and to reserve the medical term ‘deficiency’ to a clinical diagnosis.
Our study did not monitor TSH during pregnancy since hypothyroid women were excluded from the start; TSH rises with overt iodine deficiency, but possibly too late to warn of insidious cognitive effects( Reference Delange, Wolff and Gnat 50 ). Our data can now provide the basis of a power analysis to help design a definitive study on subclinical iodine insufficiency and the growth and development of offspring. It is possible that small Indian women have a lower requirement for iodine than women from other countries. They may be able to function better, and to be able to provide for pregnancy, on intakes below that which would result in adverse effects in large women. However, many young women need more iodine. While low-level iodine fortification of common foods or drinks is certainly a valid, and evidence-based, approach (notwithstanding the specific debate about the safety of promoting salt which is fortified with iodide), simple dietary changes could help. Our data confirm the importance of milk and dairy foods as iodine sources, especially when fish is not consumed. Milk is widely available and just 600 ml of milk or yoghurt daily provides the necessary 250 μg iodine. Iodine-rich foods may not need to be consumed daily to provide iodine since it is stored in the body.
Acknowledgements
Sources of funding: The samples/data were collected as part of a large study on determinants of metabolic syndrome funded by the International Atomic Energy Agency. The present study on iodine was funded via institutional funds (M.E.J.L.). Conflicts of interest: None declared. Authors’ contributions: The original study was designed by C.S.Y., and data collection was carried out by D.S.B., D.A.R. and H.G.L. under the supervision of C.S.Y. Urinary analysis was carried out by M.I.F.A.L. Statistical analysis was carried out by S.M.J. and E.C. The manuscript was written by M.E.J.L., M.I.F.A.L. and E.C. All authors edited and provided input in the iterations of the manuscript.


