


1. INTRODUCTION
The study of melting snow under current global warming is of great importance for understanding changes in the modern cryospheric environment and interpreting paleoclimate information in ice core records. Snow melting can occur quickly over several hours, while 50–80% of the pollutant load in snow can be released with the first 30% of the meltwater (Johannessen and Henriksen, Reference Johannessen and Henriksen1978). This process strongly influences the ion composition of snow (Balerna and others, Reference Balerna2003) and causes environmental problems, such as the ‘acid flush’ or ionic pulse in meltwater (Tsiouris and others, Reference Tsiouris, Vincent, Davies and Brimblecombe1985; Harrington and Bales, Reference Harrington and Bales1998). Ice cores are excellent for recording climatic and environmental change. However, for those cores drilled in areas that might undergo snow melting, the post-depositional processes, such as melting and elution, will change the firn/ice core horizons and alter the preserved information (Huang and others, Reference Huang, Li, Hou and Pu1997; Koerner, Reference Koerner1997). Therefore, using the impurities in snow subjected to melting as a climate indicator for the paleoclimate record will induce uncertainty.
Some researchers use the physical stratigraphy of snowpack or ice/firn cores to characterize melting. The occurrence of ice layers has been used as a direct feature to identify melting events in ice cores from Greenland and the Arctic (Alley and Anandakrishnan, Reference Alley and Anandakrishnan1995; Kameda and others, Reference Kameda1995; Fisher and others, Reference Fisher2012). In many cases, it is not clear from ice cores whether the snow had undergone melting and elution, especially in those that have been transformed from firn to ice. Apart from physical characteristics, is it possible to identify whether the snow/ice has undergone post-depositional melting using proxies that have been preserved in the snow deposition itself? Further, if melting did occur, how can we quantitatively characterize the degree to which melting occurred? Attempts have been made to use the concentration ratio between different ions (e.g. Mg2+/Na+) in snow or ice core samples as an indicator of melting and elution (Eichler and others, Reference Eichler, Schwikowski and Gaggeler2001; Watanabe and others, Reference Watanabe, Hirai and Kawada2015). This method has also been used to study the ion elution effects in snowpack or ice core records in High Asia, such as at Xixiabangma (Huang and others, Reference Huang, Li, Hou and Pu1997), Tanggula (Hou and others, Reference Hou, Qin and Huang1996), and Tien Shan (Li and others, Reference Li2006). The results of these studies revealed the preferential elution sequences of major ions in snowpack samples at the sites by comparing the temporal trend of concentration ratios between ions to the reference ion. However, this method might produce uncertainty since the reference ion itself is also affected by elution. And, the ion concentration ratio method is limited to the ions by ion chromatographer, while new techniques are required to provide possible more suitable result to determine the elution process. Furthermore, the dissolution of impurities (e.g. eolian dust) may change the ion content of snow, indicating that it is important to consider the post-depositional processes for a correct explanation of the glaciochemical record (Williams and others, Reference Williams, Tonnessen, Melack and Yang1992). Acid input will accelerate dissolution and change the concentration of the soluble fraction. To assess the elution sequence we therefore need to consider the effect of acid.
The difference in the concentration profiles between the insoluble microparticles and dissolved crustal cations (e.g. Ca2+ and Mg2+) can also reflect post-depositional melting, although both indices were used as the dust proxy. In contrast to the soluble ions, the insoluble microparticles are the less mobile impurities in snow and will accumulate at the surface instead of percolating down with the meltwater (Kohno and Maeno, Reference Kohno and Maeno1979). As far as we know, the insoluble fraction of dust has seldom been discussed when characterizing melting–elution processes. If the crustal dust, including the soluble (ions) and insoluble (microparticles) fraction, has the same source and a homogeneous composition, then the proportion between the two fractions, namely the dissolved fraction percentage (DFP, given as a percentage and calculated as the dissolved fraction divided by the sum of the dissolved and insoluble fraction), will be affected by post-depositional processes, and the variation in this proportion could characterize these processes and their strength.
Based on this assumption, we carried out fieldwork to collect surface snow at Urumqi Glacier No. 1 (UG1), Eastern Tien Shan and laboratory measurements of both the soluble and insoluble fractions of some major crustal elements, in order to characterize the elution by geochemical methods. This method was introduced by Zhang and others (Reference Zhang2013), but needs further work to put into practice. In this previous study, the elution sequence through the surface snow was determined to be Ca > Na > Mg > K by the change of DFP for the samples from March 2006 and December 2007. And the seasonal variation of DFP was reported. Besides the extension of the sampling period (through January 2010) and further analysis of the extended dataset, we emphasize progress in several new areas in this study:
First, we need to test that dust in those snow samples is derived from crust with natural origin and has a stable composition, which is necessary to ensure that the variation of the soluble and insoluble fraction are influenced by post-depositional elution. The stable composition also enables this technique to provide the possibility of using other elements to characterize snow melting and elution besides the major ions.
Second, the new technique of inductively coupled plasma-mass spectrometry was performed to get a more reliable result for the dissolved fractions than the ion chromatographer.
Third, the acid inputs, from anthropogenic and/or natural sources, will strengthen the dissolution of some acid-dissolvable materials, and increase the concentration of the dissolved fraction and consequently bias this proportion.
Finally, whether this proportion between the two fractions could be used to detect the post-depositional elution events needs to be tested. Furthermore, to discern the state of acid-dissolution is also important to understand the elution processes and evaluate the melting state of snow, such as the initial stages of elution and the ending of elution. The ion concentration can only provide the relative sequence of elution to a reference one, but fail to discern the state of elution.
The main purpose of this study is to elaborate on the detailed variation of soluble and insoluble fractions in these snow samples, and provide a new geochemical method to characterize snow melting and cation elution using the proportion between the dissolved and insoluble fractions.
2. SAMPLING AND MEASUREMENT
2.1. Field sampling
Surface snow samples were collected by researchers at the Tien Shan Glaciological Station weekly or biweekly at the field observation site (43°06′N, 86°49′E, 4130 m a.s.l.) in a percolation zone of the east branch of UG1, Eastern Tien Shan (Fig. 1). The mean annual air temperature and precipitation at the site are ~−9.1°C and 700 mm water equivalence, respectively (Li and others, Reference Li2006). The glacial annual equilibrium-line altitude rose strongly since 1997 and reached to the mean of 4110 m a.s.l. (Ye and others, Reference Ye2005). The high-level Westerlies jet stream prevails across the high mountains throughout the year.

Fig. 1. Location of the sampling site on UG1, Eastern Tien Shan.
During summer, snow was collected from the top 3–5 cm due to sufficient fresh snow. While during winter, the top 3 cm was sampled (Li and others, Reference Li2006). The protocols and requirements for surface snow sampling have been described in detail in previous papers (Li and others, Reference Li2006; Li and others, Reference Li, Li and Ding2007a, Reference Li, Li, Li and Wangb; Wu and others, Reference Wu2010). An acid-cleaned wide-mouth Nalgene LDPE bottle was used as the sample scoop and container. A total of 116 surface snow samples were collected from March 2006 through January 2010. Due to logistic difficulties, samples were not collected consecutively with strict time intervals, especially during the coldest period of each year (January and February). During the summer, particularly in August, strong melting could cause the bare glacier surface to be covered by brown dust (Takeuchi and Li, Reference Takeuchi and Li2008) and no surface snow was available for sampling. The non-continuous sampling adversely affects the results. In this study, the snow samples were named using the collection date, in the format yyyy.mm.dd.
2.2. Analytical method
The snow samples (bottles) were kept frozen until filtration. All the samples were melted at room temperature just before filtration and filtered on LCR hydrophilic PTFE membrane filters with a diameter of 47 mm and pore size of 0.45 µm (Millipore Corporation). The filtrations were performed in a class 1000 clean room at the State Key Laboratory of Cryospheric Sciences, Cold and Arid Regions Environment and Engineering Research Institute (Lanzhou), Chinese Academy of Sciences (CAS).
The dust on the filter was digested with super-pure HNO3–HF at 150–190°C in polytetrafluoroethylene screw-top bombs. Quantitative elemental analyses of the digested insoluble fraction (filters) were performed using an inductively coupled plasma-mass spectrometer (ICP-MS, X-7, Thermo-Elemental Corporation, quadrupole mass) at the Institute of Tibetan Plateau Research, CAS. Detection limits (given as 3σ of the blank filter) are tens to hundreds of parts per trillion for major elements (23Na, 24Mg, 27Al, 39K, and 44Ca). The digestion procedure, accuracy of this method for reference materials, and laboratory blanks of the ICP-MS measurement have been described in detail previously (Wu and others, Reference Wu, Xu, Zhang, Gao and Yao2009, Reference Wu2010).
The filtrate for each sample was collected in acid-cleaned LDPE bottles. The concentration of the major elements (23Na, 24Mg, 39K, and 44Ca) in filtrate was measured using the same ICP-MS. The ICP-MS blank for filtrate is at least one order of magnitude lower than the lowest concentration sample for the major elements. Here we should point out that the ICP-MS measurement for the dissolved filtrate was conducted without acidification, nevertheless acidification can significantly intensify the dissolution of many species, such as iron (Wu and others, Reference Wu, Zhang, Li, Zhang and Gao2012). Some researchers acidify the sample and leave it for 1 week to obtain the total crustal elements. However, this pretreatment cannot dissolve the elements entirely, but will increase the concentration of the dissolved fraction (Wong and others, Reference Wong, Hawley, Lutz and Osterberg2013).
The major ions (Na+, K+, Mg2+, Ca2+, SO42−, NO3−, and Cl−) in the filtrate were measured by an ion chromatographer (IC, Dionex 2000/2500, Dionex Corporation), with the limit of detection for all ions <1 ng g−1. Liquid electrical conductivity (EC) and pH were measured using a digital conductivity meter (DDB-303A, Shanghai Precision & Scientific Instrument Co. Ltd), with precision better than 0.01 µS cm−1, and a pH meter (PHS-3E, Shanghai INESA & Scientific Instrument Co. Ltd), with precision better than 0.02 pH unit, respectively. All the analyses were performed at the Institute of Tibetan Plateau Research, CAS.
2.3. A potential geochemical index of snowmelt
Some researchers have argued that the soluble (<0.02 µm) and dissolved (soluble plus colloidal, <0.4 µm) fractions are not the same and should be differentiated (Wu and others, Reference Wu, Boyle, Sunda and Wen2001). In this study, a filter with a 0.45 µm pore size was used to separate the dissolved and insoluble fractions. The filtrate was taken to be the dissolved fraction, and the residue on the filter as the insoluble fraction. The index of DFP has been used in our previous paper (Zhang and others, Reference Zhang2013) to quantitatively characterize the concentration of dissolved and insoluble fractions of elements in surface snow. The element content in the insoluble (dust particles on the filter, ng g−1 snow) and dissolved fractions (filtrate, ng g−1) of the snow samples was combined to obtain the total element content and to calculate its DFP, which is defined as DFP = X dis/(X dis + X insol) × 100%, where the subscripts ‘dis’ and ‘insol’ mean dissolved and insoluble. One sample was lost during digestion, therefore 115 samples remain for determining the DFP.
3. RESULTS AND MELTING–ELUTION PROCESSES
3.1. The dissolved and insoluble fraction concentrations
For the dissolved fraction of elements in snow samples, ions are often measured by IC as the dissolved fraction (Eichler and others, Reference Eichler, Schwikowski and Gaggeler2001; Li and others, Reference Li2006; Watanabe and others, Reference Watanabe, Hirai and Kawada2015). This is also the same for our previous work on the UG1 snow samples (Zhang and others, Reference Zhang2013). Indeed, the ICP-MS and IC results for the filtrate display a very good correlation (R 2 ≥ 0.98) in the dissolved concentrations of major elements, including Na, Mg, K, and Ca (Fig. 2). However, we find that the ICP-MS has a slightly higher (all the linear fitting curve is below the 1:1 line) result than the IC, which could cause a systematic underestimation of the DFP calculation result. In this study, in order to match the same measurement technique and instrument, both the ICP-MS results for the concentration of the dissolved and insoluble fractions of these crustal elements were used to obtain the reliable DFP values. While the anion records, including Cl−, NO3−, and SO42−, are the IC measurement results. The geochemical profiles of UG1 samples are plotted with time in Figure 3, and the statistics of concentration and DFP (%) for the major crustal elements are listed in Table 1.
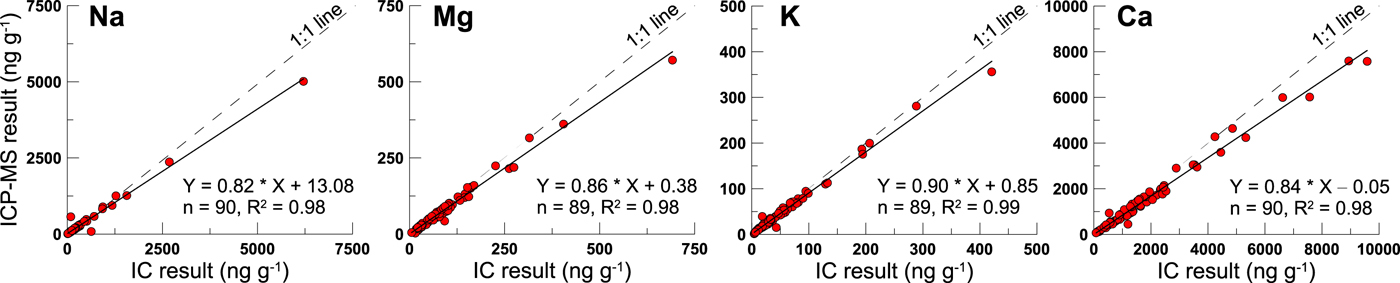
Fig. 2. The ICP-MS and IC measurement results for the dissolved fraction of major crustal elements in the UG1 surface snow samples collected from March 2006 to December 2008.

Fig. 3. Profiles of the concentration of dissolved (red circle) and insoluble (black bar) fractions of the four major crustal elements, pH, EC, and sulfate concentration for UG1 snow samples from March 2006 to January 2010. The shaded bands indicate dust seasons (April through August). The date is presented in the format of yyyy.mm.dd.
Table 1. The statistics of concentration (ICP-MS) and DFP (%) for the crustal elements (n means the number of samples) in UG1 snow samples, Eastern Tien Shan

The concentration of the insoluble fraction of dust, as indicated by Alinsol, displays seasonal variations, with a high dust load in the dust season (April through August) and a low load in the non-dust season (September through March) (Wu and others, Reference Wu2010). However, the dissolved and insoluble fraction of those major elements did not vary with the same trends or with the similar proportion in the amplitude on the scale of single samples. Some samples with high insoluble fraction have the low dissolved content, or vice versa (Fig. 3). That indicates the post-depositional processes have changed the dissolved fraction.
3.2. The melting–elution process
Previous studies indicate that ion elution begins when the air temperature rises above −3.6°C at the UG1 sampling site (Li and others, Reference Li2006). Direct air temperature and precipitation records for the UG1 sampling site are not available for our sampling period. Here we assume that temperature and precipitation at the sampling site had the same trends as the neighboring Daxigou meteorological station (43°07′N, 86°50′E, 3539 m a.s.l., ~3 km east of the UG1 sampling site, Fig. 1). The temperature data between Daxigou station and another automatic weather station at 3900 m a.s.l. on the UG1 glacier surface show a difference of 3°C during the overlapping period. Assuming a local air temperature lapse rate of 3°C/360 m in this region, the temperature difference between Daxigou and the sampling site (with an elevation of 600 m) is ~5°C. Therefore, elution at the UG1 sampling site was assumed to occur only when the daily air temperature was above 1.4°C at the Daxigou station, although melting could also occur under strong solar radiation conditions, even when the daily air temperature is lower than this threshold.
Theoretically, if the dust has the same source(s) and composition, and if there is neither acid input nor post-depositional processes, the DFP of these elements will remain consistent. Under high temperatures, when fresh snow falls onto the glacier surface, post-depositional melting and ion elution by percolation and/or flow occurs and results in decreasing ion concentration in the surface snow. Accordingly, the DFP changes based on the strength of melting and elution. If elution occurs under high temperatures, the DFP will decrease to a level lower than the unmelted case. Therefore, a low DFP clearly indicates elution. Whereas under the special condition of acid input, the DFP increases following the acid-dissolution of some materials (e.g. carbonate). The varied DFPs indicate that post-depositional processes (e.g. melting, elution, and acid-dissolution) have affected the proportion between the dissolved and insoluble fractions. The three cases, namely unmelted, eluted, and acid-dissolved, will be classified and discussed according to DFP value, acid concentration, and meteorological data in Section 4.
4. DISCUSSION
4.1. The crustal source of major elements
Using DFP to infer the degree of snow melting and elution, the source of the major elements is shown to be predominantly crustal in origin. Our previous work revealed that although seasonal variation is significant in dust concentration (insoluble fraction, more than four orders of magnitude) in UG1 snow, dust composition, as shown by elemental ratios of the insoluble fraction (e.g. L/HREE, Ce/Yb, and Nd/Yb), was also rather homogeneous in samples from March 2006 to December 2008 (Wu and others, Reference Wu2010). The extended samples through January 2010 also show this behavior (not shown here) and confirm this conclusion. The UG1 dust has a rather uniformity in element composition, which is independent of season and concentration. Anthropogenic pollutants, such as sulfate (Wake and others, Reference Wake1992) and some trace heavy metals (e.g. Cd, Pb, and Zn) (Li and others, Reference Li, Li, Li and Wang2007b), from the surrounding residential areas were found in the UG1 snow. The enrichment factors (using Alinsol as the reference element) of these major crustal elements (Nainsol, Mginsol, Kinsol, and Cainsol), which are widely used to check for anthropogenic contributions, are very low (<1.8) for the insoluble fraction, indicating that there are no significant distortions for these four major crustal elements. Furthermore, strong correlation was also found among those elements in soluble and insoluble fractions. The dissolved and insoluble concentrations of Na, K, Mg, and Ca showed significantly positive correlation with the concentration of insoluble Al (a reference element of the upper continental crust) (Zhang and others, Reference Zhang2013), suggesting that the four elements in the dissolved fraction might have common source origins with that of Al.
However, since the dissolved fraction is also used to calculate the DFP, whether the dissolved fraction of dust (Nadis, Kdis, Mgdis, and Cadis) has a stable composition also needs to be tested. Since the post-depositional processes that can disturb the dissolved fraction, this argumentation therefore becomes less straightforward comparing with the insoluble one. The pH (from March 2006 to December 2008) and EC (from March 2006 to January 2010) of our samples averages 6.74 and 11.93 µS cm−1, respectively; both are fairly comparable to previous findings (pH averaging 6.66 and EC averaging 12.74 µS cm−1) for UG1 snow samples for another period November 2002 to October 2005 (Li and others, Reference Li, Li and Ding2007a). Here we discuss the calcium, which has the highest concentration and the maximum variation amplitude among the four cations. In UG1 snow samples for the period September 2002 to September 2004, calcium averages 1624 ng g−1 (arithmetically, varying from 81 to 9586 ng g−1) (Li and others, Reference Li, Li and Ding2007a). In our ICP-MS results, dissolved calcium is the predominant cation component and averages 1457 ng g−1 (varying from 111 to 7593 ng g−1) from March 2006 to December 2008 and 1533 ng g−1 (varying from 66 to 7981 ng g−1) from March 2006 to January 2010. This is consistent with the previous study, although the sampling periods are different. Based on the agreement between the previous results and our own, the dust in UG1 snow seems to have a stable composition.
Eolian dust is a major component of the dissolved chemical content of snow packs in central Asia. Long-term observations and studies of snow geochemistry have been carried out at Eastern Tien Shan, Central Asia. High ion burdens were associated with dusty layers in the snowpack (Wake and others, Reference Wake1992) or with high dust concentration in snow samples (Li and others, Reference Li2006), indicating that the vast arid regions of central Asia are the dominant source for major ions in Tien Shan snow. The dissolved fractions of major elements, which are usually measured as cations, also show crustal origin. The Mg2+ is closely correlated with dust particles and thought to be the index of dust (Li and others, Reference Li2006). The Na+, K+, and Ca2+ also primarily come from dust, since UG1 is remote from marine sources (Li and others, Reference Li2006). Snowpack records for UG1 also indicate that the Na+/Cl− ratio is slightly higher than that of seawater, suggesting that a small portion (<12%) of Na might come from seawater (Williams and others, Reference Williams, Tonnessen, Melack and Yang1992).
The extended samples support our previous result (Zhang and others, Reference Zhang2013) that the major elements (Na, K, Mg, and Ca) have the crustal source and compositional homogeneity. Therefore, this homogeneity of these major elements can provide a basis for using the proportion between the dissolved and insoluble fractions of these crustal elements as a potential index to characterize the melting–elution process and/or anthropogenic acid input.
4.2. The effect of acid input on the DFP
UG1 is located closely to human residential areas and receives anthropogenically emitted acidic materials, such as sulfate and nitrate (Wake and others, Reference Wake1992; Williams and others, Reference Williams, Tonnessen, Melack and Yang1992). Over the sampling period, sulfate and nitrate concentrations vary greatly, with more than two orders of magnitude (Fig. 3 and 6). The sulfate concentration averages 1047 (ranging from 15 to 10 805) ng g−1, while nitrate averages 650 (ranging from 18 to 3453) ng g−1. The acids will strengthen the dissolution of some acid-dissolvable materials, and increase the concentration of the dissolved fraction and change the DFP in the snow. Acidification (to pH = 2.0) of UG1 snow samples shows that the dissolved fraction of some elements (e.g. Fe) will increase greatly (Wu and others, Reference Wu, Zhang, Li, Zhang and Gao2012). The DFPs of both Ca and Na show a close correlation (p < 0.01, significant) with the sulfate and nitrate concentration (Fig. 4), indicating that Ca and Na are very easily affected by acid input. Whereas the DFPs of K and Mg show no regular correlation with sulfate and nitrate, suggesting that K and Mg are more independent of the acid input and seem more stable in the post-depositional processes than Ca and Na.

Fig. 4. The DFP of major crustal elements vs sulfate (top), nitrate (middle) concentration, and excess sulfate index SO42−/Alinsol (bottom) of UG1 samples. All the correlations shown in the figure are significant (p < 0.01). Note that the correlation between Na (and Ca) DFP and excess sulfate index is linearly regressed for the samples with SO42−/Alinsol < 1.0, while the logarithmic regression is also applied for Ca DFP vs SO42−/Alinsol ratio for all the samples. n in the figures means the number of the samples.
As pointed out by previous researchers, sulfate is preferentially eluted over calcium (Eichler and others, Reference Eichler, Schwikowski and Gaggeler2001; Li and others, Reference Li2006). The relatively low sulfate fraction might result from the low acid input and/or elution, while the high one indicates the anthropogenic input. In this study, we used the concentration ratio between sulfate and dust (SO42−/Alinsol, both with unit of ng g−1), instead of the absolute sulfate concentration, as the index of anthropogenic acid input to the surface snow, and assumed that there was excess acid input when this ratio was greater than a given threshold (possibly SO42−/Alinsol = 1.0). This tentative threshold is an arbitrary standard to show the input amount of acid relatively compared with dust. An increase in the SO42−/Alinsol ratio means there was more acid input and consequently strengthened acid-dissolution than under normal conditions. Extremely low SO42−/Alinsol ratios (<0.1) mostly occurred during melting periods and showed a co-occurrence with a low DFP, indicating strong elution, since SO42− is the most preferentially eluted ion at this site (Li and others, Reference Li2006). Generally, the DFPs increase with high SO42−/Alinsol ratios, but become rather stable (Na and Mg) or even decrease (Ca) when this ratio exceeds ~1.0 (Fig. 4), suggesting that the acid-caused dissolution has a threshold.
4.3. The DFP of the four major crustal elements and the elution sequence
Some samples have a high (or relatively high) concentration both in the dissolved and insoluble fractions. Although samples 2006.04.21, 2007.04.11, 2007.05.03, 2007.10.03, and 2009.10.24 have dust (Alinsol) concentrations much greater than average, they show normal DFP values (Fig. 7). Here, the ‘normal DFP’ was defined as the DFP of those samples that experienced no melting. Since those samples were collected during spring or fall with daily air temperatures lower than the melting threshold, they are classified as the unmelted case. In contrast, some low Alinsol concentration samples show a high DFP, such as those collected on 2006.05.27, 2006.07.12, 2007.06.13, 2007.07.11, 2009.03.28, and 2009.04.04, due to the relatively high concentration of the dissolved fraction, that was probably caused by acid input (see discussion in Section 4.2).
The DFPs show a downward trend when plotted against dust concentration, and most low DFP samples contain a high Alinsol concentration (Fig. 5), suggesting the high dust concentration in the snow resulted either from the heavy dust input or from the accumulation of insoluble microparticles by elution, or both. The contribution of elution-induced accumulation can be identified by the DFP, which is useful in explaining the high dust concentration in snowpack and ice core records.

Fig. 5. The DFP vs dust (insoluble Al element) concentration of UG1 snow samples. All the correlations are significant (p < 0.01). The logarithmic scale was used to give a clear indication of the low concentration samples.
As shown in Figure 6, there are still variations in the DFP during cold periods (daily air temperature <1.4°C at the Daxigou station) without corresponding changes in acid input (see discussion in Section 4.2). For example, during the cold period between October 2007 and March 2008 (the gray band in Fig. 6) the DFP varied from 9.8 to 39.4% for Na, while from 2.4 to 19.3% for K. Those variations indicate that in addition to temperature and acid input, other factors could also affect the DFP, such as atypical additional sources or compaction of the snow, since precipitation (snowfall) is infrequent during the winter.

Fig. 6. The DFP profiles for UG1 snow samples during a cold period October 2007 and March 2008 (the gray band). The daily precipitation and temperature data at the Daxigou meteorological station are also shown. The sampling collection date was presented in the format yyyy.mm.dd.

Fig. 7. The DFP profiles for UG1 snow samples during the period March 2006 to January 2010. The daily precipitation and temperature data at the Daxigou meteorological station are also shown. Some samples were chosen to typify the relevant categories. Samples were named according to the collection date in the format yyyy.mm.dd.
Over the period 24 January to 28 February 2007, the samples have stable, low DFPs, with low temperatures and minimal acid input. Whereas for the period from 26 July to 10 August 2006, the samples have extremely low DFPs for all the elements, and have the lowest acid input. Therefore, the two periods were chosen to represent typical unmelted and eluted samples, respectively.
Calcium has the most variable and highest average DFP. The lowest Ca DFP occurred during the warm season, clearly indicating strong elution. Furthermore, all the low Ca DFP (<30%) samples derived from the warm season, with 24 October 2009 (sample 2009.10.24) being the only exception. For the elements Na, K, and Mg, almost all the extremely low DFPs occurred during the warm season, with very few exceptions. Therefore, the DFPs in the cold and warm seasons can also generally represent the unmelted and eluted states. According to the meteorological record at the Daxigou station, all of the days with a daily temperature of ≥1.4°C were grouped into the warm season, and the rest into the cold season (Table 2). During the warm season, the average DFP of those four elements is lower than that in cold season, indicating that elution has happened during summer. Only K shows the discrepancy that its DFP is slightly higher during warm season, possibility due to the low DFPs during the two seasons.
Table 2. The average DFP of the four elements between typical unmelted and eluted stages, and between the cold (n = 71) and warm (n = 44) seasons

The difference in the DFP (ΔDFP) between the unmelted and eluted stages for a given species, therefore, can reflect the strength of elution. Furthermore, the preferential elution of the ions will lead to variation in the ΔDFPs for these elements and might provide an effective method to quantitatively characterize the elution sequence. Calcium has the greatest ΔDFP (50.2%) among the four elements, followed by Na (18.7%) and Mg (6.1%), and K has the lowest one (3.2%). This result is consistent with that of the cold-warm season. Based on the ΔDFP between the typical unmelted and eluted stages and between the warm and cold seasons, the elution sequence for the four elements Ca > Na > Mg > K was obtained, same to the previous result between March 2006 and December 2007 (Zhang and others, Reference Zhang2013). This result is very similar to the result of Ca2+ > Na+ > K+ > Mg2+ using the temporal trends in ion concentration ratio relative to the reference value (using Mg2+ as the reference species) (Li and others, Reference Li2006). Even in the work of Li and others (Reference Li2006) the difference in the elution trend between K+ and Mg2+ is very small. Therefore, for the UG1 snow, there is no substantial difference in elution sequences between our results (the DFP results) and previous work (ion ratio results). This validates the method of using the DFP as a possible index to characterize the melting–elution strength. The ion concentration ratio technique is limited to the ions that can be analyzed using the IC technique. While beyond the limitation of the four major cations, our method can be applied to the trace and rare earth elements using the much more precise ICP-MS technique. This geochemical method therefore possibly provides a new technique to determine the elution process more accurately.
The ion elution of melting snow has been studied at many sites, but with different sequence results. The elution sequence is SO42− > Ca2+ ~ Mg2+ > K+ ~ Na+ > NO3− > Cl− in the Grenzgletscher ice core, southern Alps (Eichler and others, Reference Eichler, Schwikowski and Gaggeler2001), K+ > SO42− > NO3− > Cl− > Ca2+ > Mg2+ > Na+ at Baishui Glacier No. 1, southwest China (Zhang and others, Reference Zhang2010), and SO42− > K+ > Ca2+ > Mg2+ > Na+ > Cl− > NO3− at Shiyi Glacier, Qilian Mountains (Li and others, Reference Li2015). Svalbard ice cores indicate that non-sea-salt Mg is particularly sensitive to melting (Kekonen and others, Reference Kekonen2005). Using the synthetic ice core approach, a partial elution sequence for the summit of Lomonosovfonna, as NO3− > SO42−, Mg2+, Cl−, K+, Na+, was obtained (Vega and others, Reference Vega2016). However, at UG1, Na is preferentially eluted over Mg (this study and Li and others, Reference Li2006). The regional constraint on elution sequences might be caused by other factors (e.g. sea salt and crust sources; dust composition) that are beyond the scope of this paper. Nevertheless, our method can be applied at different sites, including those in the low latitudes to constrain the elution sequences.
Since Ca is susceptible to post-depositional processes and is most preferentially eluted by meltwater, it is reasonable to be cautious when using calcium as the dust index in snow and ice cores from low-latitudes and low-altitudes. Based on the elution sequence, Mg seems to be a better species for the dust index than Ca.
4.4. DFP as a potential quantitative index for melting events in UG1: case studies
Using DFP as the potential index for the strength of elution requires two conditions simultaneously: the element has a crustal origin and the variation of the DFP was caused by elution. Both conditions are met based on the discussion in Sections 4.1 and 4.3. Therefore, the DFP will change corresponding to the strength of elution, making it possible to use this ratio to reflect the elution process. The ion concentration can only indicate the relative elution sequence to a reference ion. While, since the DFP of those elements is independent of each other, the combination and comparison of those DFPs can provide new and more detailed information on the elution process. With the acid input index, the different elution states, e.g. unmelted, acid-dissolved, and eluted, can be classified.
Typical unmelted snow samples can be found during the winter season (gray bands in Fig. 7), such as the stage from 24 January to 28 February 2007 (Table 2), with stable and moderate DFPs and weak fluctuations.
The acid-dissolved cases occur with high SO42−/Alinsol ratios (>1.0). Sample 2006.10.26 has the highest SO42−/Alinsol ratio (=3.97), suggesting that the acid input accounts for its high DFP since it was collected during the latter part of fall (low temperatures) when melting was absent (Table 3). Even during the summer and with high temperatures, there are also some acid-dissolved cases (e.g. 2008.07.01), possibly due to sampling being carried out just after dissolution but before elution.
Table 3. The detailed information of some typical cases. The daily temperature at the Daxigou station is in the unit °C

Note: Some typical unmelted and eluted cases are also listed in Table 2.
Eluted cases occur mostly during the warmest period from June to August. Between 26 July and 10 August 2006, the air temperature rose to the warmest of the year, which enabled and resulted in strong elution (the dark gray band in Fig. 7). A high dust (insoluble fraction) concentration in snow and ice cores can result from heavy dust input and/or compaction caused by melting and elution. The high dust concentration samples collected on 26 July, 3 and 10 August 2006 might be partly due to the melting–elution during the period with the highest daily temperature of the year, which lasted from 19 July to 9 August 2006 (Wu and others, Reference Wu2010). Correspondingly, the DFP value is extremely low (0.1% for Na, 0.5% for Mg, 0.1% for K, and 3.5% for Ca) for the sample with the highest dust concentration (2006.08.10, Alinsol = 118 633 ng g−1), confirming that the high dust concentration of this sample is clearly affected by elution-induced accumulation, although heavy dust input was the predominant contribution. Similar cases were found in samples 2007.06.28, 2008.06.10, and 2009.06.27 (Fig. 7). The DFP therefore serves as an effective index to identify whether high dust concentration was caused by strengthened input, or partly resulted from post-depositional accumulation from melting and elution.
For some samples, the four species could be classified into different cases due to their elution strength. Sample 2007.07.11 has the second highest SO42−/Alinsol ratio (=3.93) and a high DFP for Na (81.5%) and Mg (20.4%), in particular the highest K DFP (67.7%) for the whole sampling period, indicating that the DFP of this sample is affected by acid input. However, the relatively low (50.3%) Ca DFP suggests this sample might have undergone weak elution, as Ca is the most preferentially eluted cation. Therefore, sample 2007.07.11 can be classified as an acid input case from the elevated DFP for Na, Mg, and K, but also as the weakly eluted case from the Ca DFP. Although sample 2007.07.18 has the third highest SO42−/Alinsol ratio (=2.98), the low DFPs for Ca (54%), Na (32.9%), and Mg (8.3%) clearly indicate an eluted case, while the high-K DFP (21.8%) suggests that K is still at an acid-dissolved state due to K being the least preferentially eluted species among them. Therefore, sample 2007.07.11 indicates a state of acid-dissolution and the initial stages of elution, while sample 2007.07.18 represents the ending of elution (Table 3). The variation of DFPs for a given sample is useful to identify additional detail in the acidification or elution process, and reveals that ion elution is a process more complex than revealed simply by the temporal trends of ion concentration ratios.
4.5. Uncertainties and future work
Compared with the elution sequence from ion concentration, the DFP is an improved method. The geochemical index (DFP) of those elements is independent of each other (Na, Mg, K, and Ca) and can provide new and more detailed information on the elution process. Ion concentration alone seems insufficient to detail the classification of elution. In addition, DFP can be applied to the trace and rare earth elements besides Na, Mg, K, and Ca. As we pointed out in the Introduction, the ion concentration method might produce uncertainty since the reference ion itself is also affected by elution. Finally, the ICP-MS technique is much more accurate than IC for the major elements in the dissolved fraction.
Although this geochemical-based DFP index provides an effective approach for assessing the elution strength of surface snow, some considerable uncertainties in the results and their implications remain and need examination. It is assumed that the dust has a stable composition. In winter, the DFP, especially for Ca, did not always show the same or even a stable level (Fig. 7), suggesting that the assumption of compositional homogeneity is somewhat simplified and idealized. If an additional dissolved fraction (e.g. salt) was attached to the surface of the dust particles, the original DFP will change accordingly.
The absolute DFP value might have a regional to local implication due to the mineral composition of these dust samples. For example, the UG1 snow samples show that Ca has the highest DFP, while the Sahara dust in the loess from Cape Verde Island shows the highest Na solubility, higher than Ca, K, and Mg (Desboeufs and others, Reference Desboeufs, Losno and Colin2001). However, using the variation of the DFP (ΔDFP) to evaluate the elution strength is applicable at different sites, regardless of the absolute DFP value of a given crustal (or natural) species.
Some high DFPs might be caused by the input of excess acids. This effect can superimpose on melting and elution during the warm season. The SO42−/Alinsol ratio was used as the index of excess acid input from anthropogenic sources. However, this ratio is also affected by the post-depositional elution process, as sulfate can be eluted during the warm season (Eichler and others, Reference Eichler, Schwikowski and Gaggeler2001; Li and others, Reference Li2006).
There are still two uncertainties in the field sampling itself. The first is the spatial uncertainty, which has been reported to be considerable for ice core and snow samples over a short distance (Steig, Reference Steig2008), although it is generally <10% of mean ion concentration in the UG1 basin (Williams and others, Reference Williams, Tonnessen, Melack and Yang1992). The second is the temporal uncertainty of relatively long sampling intervals, since the melting and elution processes can occur in a time span far shorter than a week (a few samples have even longer collection intervals) time span. Although the sampling period lasted nearly 4 years, the collection was not consecutively carried out due to limited logistics, such as the two neighboring samples collected on 8 July and 9 September 2008. Therefore, some samples might have experienced a melting–elution–re-freezing cycle and multi-precipitation (snowfall) events, which complicates characterizing elution using geochemical data that represent the final state before sampling. For some summer samples, they may simply reflect the state of the sampling time of the surface snow deposited by the last snowfall. Parallel, consecutive and high-frequency sampling is required for more representative data in future work.
In ice core records, especially those used for geochemical analysis, a single sample might represent a seasonal to multi-year time interval and might cover more than one precipitation–melting–elution–re-refreezing cycle, depending on the temporal resolution. Therefore, using the DFP index to characterize elution seems to be limited to samples with seasonal or higher resolution.
5. CONCLUSIONS
In this study, we applied a new geochemical method to characterize the elution of surface snow on UG1, based on detailed measurement of the concentration of dissolved and insoluble fractions of four major crustal elements: Na, Mg, K, and Ca. Using the DFP index, our results detail the variation of concentration for the dissolved and insoluble fractions of the four elements and their elution in the UG1 surface snow. The dust in the UG1 snow has a crustal origin and compositional homogeneity. Calcium has the greatest DFP among those elements, followed by Na, Mg, and K in descending order. The variations in DFP between the typical unmelted and eluted stages and between the warm and cold seasons are used to characterize the elution strength, showing the elution sequence Ca > Na > Mg > K for the four elements. This sequence is consistent with that shown by the ion concentration method, and verifies our method. Calcium is most preferentially eluted by post-depositional processes, suggesting that using Ca2+ as the climatic and environmental (such as dust) index in the low-latitude and/or low-altitude ice cores should be carefully considered.
The input of acids could also increase the DFP, and this effect can be estimated from the index of the concentration ratio between acid and dust (SO42−/Alinsol). The DFP index can also be used to detect whether the high dust (insoluble fraction) concentrations in summer are induced by atmospheric dust input or are from the post-depositional elution-induced accumulation. In addition, the DFP for different elements also reflects their different elution states, e.g. unmelted, eluted, and acid-dissolved, which the ion concentration is insufficient to discern. The state of acid-dissolution and the initial stages of elution (sample 2007.07.11) and the state of the ending of elution (sample 2007.07.18) can also be found by DFP and acid input index. This method has not yet provided a definitive reconstruction of the melting and elution history of snow because such processes are complex, and many uncertainties remain. The DFP index provides an effective and possibly quantitative or semi-quantitative assessment of the snow melt/elution process and will be helpful to understand the ice core records in low-latitude and/or low-altitude. Our geochemical index appears to be better than using the ion concentration comparison alone, since the DFP of those elements is independent of each other, the combination and comparison of those DFPs can provide new and more detailed information on the elution process. In addition, our method can be applied to the elution of trace and rare earth elements.
ACKNOWLEDGEMENTS
We are grateful to the Tien Shan Glaciological Station for the fieldwork at Urumqi Glacier No. 1 and Caroline Brimblecombe for improving the text. We also thank two anonymous reviewers and Editor Michelle Koutnik and Hester Jiskoot for their comments. This work is supported by the National Natural Science Foundation of China (Grant No. 41725001) and the Strategic Priority Research Program of Chinese Academy of Sciences (Grant No. XDA20060201).


 Open access