


Reducing the emission of greenhouse gas methane and noxious nitrogen-containing compounds from ruminant husbandry at unchanged nutrient and energy utilisation is a major goal in animal nutrition. In this context, feeding distinct plant secondary compounds, such as phenols, has shown potential for reducing the formation of methane and ammonia in the rumen of ruminants(Reference Patra and Saxena1,Reference Sinz, Kunz and Liesegang2) . Among them, the phenolic extract from grapeseed has been demonstrated to exhibit methane-mitigating properties in vitro (Reference Wischer, Boguhn and Steingaß3). In addition, the antioxidant and antimicrobial properties of various phenols(Reference Pasqua, Simonetti, Rodriguez and Franco Ruiz4,Reference Sgorlon, Stradaioli and Zanin5) could be beneficial to health and performance of ruminants. The efficiency of dietary phenols could depend on the animal species. For instance, goats, which are ‘intermediate feeders’, rely at least partially on browse from woody plants, whereas sheep, characterised as ‘grazers’, prefer to consume grasses and herbaceous plants(Reference Hofmann6). Therefore, goats have been reported to tolerate the often high tannin levels in their browse better than grazers(Reference Rogosic, Pfister and Provenza7). Goats may have developed protective mechanisms against tannins such as a higher concentration of certain salivary proteins (including proline-rich protein, amylases or histatins), resulting in a higher tanning-binding capacity of the saliva(Reference Lamy, Rawel and Schweigert8). Due to this adaptation, the response of goats to dietary phenols in methane emission and N excretion via faeces might be weaker than that of sheep. However, to the best of the authors’ knowledge, this has not been fully and conclusively investigated in vivo in lambs v. goat kids, especially regarding methane emissions and phenol excretion.
The following hypotheses were tested in the present study: (1) Phenolic grapeseed extract in the diet lowers methane emission to a larger extent in lambs compared with goat kids. (2) Grapeseed extract shifts N excretion from urine to faeces with a larger effect in lambs compared with goat kids. (3) The phenol contents in the blood and the tannin-binding capacity of the saliva are higher in animals fed grapeseed extract and (4) the salivary tannin-binding capacity is higher in goat kids compared with lambs.
Methods
Experimental diets
The diet of the dams consisted of meadow hay and concentrate in a ratio of 55:45, the composition of which is given in Table 1. In addition, 500 g/d of water-soaked sugar beet pulp was provided. Half of the dams received the phenol extract supplemented (PE) diet, characterised by a concentrate containing 74 g of grapeseed extract/kg DM, and the other half received the same concentrate but without the extract. The diet of the lambs and goat kids consisted of meadow hay and concentrate in a ratio of 1:1 (Table 1). In addition to an unsupplemented control diet, a PE diet was fed to the offspring as well; this with a concentrate containing 56 g grapeseed extract/kg DM (equivalent to 28 g/kg total dietary DM). This level was considered to be sufficiently low to avoid reductions in voluntary feed intake(Reference Jerónimo, Alves and Dentinho9). The grapeseed extract (OmniVin 10 R; S.A. Ajinomoto OmniChem) had, as analysed, a content of 707 g total extractable phenols (TEP)/kg DM, whereof 658 g were tannins. The hay fed to the offspring was from the second cut of a meadow and consisted at 2/3 of grasses (mostly ryegrass), and the remainder were legumes and herbs (mostly white clover).
Table 1. Ingredients and chemical composition of the experimental feeds
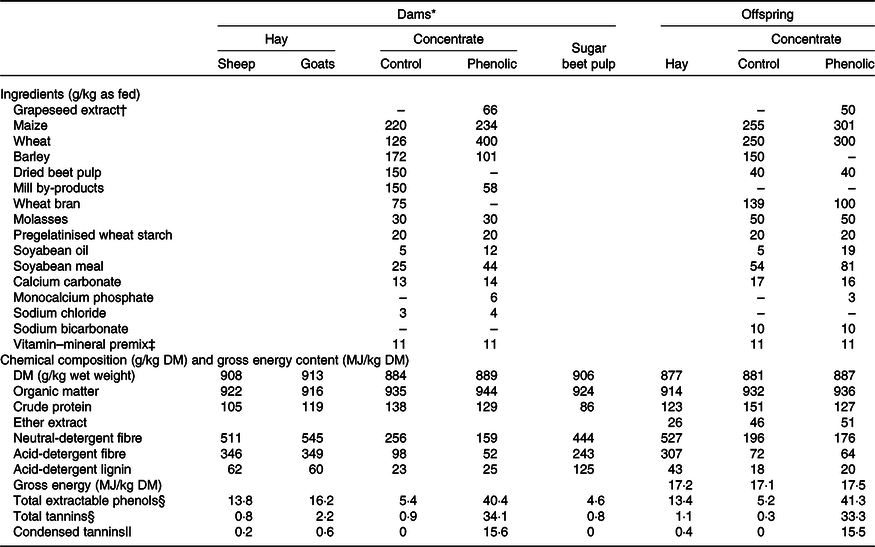
* The values for the dam diets are taken from Leparmarai et al. (Reference Leparmarai, Sinz and Kunz10).
† Equivalent to 74 and 56 g/kg DM.
‡ The vitamin–mineral premix added to the concentrate provided, per kg of concentrate, 3·150 mg vitamin A, 32·5 μg vitamin D3, 50 mg vitamin E, 500 mg nicotinic acid, 100 mg Fe, 50 mg Zn, 50 mg Mn, 1·85 mg iodine, 0·5 mg Co, and 0·35 mg Se.
§ Given as gallic acid equivalents.
|| Given as leucocyanidin equivalents.
Animals, housing and experimental protocol
The experiment received ethical approval from the Committee on Animal Experimentation of the Cantonal Veterinary Office of Zurich, Switzerland (ZH 267/16). The first part of the experiment (time from birth to weaning) took place at the facilities of the University of Zurich. Shortly after giving birth, the East Friesian Dairy sheep and Saanen goats were assigned to the two feeding groups in a complete randomised design. The concentrate proportion was gradually adapted to 400 g/kg diet within week 1 after parturition and 3 weeks later to 450 g. More details on the experimental procedures applied with the dams are described elsewhere(Reference Leparmarai, Sinz and Kunz10). Until weaning, the lambs and goat kids suckled from their dams and were observed to consume small amounts of the diet of the dams.
The second and main part of the experiment took place at the facilities of AgroVet Strickhof and consisted of a 2-week adaption period to diets and the new housing conditions and a 7-week experimental period. The aim was to confront the animals directly after the weaning period with the experimental diets. Thus, the animals were moved to the new facilities shortly after their respective weaning date, which took place approximately 7 weeks after birth. Out of the total of twenty-six lambs and nineteen goat kids born, sixteen healthy lambs (eight females and eight males) with an average body weight (BW) of 19·8 (sd 2·7) kg and thirteen healthy goat kids (two female and eleven male) with an average BW of 18·3 (sd 3·1) kg were selected. The dates of birth and thus the weaning dates slightly differed within species, and the lambs were born on average 38 d earlier than the goat kids. To account for these differences and according to their weaning dates, the animals started into the experiment in four blocks, starting with the sheep (i.e. the first two blocks consisted of the lambs, the latter two blocks of the goat kids). They were allocated in a complete randomised design to the two diet groups per block, resulting in four experimental groups, two species and two diets, with eight animals intended per species and diet group (diet groups of the dams were not considered; explanation see in ‘Statistical Analysis’). The animals of each treatment group started into the experiment (i.e. adaptation period) at different times in four blocks of 6–8 animals each in total, based on different dates of birth and weaning. The time difference between the first and the last block starting into the experiment was 5 weeks. In the adaption period, the animals were gradually familiarised with the high level of the concentrate. Feeding times were 07.00 and 17.00 hours. The animals received the concentrate after they had consumed at least half of the hay. The daily diet DM allowance was restricted to 0·04 of BW (as measured and recalculated weekly) following recommendations of Agroscope(11) based on the feed intake capacity of lambs and goat kids. The feed allowance was increased to 0·045 of BW from experimental week 3 onwards as it became obvious that the animals did not reach their intake capacity. The animals were kept separately in calf igloos with a free outside area covering a floor size of 3·5 m2. The floor was covered with wood shavings. The animals had free access to water, and extra NaCl was offered as licking stones.
Measurements and sample collection
During the 7-week experimental period, the animals were weighed weekly after morning feeding. Individual refusals were recorded weekly for the hay and daily for the concentrate. Feed samples were collected three times during the experimental period. Starting in week 5 and 6 of the experimental period, each animal was subjected to a 7-d collection period where the animals were kept in crates with a floor size of 2 m2. Feed and water intakes were measured daily. The crates were equipped with a rubber mat, whereof two-thirds were perforated (column and beam widths of 20 and 40 mm, respectively) to allow faeces and urine to fall into a plastic tray mounted beneath the crates. On the bottom of the plastic trays, a grid kept the faeces and let the urine pass through a hole into a plastic container. A small part of the urine was ducted to a second container filled with 50 g of 7 M sulphuric acid to prevent nitrogen evaporation. Samples of faeces and non-acidified urine were taken daily proportionally to total excretion. From the acidified urine, 25 ml/d were sampled. Part of the faeces samples was lyophilised, the rest remained unchanged. All excreta samples were stored at –20°C. Gaseous exchange by the animals was measured in respiration chambers on the last 2 d of the collection period with the animals still being confined in the metabolic crates. The two air-conditioned chambers had a volume of 8·3 m3. Temperature, humidity and air pressure were maintained at 18°C, 70 % and 60 Pa, respectively. The airflow was set to 200 litres/min (Promethion FG-1000 flow generators, Sable Systems Europe GmbH). Concentrations of O2, CO2 and CH4 were measured in the ingoing and outgoing air with a gas analyser (Promethion GA-4, Sable Systems) every 3 min for 1 min. The gas analyser was calibrated automatically before the individual measurements started using pure N2 (99·999 %) and a mixed gas (0·5 % CO2 and 0·1 % CH4 in N2 as carrier). The recovery rate for CO2, measured before the collection period started, was 96·3 % on average. Feeding and excreta collection were accomplished twice a day during the collection period. During the gas exchange measurements, the chambers were accessed through an airlock for feeding and excreta collection.
On the last day of the 7-week experimental period, blood samples were obtained from the jugular vein using EDTA vacutainers (BD, Belliver Industrial Estate). Plasma was generated by centrifugation at 2000 g for 10 min. In addition, saliva samples were collected by using Salivettes® (Sarstedt) and allowing the animals to chew on cotton. The saliva samples were centrifuged at 1000 g for 2 min. Saliva and plasma samples were immediately stored at –80°C.
Laboratory analysis
Feeds and lyophilised faeces were ground through a 1-mm screen before analysis. Applying standard methods(12), the samples were analysed for DM and total ash with a thermo-gravimetric device (model TGA 701, Leco Corporation) and neutral-detergent fibre (NDF) using heat stable α-amylase but no sodium sulphite(Reference Van Soest, Robertson and Lewis13). In feed, additionally acidified detergent fibre and acid-detergent lignin were determined, the latter by acid digestion with sulphuric acid (72 %) for 3 h. The detergent fibre data were obtained with the Fibertec System M 1020 Hot Extractor and the 1021 Cold Extractor (Tecator; AOAC(12) index no. 973.18), and the values were corrected for ash. Nitrogen and carbon contents were determined in feed, non-lyophilised faeces, acidified urine (N) and non-acidified urine (carbon) with a C/N-analyser (TruMac CN, Leco Corporation; AOAC(12) index no. 968.06). Crude protein (CP) was calculated as 6·25 × N. The gross energy (GE) content of feed and lyophilised faeces was measured by bomb calorimetry (Calorimeter C7000, IKA-Werke GmbH & Co. KG). Ether extract was analysed in the feed on a Soxhlet extractor (extraction System B-811, Büchi; AOAC(12) index no. 963.15).
Phenolic fractions were analysed in feed and faeces according to Makkar(Reference Makkar14) as modified by Jayanegara et al. (Reference Jayanegara, Wina and Soliva15). The condensed tannins (CT) were expressed as leucocyanidin equivalents; all other phenolic data as gallic acid equivalents (Sigma). Briefly, for TEP and non-tannin phenols a modified Folin–Ciocalteu method was used, while the butanol-HCl-iron method was applied to determine CT concentrations. Total tannins (TT) and hydrolysable tannins were calculated as the differences between TEP and non-tannin phenols as well as between TT and CT, respectively. The total phenols (TP) in blood plasma and urine were measured with the Folin–Ciocalteu method(16) based on Serafini et al. (Reference Serafini, Maiani and Ferro-Luzzi17). For the hydrolysation, 0·1 ml of the sample and 0·2 ml of 1·0 M HCl were mixed for 60 s and incubated at 37°C for 30 min. Subsequently, 0·2 ml of 2·0 M NaOH in 75 % methanol was added, mixed for 60 s and incubated at 37°C for 30 min. Then, 0·3 ml of 0·75 M meta-phosphoric acid (Sigma-Aldrich Chemie GmbH) was added, mixed and centrifuged at 16 000 g for 15 min. Afterwards, 0·4 ml of the supernatant fraction was transferred into a tube, and 0·1 ml of 0·75 M meta-phosphoric acid was added. The tube was vortexed and centrifuged for 15 min at 16 000 g. A total of 0·1 ml supernatant was incubated with 0·5 ml Folin–Ciocalteu reagent (1:10 diluted, 1 N; Sigma-Aldrich Chemie GmbH) for 3 min. Then 0·4 ml sodium carbonate solution (7·5 %, Sigma-Aldrich Chemie GmbH) was added, and the reagents were vortexed. After 60 min incubation in the dark, the TP were recorded at 765 nm, using a UV–vis spectrophotometer (VWR UV-6300, VWR international). The TP contents were expressed as gallic acid equivalents.
The tannin-binding capacity of protein in saliva was analysed with a tanning-binding assay, following Fickel et al. (Reference Fickel, Pitra and Joest18). Tannic acid and quebracho served as test substances representing hydrolysable tannins and CT, respectively. Before the analysis, the samples were centrifuged for 10 min at 3500 rpm, and salivary protein concentrations were measured by a colorimetric assay(Reference Bradford19).
Calculations
The following equations were used for the calculation of digestibility, N and energy balance:
 $${\rm{Digestibility \ (\% \ of \ GE \ intake}}) = \left( {{\rm{intake}}-{\rm{faecal \ excretion}}} \right)/{\rm{intake}} \times 100.$$
 $${\rm{Body \ N \ retention \ (g/d)}} = {\rm{N\ intake \ (g/d)}}-{\rm{faecal\ N \ (g/d)}}-{\rm{urinary\ N \ (g/d)}}.$$
 $$\hskip20pt{\rm{C}}{{\rm{H}}_{\rm{4}}}\ {\rm{ energy }}\ ({\rm{MJ/d}}) = {\rm{C}}{{\rm{H}}_{\rm{4}}}\ ({\rm{litres/d}}) \times \rm 0\hskip -1pt\cdot\hskip -1pt03957$$
(Reference Brouwer and Blaxter20).
 $$\eqalign{{\rm{Urinary\ energy \ (MJ/d)}} = \rm 0\hskip -1pt\cdot\hskip -1pt0348 \times {\rm{urinary\ carbon \ (g/d)}} \cr + 0\hskip -1pt\cdot\hskip -1pt \rm 009 \times {\rm{urinary\ N \ (g/d)}}$$
(Reference Hoffmann and Klein21).
 $${\rm{Metabolisable\ energy\ (ME;\ MJ/d)}} = {\rm{GE\ intake\ (MJ/d)}} - {\rm{faecal\ energy\ loss\ (MJ/d)}} - {\rm{C}}{{\rm{H}}_{\rm{4}}}\ {\rm{ energy\ loss\ (MJ/d)}} - {\rm{urine\ energy \ loss\ (MJ/d)}}.$$
 $${\rm{Energy\ metabolisability }}\ \left( {{\rm{\% \ of \ GE \ intake}}} \right) = {\rm{ME \ intake\ (MJ/d)/GE \ intake\ (MJ/d)}} \times {\rm{100}}.$$
 $$\eqalign{{\rm{Heat\ energy\ (MJ/d;\ corrected\ for\ assumed\ C}}{{\rm{O}}_{\rm{2}}}\ {\rm{ production}} \cr \ \rm from\ microbial\ fermentation) = {\rm{0\hskip -1pt\cdot\hskip -1pt01618}} \times {\rm{O}}_{\rm{2}}({\rm{l/d}}) \cr \hskip 13pt+ {\rm{0\hskip -1pt\cdot\hskip -1pt00502}} \times [{\rm{CO}}_{\rm{2}}{\rm{ (l/d)}}-{\rm{3}} \times {\rm{C}}{{\rm{H}}_{\rm{4}}}({\rm{ l/d}})]-{\rm{0\hskip -1pt\cdot\hskip -1pt00217}} \cr \hskip 13pt\times {\rm{C}}{{\rm{H}}_{\rm{4}}}{\rm{ (l/d)}}-{\rm{0\hskip -1pt\cdot\hskip -1pt00599}} \times {\rm{urine\ N\ (g/d)}}}$$
(Reference Chwalibog, Jensen and Thorbek22).
 $$\eqalign{{\rm{Body\ energy\ retention\ (MJ/d)}} = \,{\rm{ME\ (MJ/d)}} - {\rm{heat\ energy }}\cr \rm loss \ (MJ/d).}}$$
Statistical analysis
Data analysis was conducted with the statistics software R (version 3.4.1, 2017-06-30)(23) with individual animals as experimental units. Six animals per experimental group were allocated to respiration chamber measurements and total collection of faeces and urine, while the remaining animals served as reserve animals. Feed intake, BW, saliva properties and phenols in blood were also measured in the reserve animals. One animal in the reserve group (goat kid, control group) had kidney stones and had to undergo euthanasia in the middle of the experiment, which reduced the n-size in this experimental group to six. At first, a type III ANOVA with species, diet and dam diet was performed, with all possible two- and three-way interactions. It resulted that the dam diet alone had no significant effect on any of the parameters measured, and the interactions were rarely significant. As with this model also the number of replicates was low, dam diet and interactions associated with dam diet were removed from the final model. The aov function was used to perform a type II ANOVA when data were balanced or a type III ANOVA when data were unbalanced. Where more than one value was obtained per animal, mean values were used for the statistical analysis. Initial BW and BW in the collection period, respectively, were included as co-variables when the average BW, final BW, BW gain, feed intake and feed conversion ratio were analysed. Least square interaction means were statistically compared using Tukey’s method. Tables display least square means.
Results
Chemical composition of the diet
The concentrates offered to the lambs and goat kids in the control and phenol groups had a similar nutrient composition except that, unintentionally, the CP content of the grapeseed-containing concentrate was lower by 24 g/kg compared with the control concentrate (Table 1). The TEP content of the phenol concentrate was eight times higher than that of the control concentrate. This resulted in TEP concentrations of 27·3 g/kg for the PE diet and 9·3 g/kg for the control (C) diet.
Performance, intake and digestibility
There were no differences between diets and animal species in feed intake (Table 2). Across livestock species, the CP intake was overall lower (P < 0·001) in PE-fed animals than C-fed animals (5·28 v. 5·75 g/kg BW per d, respectively). This resulted from the differences in the composition of the concentrate. Across species, TEP intakes were higher (P < 0·001) for PE-fed animals (1·18 v. 0·38 g/kg BW per d in control). There were similar effects on TT intake (0·75 v. 0·03) and CT intake (0·35 v. 0·008; in g/kg BW per d) in PE-fed animals compared with C-fed animals, respectively. The same pattern was found for the 7-d collection period (Table 3). Feed conversion efficiency (Table 2) and water intake (g/kg BW per d; Table 3) did not differ (P > 0·10) between diet groups and animal species. During the collection period, the goats had a slightly lower (P < 0·05) BW compared with the sheep (31·7 v. 35·6 kg, respectively), which was also related to higher (P < 0·001) DM intakes in the sheep compared with the goats (1·41 v. 1·34 kg, respectively, Table 3). However, even when corrected for BW differences intakes of DM, organic matter (OM), NDF and TEP were slightly higher (P < 0·05) in sheep compared with goats (g/kg BW per d: 41·6 v. 40·1; 38·1 v. 36·7; 14·6 v. 13·9 and 0·769 v. 0·747, respectively). The apparent digestibility of OM (P < 0·01) and NDF (P < 0·05) was lower in the PE group compared with control (75·3 v. 78·4 % and 65·4 v. 69·8 %, respectively). Goats excreted urine amounts that were almost twice as high (P < 0·01) as for the sheep (948 v. 512 ml/d, Table 3).
Table 2. Effect of species and diet of lambs and goat kids on performance and intake parameters*
(Least square means and standard errors of the mean)
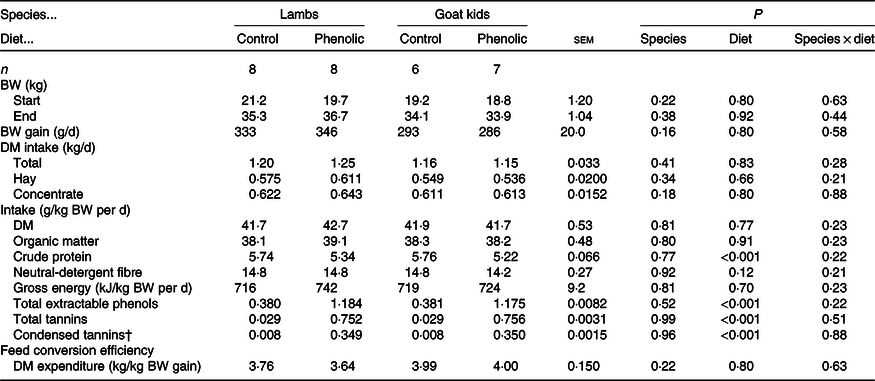
BW, body weight.
* Data obtained during the entire 7-week experimental period.
† Data were log10-transformed for the statistical analysis, but the least square means of the untransformed data are shown in the table.
Table 3. Effect of species and diet of lambs and goat kids on intake and digestibility parameters*
(Least square means and standard errors of the mean)

BW, body weight.
* Data obtained during the 7-d collection period which took place 5 weeks after the start of the treatment feeding.
† Data were log10-transformed for the statistical analysis, but the least square means of the untransformed data are shown in the table.
Methane emission
There was no difference in the absolute methane emissions and in methane emissions relative to BW and intake between the different diet groups or animal species (Table 4).
Table 4. Effect of species and diet of lambs and goat kids on methane emissions*
(Least square means and standard errors of the mean)

BW, body weight.
* Data obtained during 2 × 24 h which took place 5 weeks after the start of the treatment feeding; the mean body weight (BW) from before and after the 7-d collection period.
† BW gain during 7 d of collection period.
‡ Mean intake during the 7-d collection period.
Nitrogen balance
Across species, daily N intake (g/kg BW) and urinary N excretion were lower, and faecal N excretion was higher when the PE diet instead of the control diet was fed (P < 0·001; Table 5). This was influenced by the lower CP content of the phenolic concentrate compared with the control concentrate (Table 1). The faecal N excretion accounted for 445 g/kg of N intake in PE-fed animals compared with 302 g in C-fed animals (P < 0·001). This also resulted in a lower (P < 0·001) apparent N digestibility with PE (55·5 v. 69·8 % with C, respectively) and lower (P < 0·01) body N retention with PE (0·318 v. 0·434 g/kg BW with the C diet). The proportion of urinary N in total excreta N was clearly reduced (P < 0·001) in the PE v. C-fed animals totalling 269 v. 416 g/kg, respectively. The sheep had a higher (P < 0·05) N intake, but a lower urinary N and faecal and urinary N excretion (both P < 0·01) compared with the goats (0·87 v. 0·84, 0·14 v. 0·19 and 0·45 v. 0·52, respectively, all in g/kg BW per d). There was a lower (P < 0·01) proportionate urinary N excretion in lambs compared with goat kids (159 v. 229 g/kg N intake, respectively). The relative body N retention was lower (P < 0·05) in goat kids compared with lambs (383 v. 484 g/kg N intake, Table 5).
Table 5. Effect of species and diet of lambs and goat kids on nitrogen balance parameters*
(Least square means and standard errors of the mean)

BW, body weight.
* Data obtained during the 7-d collection period which took place 5 weeks after the start of the treatment feeding.
† Data were log10-transformed for the statistical analysis, but the least square means of the untransformed data are shown in the table.
Energy balance
There was a trend (P = 0·08 and P = 0·09, respectively) for a lower intake of metabolisable and digestible energy (kJ/kg BW per d) with the PE diet compared with the C diet (Table 6). Faecal energy loss (in kJ/kg BW per d and as a proportion of GE intake) was higher (P < 0·01) in the PE diet compared with the C diet (202 v. 173 kJ/kg BW per d and 283 v. 245 kJ/MJ, respectively). Apparent digestibility and metabolisability (% of GE) were lower (P < 0·01) for the PE diet compared with the C diet. The intakes of GE, digestible energy and metabolisable energy were higher (P < 0·05) for the lambs compared with the goat kids. The heat energy losses were higher in lambs than in goat kids with 279 v. 250 kJ/kg BW (P < 0·01) and with 389 v. 361 kJ/MJ of GE intake (P < 0·05), respectively. There was a slight trend (P = 0·06) for a higher metabolisability in lambs compared with goat kids.
Table 6. Effect of species and diet of lambs and goat kids on energy balance parameters*
(Least square means and standard errors of the mean)

BW, body weight; GE, gross energy; ME, metabolisable energy.
* Data obtained during the 7-d collection period and the 2 d of respiration measurements which took place 5 weeks after the start of the treatment feeding.
Saliva properties
The saliva tannin-binding capacity of quebracho was higher (P < 0·01) in goat kids than in lambs with 47·4 and 32·8 % of the tannin amounts added, respectively (Table 7). No effect was found when the binding capacity was tested with tannic acid. The protein content of saliva was not affected (P > 0·10) by the experimental treatments.
Table 7. Effect of species and diet of lambs and goat kids on saliva traits, as well as phenols in blood and excreta*
(Least square means and standard errors of the mean)

BW, body weight.
* Least square means carrying no common superscript are different at P < 0·05 and are related to the S × D interaction.
† Measured 8 (lambs) and 7 (goat kids) weeks after the start of the treatment feeding.
‡ Data were reciprocally transformed (1/x) for the statistical analysis, but the least square means and sem of untransformed data are shown in the table.
§ Data were log 10-transformed for the statistical analysis, but the least square means and sem of untransformed data are shown in the table and were measured 7 weeks after the start of the treatment feeding.
|| Measured during the 7-d collection period which took place 5 weeks after the start of the treatment feeding.
Phenols in blood, faeces and urine
There were no treatment effects (P > 0·10) on the blood plasma phenol concentration (Table 7). The TEP, TT and hydrolysable tannins concentrations in faeces were higher (P < 0·001) when the animals received the PE diet compared with the C diet (for TEP 14·6 v. 10·8 g/kg DM on average). The same was true for the daily faecal excretion in relation to BW (P < 0·001). The concentration and the excretion of TEP with the faeces were higher in the goats compared with the sheep (13·4 v. 12·0 g/kg DM and 140 v. 118 mg/kg BW per d, respectively). The concentration of CT in faeces did not differ (P > 0·10) between lambs and goat kids fed the control diet but was almost three times higher (P < 0·051) in PE-fed goat kids compared with PE-fed lambs (1·41 v. 0·55 g/kg DM; species × diet interaction, P < 0·001). The same occurred for the daily excretion of CT in relation to BW (interaction, P < 0·001). The interaction was also significant for TT concentrations in faeces and their faecal excretion. The TP concentration in urine (P < 0·01) and the amount of urinary TP (P < 0·05) were higher in the PE-fed animals compared with the C-fed animals (2·1 v. 1·6 g/l and 39·8 v. 32·3 mg/kg BW, respectively). The TP concentration in urine was higher (P < 0·001) in lambs than in goat kids (2·19 v. 1·45 g/l). However, in relation to BW, the urinary TP amount excreted was higher (P < 0·05) in the goat kids compared with the lambs (41·0 v. 31·2 mg/kg BW per d, respectively) which was influenced by the higher daily urine volume of the goats (Table 3).
Discussion
Effect of grapeseed extract in the diet
Body N retention was reduced by feeding the phenolic (PE) diet, but this was apparently not sufficiently pronounced to result in a lower BW gain across the 7 weeks of the experiment. Similarly, the intake was not affected by the phenol addition. Phenols from grapeseed have strong antioxidant properties(Reference Chedea, Braicu and Socaciu24) and can have anti-microbial and anti-viral effects(Reference Pasqua, Simonetti, Rodriguez and Franco Ruiz4), but they did not promote the growth of the healthy lambs and goat kids in the present study. Phenols from quebracho have been shown to improve the antioxidant status of the muscles(Reference Luciano, Monahan and Vasta25) and the plasma and liver(Reference López-Andrés, Luciano and Vasta26) when fed to lambs at a dosage of 89 and 64 g/kg dietary DM, respectively, but this variable was not measured in the present study.
Grapeseed extract has been shown earlier to have methane-mitigating effects, for example, by Wischer et al.(Reference Wischer, Boguhn and Steingaß3) when supplementing 50 g grapeseed extract/kg diet in vitro. Also, other phenols were found effective. Carulla et al. (Reference Carulla, Kreuzer and Machmüller27) and Staerfl et al. (Reference Staerfl, Zeitz and Kreuzer28) described that 40 and 30 g/kg of Acacia mearnsii extract reduced the methane release of lambs and bulls by 13 and 30 %, respectively. Different from that, the PE diet did not mitigate the methane emission in the present study. This result could have been due to the comparably low dosage of the grapeseed extract applied (27 g/kg dietary DM). Similarly, Wischer et al. (Reference Wischer, Greiling and Boguhn29) found no influence on methane production when feeding Castanea sativa and Quercus valonea extracts at 13 and 36 g/kg dietary DM to castrated adult sheep. Methane did not decline in cattle fed a quebracho extract at 20 g/kg dietary DM(Reference Beauchemin, McGinn and Martinez30). The dosage used in the present study was low enough to avoid depressions in feed intake which was also found by Jerónimo et al. (Reference Jerónimo, Alves and Dentinho9) when feeding 25 g grapeseed extract/kg to lambs. In the present experiment, the decline in fibre digestibility with the PE diet, and thus probably the decrease in hydrogen supply from fibre-degrading bacteria to the methanogens(Reference Rother and Krzycki31), was obviously too low to affect methanogensis. It is also possible that the availability of rumen degradable protein was lower in the PE-fed animals through tannin–protein bonds formed in the rumen in addition to the slightly lower CP content of the diet, which could have contributed to the decline in NDF and OM digestibility in the phenolic group as particularly fibre digestion is dependent on rumen degradable protein.
The phenolic diet increased faecal N excretion, manifested in a lower apparent N digestibility. A reduction in the apparent ruminal degradability of N-containing compounds and in ruminal ammonia N formation (an indicator of N digestion in rumen) was found by Wischer et al. (Reference Wischer, Boguhn and Steingaß3) when grapeseed extract was incubated at a dosage of 100 g/kg in vitro. Other phenol sources like the phenolic extracts from Acacia mearnsii bark (40 g/kg)(Reference Carulla, Kreuzer and Machmüller27) as well as from Castanea sativa and Quercus valonea (13 and 36 g/kg dietary DM, respectively)(Reference Wischer, Greiling and Boguhn29) were efficient in reducing apparent N digestibility too. Certain phenols such as tannins are able to bind to dietary proteins, which not only decelerates protein degradation in the rumen but may also lower the absorption of protein in the small intestine(Reference Cortés, Moreno and Pabón32). It seems that in the present experiment, proteins were bound irreversibly to the grapeseed constituents and were excreted with the faeces, as shown by the higher faecal excretion of N and phenols in the animals fed the PE diet. An increase in excretion of metabolic faecal N might be possible, too(Reference Patra33). There was a concomitant decline in urinary N excretion. This was also reported in a number of other studies with sheep or goats testing phenol supplementation via Acacia mearnsii extract (40 g/kg)(Reference Carulla, Kreuzer and Machmüller27), Castanea sativa and Quercus valonea extracts (10 and 40 g/kg)(Reference Wischer, Greiling and Boguhn29) and quebracho extract (20 and 40 g/kg(Reference Al-Kindi, Dickhoefer and Schlecht34)), but also from studies with cattle(Reference Ineichen, Kuenzler and Kreuzer35). However, also the lower N intake of the PE-fed animals contributed to the lower urine N losses. The shift from urinary N to faecal N is especially favourable in situations of dietary N excess, as the shift avoids energy expenditure for metabolising excessive protein to urea in the liver(Reference Huntington and Archibeque36) and helps mitigate N emission from the manure as urinary N is more easily volatilised than faecal N(Reference Lee, Hristov and Cassidy37) thus imposing a higher environmental burden.
The increased urinary TP concentration found in the present study indicates that at least part of the grapeseed phenols were absorbed from the gut. However, no concomitant increase in the plasma TP concentration was observed. In a study by Di Trana et al. (Reference Di Trana, Bonanno and Cecchini38), the plasma total polyphenol concentration was increased when the polyphenol-rich forage Sulla coronarium was fed to goats compared with a mixed hay diet (intake of 8·9 v. 1·5 g polyphenols/d). Stoldt et al. (Reference Stoldt, Derno and Das39) found an increased flavonoid concentration in the blood plasma of cows supplemented with rutin trihydrate at a dose of 100 mg/kg diet. One reason for the lack of effect on the plasma TP concentration in the present study could have been a fast clearance via urine. Gladine et al. (Reference Gladine, Rock and Morand40) showed that between 12 and 21 h after grapeseed extract was given as a single acute dosage (100 g/kg DM intake) directly into the rumen of lambs, the phenol epicatechin occurred in the plasma, and the total antioxidant status of the plasma increased. This indicates the presence of a time pattern as it was also shown in rats administrated radioactively labelled epigallocatechin gallate(Reference Kohri, Matsumoto and Yamakawa41). The remarkably higher faecal excretion of TEP, TT CT, and hydrolysable tannins found in the PE-fed animals in the present experiment illustrates that a large part of the phenols remained undigested. The CT are considered indigestible anyway(Reference Makkar, Becker and Abel42,Reference Makkar, Blümmel and Becker43) . Accordingly, Terrill et al. (Reference Terrill, Waghorn and Woolley44) did not detect radioactively labelled CT in blood which had been administrated into the abomasum of sheep. There may be a conjugation of phenols with glucuronic acid or sulphate, or methylation in the digestive tract. Thereby, phenols may escape their analytical detection in the faeces(Reference Ou and Gu45), an explanation used by Terrill et al. (Reference Terrill, Waghorn and Woolley44) for the lack of complete recovery of CT from feed in faeces, in addition to the assumption that the method the researchers used(Reference Terrill, Rowan and Douglas46) was not suitable to separate CT from other digesta constituents. Robbins et al. (Reference Robbins, Hagerman and Austin47) used a method allowing a faecal recovery of 98 % of quebracho tannins ingested by mule deer and of 75 % in sheep fed quebracho tannins. Still, Hagerman et al. (Reference Hagerman, Robbins and Weerasuriya48) detected only 27 % of the ingested gallic acid in the faeces of deer with a modified Robbins et al. (Reference Robbins, Hagerman and Austin47) method. There may be other routes of use of phenols, not investigated in the present study, that could include their accumulation in body tissue(Reference Ou and Gu45).
As a coping strategy for elevated dietary levels of phenols, some herbivores seem to have the ability to induce production of certain salivary proteins that can bind to dietary phenols and therefore increase the tannin-binding capacity of the saliva. This was demonstrated for rhinoceros(Reference Clauss, Gehrke and Hatt49) and mice(Reference da Costa, Lamy and Capela e Silva50). In the present study, there were no increases in the saliva protein content and the tannin-binding capacity in the animals fed the PE diet for 7 weeks compared with the control animals. Grapeseed extract also did not modify the saliva properties of the dams of the experimental animals used in the present study(Reference Leparmarai, Sinz and Kunz10). These results are supported by other findings, such as a lack of induced production of proline-rich protein by administration of isoprenaline in sheep(Reference Haghighat, Moetamed and Vasegi51) and a lack of differences in the affinity of salivary proteins when tannins were present or absent in the diet of goats(Reference Hanovice-Ziony, Gollop and Landau52).
Differences between lambs and goat kids
The lambs had overall a higher body N retention than the goat kids which was likely the result of a genetically caused higher growth potential of the respective breeds used. In addition, the lambs had a higher heat energy loss at a similar body energy retention than the goat kids. Consistent with these findings, the sheep in the study by Yirga et al. (Reference Yirga, Puchala and Tsukahara53) also had a higher heat production than the goats. However, the type of basal diet seems to be important for the ranking as well. El-Meccawi et al. (Reference El-Meccawi, Kam and Brosh54) found the same heat production in sheep and goats with lucerne hay and a significantly higher heat production of the goats with an Acacia saligna diet. Min & Solaiman(Reference Min and Solaiman55) analysed the influence of tannin supplementation on DM and N digestibility in goats and sheep with linear regression analysis. They found that DM digestibility declined with increasing tannin level in the sheep but not in the goats. Digestibility of N and in vitro ammonia production appeared to decline in sheep and goats, but the reduction was more pronounced in sheep than in goats(Reference Min and Solaiman55). Therefore, these authors(Reference Min and Solaiman55) concluded that ruminal protein degradation of the sheep is influenced to a greater extent by the tannin-rich diet than that of goats which would be consistent with a lower tannin-binding capacity of their saliva (see below). Still, we found no interaction between the species and diet in apparent N digestibility, and even a trend for a higher OM digestibility in sheep (77·8 v. 75·9, respectively, P = 0·07), suggesting that lambs and goat kids reacted rather similarly to the grapeseed extract. Possibly the dosage (17 g CT/kg dietary DM) was too low for that as dosages of up to 120 g CT/kg dietary DM had been included in the evaluation of Min & Solaiman(Reference Min and Solaiman55).
Comparative studies on N balance in sheep and goats feeding (or infusing) tannins resulted in different results(Reference Min and Solaiman55–Reference Perez-Maldonado and Norton57). Perez-Maldonado & Norton(Reference Perez-Maldonado and Norton56,Reference Perez-Maldonado and Norton57) did not identify major differences between sheep and goats in terms of N excretion. Narjisse et al. (Reference Narjisse, Elhonsali and Olsen58), using intraruminally infused tannins extracted from oak leaves, found urinary N losses (% of N ingested) for sheep of 44 and 37 and for goats of 17 and 28 (in the tannin v. control group, respectively), which is in contrast to our results with overall lower proportionate urinary N losses in sheep (13 v. 19) compared with goats (21 v. 25, tannin v. control group, respectively). In the same study(Reference Narjisse, Elhonsali and Olsen58), intake and N retention in sheep were lowered in the tannin group compared with the control group, but not in goats, which led to the conclusion that goats are better able to cope with dietary tannins and that one possible reason might perhaps be species-specific differences in composition or capability of rumen microbes. Some researchers investigated the impact of feeding tanniniferous diets on rumen microbes, mainly in goats (reviewed by Min & Solaiman(Reference Min and Solaiman55)), but comparative studies on sheep and goats on this topic seem to be scarce.
There were no species differences in methane emissions in the present study. In the IPCC report(59), the methane conversion factor (CH4 energy/GE intake; Ym) of lambs was estimated to account for 4·5 (sd 1·0) %. The values of 3·8 % for the lambs and 4·0 % for the goat kids found in the present study fit into this range but were at its lower end. The methane yield was lower compared with other studies, but similar compared with the results (13 g methane/kg DMI, Ym: 4·1 %) found by Thakur et al. (Reference Thakur, Mohini and Tariq60) for goat kids on a diet with a concentrate:forage ratio of 70:30 with similar NDF contents. Avila-Stagno et al. (Reference Avila-Stagno, Chaves and He61) found even lower methane yields in a study with lambs on a concentrate diet with low NDF content.
As expected(Reference Lamy, Rawel and Schweigert8), the tannin-binding capacity of the saliva found in the present study was higher for goat kids than for lambs with CT (quebracho tannins). This was also found for the dams of the lambs and goat kids used in the present study, with overall higher values(Reference Leparmarai, Sinz and Kunz10). Alonso-Díaz et al. (Reference Alonso-Díaz, Torres-Acosta and Sandoval-Castro62) observed that saliva from goats was able to precipitate higher quantities of tannins extracted from tropical tannin-rich plants than sheep saliva. These results indicate that goats have developed mechanisms to cope with, and inactivate part of, the often high phenol concentrations in their diet(Reference Lamy, Rawel and Schweigert8). Sheep do not need such a capability in nature due to their specific dietary niche. The mechanism of phenol inactivation was presumed to consist of the production of proline-rich salivary proteins(Reference Shimada63,Reference Bennick64) . The present study, however, gave no indications of an increased salivary protein content of the goat kids compared with the lambs (the salivary proline content was not analysed). Other salivary proteins might play a role as well(Reference Lamy, da Costa and Santos65).
The faecal CT concentration and excretion in the PE-fed animals were higher for the goat kids than for the lambs suggesting that either CT absorption in the gastrointestinal tract took place or the degradation of phenols by microbes was more pronounced in lambs than in goat kids(Reference Ou and Gu45). It is also possible that the higher protein-binding capacity of the saliva of the goat kids may have led to complexation of the CT from the grapeseed extract and thereby diminished transformation or absorption of the CT. It has to be stated that the butanol-HCl method might not be fully suitable for detecting tannins in faeces when it comes to absolute amounts, as the CT might undergo modifications in the small intestine(Reference Terrill, Waghorn and Woolley44). However, even if this was the case, the relationship and the species differences in faecal CT concentrations should still persist when applying a different analytical method.
Conclusion
In the present study, grapeseed extract was provided at a dosage low enough to avoid adverse effects on the feed intake of lambs and goat kids. One favourable effect was the shift from urinary N to faecal N. The impairment of body protein retention when fed the phenolic diet was a certain drawback. The lack of methane-mitigating efficiency of the grapeseed extract at the level supplemented makes it difficult to find a trade-off between environmental and economic aspects in its use in farm practice. These extracts are still quite expensive and, given there is a certain benefit in terms of increased performance or decrease in negative environmental impacts, would only be a valid option for larger scale farming systems. In this case, the ideal dosage has, therefore, still to be found. The study showed that livestock species differing in defence strategies to cope with dietary phenols, such as tannin-binding capacity of saliva, react differently. In general, goats showed weaker effects on urinary N losses and thus a lower efficiency in reducing N emission potential of the manure compared with sheep, and goat kids fed on the PE diet had higher faecal CT concentration and CT excretion with the faeces compared with PE-fed lambs. The ideal dosage might therefore be species specific.
Acknowledgements
The Swiss National Science Foundation (grant no. 320030_149976) provided financial support. The authors are grateful to C. Kunz, P. Bucher, M. Mergani (ETH Zurich) and H. Barleben (IZW) for their assistance in the laboratory and to H. Renfer, A. Simonett, M. Tschan, R. Müller and M. Bölsterli (Strickhof) and J. Bérard, S. Amelchanka and R. Stoz (AgroVet Strickhof) for their assistance in the animal experiment.
S. M., S. S. and M. K. designed this experiment. S. S. conducted the experiment, performed the statistical analysis and drafted the manuscript. S. M., M. K., P. T. L., A. L. and S. O. contributed in critically revising the manuscript, P. T. L. was responsible for the first part of the experiment, A. L. provided the animals, S. O. did the analysis of the saliva samples. All authors read and approved the final manuscript.
The authors declare that there are no conflicts of interest.


