


Introduction
The fossil record of chondrichthyans from the Florida Platform has been a major gap in paleodiversity studies. Despite its informal title of “Shark Tooth Capital of the World” (Draper Reference Draper2020) and active collecting by avocational paleontologists, Florida's chondrichthyan fossil record has received little attention from professional paleontologists. In fact, the first comprehensive review of the chondrichthyan fossil record from Florida was done by Tessman (Reference Tessman1969) for his master's thesis, of which only a small portion was published (Webb and Tessman Reference Webb and Tessman1968). The only published review of Florida's chondrichthyan fossil record was included in Hulbert (Reference Hulbert2001), in which 41 taxa were recognized, represented by 7 orders, 15 families, and 22 genera. However, 77 chondrichthyan taxa were cataloged in the Florida Museum of Natural History (FLMNH) vertebrate paleontology database as of September 2019. As such, this article aims to evaluate the accuracy and completeness of Florida's chondrichthyan fossil record, based on specimens in the FLMNH collection, by addressing three research questions:
1. What chondrichthyan taxa inhabited the Florida Platform during the Eocene through the Pleistocene?
2. How did chondrichthyan diversity on the Florida Platform change from the Eocene through the Pleistocene?
3. What factors were responsible for the observed changes in chondrichthyan diversity?
MacFadden (Reference MacFadden2017) stated that sharks comprise approximately 5%–10% of the FLMNH vertebrate paleontology collection and indicated that most research on chondrichthyans has been driven by graduate students. Further, previous reports of chondrichthyans from the fossil record of Florida are predominantly anecdotal or descriptive, with little focus on diversity patterns through time (Webb and Tessman Reference Webb and Tessman1968; Patton Reference Patton1969; Tessman Reference Tessman1969; Stoutamire Reference Stoutamire1975; Webb et al. Reference Webb, MacFadden and Baskin1981; Scudder et al. Reference Scudder, Simons and Morgan1995; Hulbert Reference Hulbert2001; Renz Reference Renz2002; Brown Reference Brown2008; Simons et al. Reference Simons, MacKenzie and Hulbert2014; Soto and MacFadden Reference Soto and MacFadden2014; Soto Reference Soto2015; Boyd Reference Boyd2016; Perez and Marks Reference Perez and Marks2017). In contrast, this study aims to analyze patterns in chondrichthyan diversity throughout the surficial geologic record of the Florida Platform. Diversity patterns are interpreted through three lenses: abiotic factors (e.g., climate), biotic factors (e.g., ecomorphological adaptations), and sampling bias (e.g., collection effort and lithologic controls).
Despite the paucity of publications on chondrichthyan fossils from Florida, specimen records are freely available and easily accessible on the FLMNH vertebrate paleontology database (www.floridamuseum.ufl.edu/vertpaleo-search). These occurrences are also shared with two global data aggregators: Global Biodiversity Information Facility (GBIF) and Integrated Digitized Biocollections (iDigBio). Consequently, these data aggregators are subject to every source of sampling bias that exists in the museum collections from which the data are derived.
Previous studies have found a positive correlation between the number of marine formations and genus-level diversity at the resolution of geologic epoch and stage (Peters and Foote Reference Peters and Foote2001, Reference Peters and Foote2002). Marine biodiversity also varies spatially, specifically with reefs being associated with high biodiversity (Close et al. Reference Close, Benson, Saupe, Clapham and Butler2020). These factors result in sampling issues that may bias our interpretation of chondrichthyan paleodiversity (Friedman and Sallan Reference Friedman and Sallan2012). Further, Guinot et al. (Reference Guinot, Adnet and Cappetta2012) determined that there is a globally poor selachian fossil record for lower taxonomic ranks (i.e., genera and families), but the fossil record is rather complete at the ordinal level. Pimiento and Benton (Reference Pimiento and Benton2020) found that the fossil record of extant elasmobranchs is complete at the order and family level over the last 23 Myr but is more affected by the pull of the Recent at the generic and specific level than other taxonomic groups.
These former studies illustrate that actual biological patterns in marine paleodiversity may be obscured by the rock record available, the spatial extent of the study, and/or the taxonomic resolution being analyzed. However, shorter-term studies that focus on specific time intervals of interest (e.g., extinction and climatic events) can better account for sampling biases, allowing for more accurate and meaningful results (Kriwet and Benton Reference Kriwet and Benton2004; Sallan and Coates Reference Sallan and Coates2010; Bazzi et al. Reference Bazzi, Kear, Blom, Ahlberg and Campione2018, Reference Bazzi, Campione, Ahlberg, Blom and Kear2021). One particular event of interest possibly captured within the temporal range of this study is a notable transition in the dominant chondrichthyan order in nearshore environments. Today, sharks within the order Carcharhiniformes are the most abundant and diverse group of cartilaginous fish in nearshore environments (Compagno et al. Reference Compagno, Dando and Fowler2005). However, during the Cretaceous and into the Paleogene, sharks belonging to the order Lamniformes were the most abundant and diverse taxonomic group (Maisch et al. Reference Maisch, Becker, Raines and Chamberlain2014; Cappetta and Case Reference Cappetta and Case2016; Bazzi et al. Reference Bazzi, Kear, Blom, Ahlberg and Campione2018, Reference Bazzi, Campione, Ahlberg, Blom and Kear2021).
Based on a synthesis of previous publications on chondrichthyans from the Atlantic and Gulf Coastal Plains, Maisch et al. (Reference Maisch, Becker, Raines and Chamberlain2014) suggested that carcharhiniform sharks became the dominant order of chondrichthyans during the middle Eocene. In agreement with this conclusion, Ebersole et al. (Reference Ebersole, Cicimurri and Stringer2019) described chondrichthyans from the middle Eocene of Alabama, reporting 10 lamniform genera and 13 carcharhiniform genera, indicating that carcharhiniforms were more taxonomically diverse. However, in contrast, Cappetta and Case (Reference Cappetta and Case2016) described 4570 chondrichthyan specimens from the middle Eocene Lisbon Formation (Claibornian Stage) in Alabama, in which lamniform sharks were the most taxonomically diverse and abundant order (10 genera representing 56.5% of the sample) versus carcharhiniform sharks (8 genera representing 27.2% of the sample). It is unclear whether this discrepancy reflects differences in the accepted taxonomy between the authors, sampling methods, or possibly a regional variation in the timing of this transition. As such, the timing and cause of this pivotal transition in chondrichthyan biodiversity is not fully resolved.
Guinot et al. (Reference Guinot, Adnet and Cappetta2012) stated that no major biotic/abiotic crises have been reported to explain the series of late Eocene to Oligocene selachian generic extinctions; however, they proposed that there may be a positive correlation between temperatures and selachian diversity. At least four major climatic events occurred during the deposition of Florida's surficial geologic record: the Eocene–Oligocene transition (EOT), the middle Miocene climatic optimum (MMCO), the early Pliocene warming event, and the late Pleistocene glaciations (Zachos et al. Reference Zachos, Pagani, Sloan, Thomas and Billups2001, Reference Zachos, Dickens and Zeebe2008; Miller et al. Reference Miller, Browning, Schmelz, Kopp, Mountain and Wright2020; Westerhold et al. Reference Westerhold, Marwan, Drury, Liebrand, Agnini, Anagnostou, Barnet, Bohaty, De Vleeschouwer, Florindo and Frederichs2020). Disentangling the role of abiotic factors, biotic factors, and sampling bias in driving diversity patterns within the Florida Platform necessitates an understanding of the interplay between Florida's geologic record and global climate.
Florida Geology and Global Climate
Florida has a surficial geologic record of nearshore marine strata bearing chondrichthyan fossil remains from the Eocene through the Pleistocene (Fig. 1). During the Eocene and early Oligocene, most of Florida was a shallow, submerged carbonate platform isolated from terrestrial environments to the north by a deepwater connection between the Gulf of Mexico and the Atlantic Ocean (i.e., the Suwannee Channel) (Chen Reference Chen1965; Popenoe et al. Reference Popenoe, Henry and Idris1987; Randazzo Reference Randazzo, Randazzo and Jones1997). This deepwater channel suppressed deposition of terrigenous siliciclastics, allowing for the carbonate accumulation that formed the Florida Platform (McKinney Reference McKinney1984; Randazzo Reference Randazzo, Randazzo and Jones1997; Fig. 2A). Eocene deposition of the Florida Platform occurred during a global greenhouse climate, coinciding with the mid-Eocene climatic optimum (Zachos et al. Reference Zachos, Dickens and Zeebe2008).

Figure 1. Composite stratigraphy of the 21 formations bearing chondrichthyan fossils in Florida, sorted into 12 time bins.

Figure 2. Lithologic evolution of the Florida Platform based on Randazzo (Reference Randazzo, Randazzo and Jones1997). These graphics illustrate a simplified model of the gradual transition from carbonate-dominated to siliciclastic-dominated lithology. The extent of terrigenous siliciclastics was roughly approximated and does not reflect an exact paleoshoreline. A, During the Eocene, the Suwannee Channel inhibited southern transport of terrigenous siliciclastics, resulting in carbonate production on the Florida Platform. B, In the Oligocene, the Suwannee Channel was replaced with a shallow epeiric sea, known as the Gulf Trough, allowing terrigenous siliciclastics to accumulate on the eastern side of the Florida Platform. C, During the Miocene, the Gulf Trough was infilled with siliciclastics, resulting in a greater influx of siliciclastics from the north onto the Florida Platform.
The Avon Park Formation is the oldest geologic unit exposed at Florida's surface, with a middle Eocene age based on foraminiferal biostratigraphy (Bowen Powell Reference Bowen Powell2010). The Avon Park Formation is composed of well-cemented limestones and dolostones (Randazzo Reference Randazzo, Randazzo and Jones1997). Based on co-occurrences of Fallotella cookei, Fallotella floridana, and subspherical Alveolina, it was hypothesized that the Avon Park Formation was deposited in the upper photic zone (less than 40 m) of the inner shelf (Vecchio and Hottinger Reference Vecchio and Hottinger2007; Bowen Powell Reference Bowen Powell2010). The Florida Geological Survey currently recognizes the Ocala Limestone as a middle to late Eocene formation composed of two lithofacies (Scott et al. Reference Scott, Campbell, Rupert, Arthur, Green, Means, Missimer, Lloyd, Yon and Duncan2001; Cotton et al. Reference Cotton, Eder and Floyd2018). Based on the foraminiferal assemblage, it was postulated that the Ocala Limestone was deposited in the deeper upper photic zone (40–120 m) on the outer shelf to slope (Vecchio and Hottinger Reference Vecchio and Hottinger2007; Bowen Powell Reference Bowen Powell2010).
The Oligocene marks an abrupt change in global climate (i.e., the EOT) and a gradual transition in the dominant lithology of Florida. Westerhold et al. (Reference Westerhold, Marwan, Drury, Liebrand, Agnini, Anagnostou, Barnet, Bohaty, De Vleeschouwer, Florindo and Frederichs2020) characterized this as a transition from a global “warmhouse” to “coolhouse” climatic state, associated with a massive increase of continental ice volume in Antarctica that established a unipolar glacial state. A combination of global cooling and ice growth resulted in an initial sea level drop of ~20 m, followed by an additional ~50–60 m drop solely tied to ice growth (Houben et al. Reference Houben, van Mourik, Montanari, Coccioni and Brinkhuis2012). Meanwhile, sediment production increased to the north due to renewed uplift of the Appalachian Mountains (Stuckey Reference Stuckey1965; Randazzo Reference Randazzo, Randazzo and Jones1997; Missimer and Maliva Reference Missimer and Maliva2017). The combination of lower sea level and increased sediment production caused the Suwannee Channel to gradually disappear; however, an epeiric sea known as the Gulf Trough remained and limited the influx of siliciclastic sediments to the eastern side of the Florida Platform (Randazzo Reference Randazzo, Randazzo and Jones1997). There is a gradational contact between the Eocene Ocala Limestone and the Oligocene Suwannee Limestone (Randazzo Reference Randazzo, Randazzo and Jones1997; Fig. 2B). The invertebrate fauna of the Suwannee Limestone indicates a middle- to outer-shelf marine depositional environment (Bowen Powell Reference Bowen Powell2010). The Marianna Limestone, deposited in the Florida Panhandle and expanding into Alabama, is contemporaneous with the Suwannee Limestone and represents a shallow, neritic environment (Echols and Schaeffer Reference Echols and Schaeffer1960; Scott et al. Reference Scott, Campbell, Rupert, Arthur, Green, Means, Missimer, Lloyd, Yon and Duncan2001; Scott Reference Scott, Buster and Holmes2011).
As sea level continued to recede throughout the Oligocene, the carbonate Florida Platform became aerially exposed and subject to physical and chemical weathering (Randazzo Reference Randazzo, Randazzo and Jones1997). Dissolution of the carbonate platform resulted in the karstification of Florida and non-formational deposition in sinkholes. The oldest terrestrial fossils from Florida were recovered from a sinkhole deposit discovered during the construction of the I-75 interstate southwest of Gainesville (Patton Reference Patton1969). Based on the land mammals recovered, this site was ascribed to the Whitneyan North American Land Mammal Age (NALMA), approximately 31–30 Ma (Patton Reference Patton1969; Hulbert Reference Hulbert2001; Prothero and Emery Reference Prothero, Emery and Woodburne2004; Czaplewski and Morgan Reference Czaplewski, Morgan, Gunnell and Simmons2012; Morgan et al. Reference Morgan, Czaplewski and Simmons2019). Chondrichthyan fossils were also reported from the I-75 site, but it is unclear whether these specimens are coeval with the terrestrial fossils or reworked (Patton Reference Patton1969).
The combination of eustatic sea-level drop, regional effects on sediment supply, and current intensification resulted in unconformities of varying duration across the Florida Platform. Guertin et al. (Reference Guertin, Missimer and McNeill2000) showed an increase in the hiatal gaps along the sequence boundary between the Suwannee Limestone and the Arcadia Formation from the platform interior to the platform margin. The Arcadia Formation is composed of mixed carbonate and phosphatic siliciclastic sediments, which become increasingly rich in phosphates and siliciclastics from the late Oligocene to the middle Miocene (Fig. 2C). Strontium isotope values derived from bivalves and oysters in the Arcadia Formation correspond to an age range of ~26.5–12.4 Ma, with older ages to the north and younger ages to the south (Missimer Reference Missimer1997; Guertin et al. Reference Guertin, Missimer and McNeill2000). The fauna of the Arcadia Formation suggests a nearshore, marginal marine paleoenvironment. The Parachucla Formation, deposited in the Florida Panhandle, was also a nearshore, marginal marine deposit that spanned from the latest Oligocene into the early Miocene (Arikareean NALMA; Zullo and Portell Reference Zullo and Portell1991; MacFadden and Morgan Reference MacFadden and Morgan2003). Both the Arcadia and Parachucla Formations are considered part of the poorly defined Hawthorn Group.
Global temperature ramped up during the middle Miocene, resulting in the largest warming event of the Neogene, known as the Middle Miocene Climatic Optimum (Zachos et al. Reference Zachos, Dickens and Zeebe2008). Chondrichthyan remains have been recovered from four formations that overlap with the MMCO: Arcadia, Chipola, Marks Head, and Torreya Formations. Vokes (Reference Vokes1989) described the molluscan fauna of the Chipola Formation as a typical tropical fauna, extending from the Florida Panhandle into Alabama. However, the age of the Chipola Formation is debated, with estimates of 17.8–14.1 Ma based on He-U dates (Bender Reference Bender1973) and estimates of 18.9–18.3 Ma based on strontium isotopes (Bryant et al. Reference Bryant, MacFadden and Mueller1992). The Marks Head Formation is composed of complexly interbedded carbonates and phosphatic siliciclastics, and outcrops in northern Florida (Braunstein et al. Reference Braunstein, Huddlestun and Biel1988; Scott Reference Scott, Randazzo and Jones1997, Reference Scott, Buster and Holmes2011). The Torreya Formation outcrops in the Florida Panhandle and continues into Georgia (Scott et al. Reference Scott, Campbell, Rupert, Arthur, Green, Means, Missimer, Lloyd, Yon and Duncan2001; Scott Reference Scott, Buster and Holmes2011; Soto Reference Soto2015). The Chipola Formation was placed within the Alum Bluff Group, whereas the Arcadia, Marks Head, and Torreya Formations were placed within the Hawthorn Group (Scott et al. Reference Scott, Campbell, Rupert, Arthur, Green, Means, Missimer, Lloyd, Yon and Duncan2001; Scott Reference Scott, Buster and Holmes2011). The Torreya Formation was dated as 19–15.3 Ma, based on a correlation of strontium isotopes derived from mollusks, magnetostratigraphy, and biostratigraphy, with an age of 15.9–15.3 Ma for the Dogtown Member of the Torreya Formation (MacFadden et al. Reference MacFadden, Bryant and Mueller1991; Bryant et al. Reference Bryant, MacFadden and Mueller1992). Chondrichthyans recovered from the Dogtown Member of the Torreya Formation were described by Soto (Reference Soto2015).
Following the peak of the MMCO, climate begins to cool during what is referred to as the middle Miocene climatic transition, spanning from ~16 to 13 Ma. This transition corresponded with the stabilization and expansion of the East Antarctic ice sheet and a change in global ocean dynamics (Flower and Kennett Reference Flower and Kennett1994). From ~16 to 15 Ma there was a period of deep-sea erosion throughout the Caribbean, which indicates a disruption of the circum-equatorial circulation, resulting in a northward deflection of deep currents and/or intensification of the Gulf Stream (Keller and Barron Reference Keller and Barron1983). Erosion driven by the strengthening of currents along the southeastern margin of the Florida Platform correlates with the upper sequence boundary in the Arcadia Formation at ~16 Ma (Guertin et al. Reference Guertin, Missimer and McNeill2000).
Above this unconformity, the middle to late Miocene marine record of Florida is represented by three additional formations in the Hawthorn Group: the Coosawhatchie, Statenville, and Peace River Formations (Scott et al. Reference Scott, Campbell, Rupert, Arthur, Green, Means, Missimer, Lloyd, Yon and Duncan2001; Scott Reference Scott, Buster and Holmes2011). The Coosawhatchie Formation overlies the Marks Head Formation and is lithologically distinct in being predominantly composed of phosphate-rich quartz sand and clay (Scott Reference Scott, Randazzo and Jones1997). Chondrichthyan fossils from the Gainesville, FL, creeks have been attributed to the Coosawhatchie Formation and were described by Boyd (Reference Boyd2016). The Statenville Formation outcrops in northernmost Florida, overlying the Marks Head Formation and the lower portion of the Coosawhatchie Formation in different places (Scott Reference Scott, Randazzo and Jones1997). The Peace River Formation overlies the Arcadia Formation in southern Florida and is composed primarily of phosphate-rich siliciclastics (Scott Reference Scott, Randazzo and Jones1997). The geologic unit previously referred to as the Bone Valley Formation is recognized as the Bone Valley Member of the Peace River Formation by the Florida Geological Survey (Scott et al. Reference Scott, Campbell, Rupert, Arthur, Green, Means, Missimer, Lloyd, Yon and Duncan2001; Scott Reference Scott, Buster and Holmes2011). The Peace River Formation has been dated as having two subunits, a late Miocene unit (~11–8.5 Ma) and an early Pliocene unit (~5.2–4.3 Ma), based on biostratigraphy, strontium isotopes, and magnetostratigraphy (Guertin Reference Guertin1998; Guertin et al. Reference Guertin, McNeill, Lidz and Cunningham1999, Reference Guertin, Missimer and McNeill2000). The hiatus within the Peace River Formation corresponds with the Messinian crisis (~6 Ma), which is characterized by an abrupt eustatic regression (Missimer and Maliva Reference Missimer and Maliva2017).
Chondrichthyans were also reported in the late Miocene Alachua Formation from the Love Bone Bed (Webb et al. Reference Webb, MacFadden and Baskin1981). The Love Bone Bed was described as a predominantly terrestrial site, with estuarine and freshwater components, in the Clarendonian NALMA (~9.5–9 Ma). It was suggested that the chondrichthyan fossils were contemporaneous with the terrestrial fauna due to their pristine preservation (Webb et al. Reference Webb, MacFadden and Baskin1981). However, it seems plausible that the chondrichthyan fossils were reworked from the marine Coosawhatchie Formation or an undescribed marine Miocene deposit. The recently discovered Montbrook fossil site in Levy County also preserves a predominantly terrestrial fauna, with mixed estuarine and freshwater components, in the late Hemphillian NALMA (~5.5–5 Ma; Hulbert Reference Hulbert2018; Steadman and Takano Reference Steadman and Takano2019; Ziegler Reference Ziegler2019). The Montbrook fossil site preserves abundant, pristine chondrichthyan fossils; however, the faunal composition indicates that at least some of the specimens were reworked into the fluvio-estuarine deposit.
The early Pliocene warming event (~4.5–3 Ma) marked another global climate perturbation, in which global temperatures were ~3°C warmer than today, sea level was 10 to 20 m higher, and there was enhanced thermohaline circulation (Ravelo and Andreasen Reference Ravelo and Andreasen2000; Ravelo et al. Reference Ravelo, Andreasen, Lyle, Lyle and Wara2004). Emslie (Reference Emslie1998) showed that a 10 to 20 m rise in sea level would result in a loss of 53.3% to 71.4% of terrestrial area in Florida. Westerhold et al. (Reference Westerhold, Marwan, Drury, Liebrand, Agnini, Anagnostou, Barnet, Bohaty, De Vleeschouwer, Florindo and Frederichs2020) characterized the global cooling during the Pliocene as a transition from a “coolhouse” to “icehouse” climate state, associated with the establishment of a bipolar glacial state.
The Pliocene chondrichthyan record of Florida is preserved in the aforementioned Peace River and Tamiami Formations. Chondrichthyans from the Pliocene portion of the Peace River Formation were described by Webb and Tessman (Reference Webb and Tessman1968). Chondrichthyan fossils from Sarasota County described by Perez and Marks (Reference Perez and Marks2017) were tentatively assigned to the Tamiami Formation. The presence of chondrichthyans in the Tamiami Formation was also mentioned by Morgan and Pratt (Reference Morgan and Pratt1983). The geologic age ascribed to the chondrichthyans described by Webb and Tessman (Reference Webb and Tessman1968) and Perez and Marks (Reference Perez and Marks2017) was based on biostratigraphic correlations of land mammal occurrences within these predominantly marine deposits. Strontium isotopic geochronology dated the entire Tamiami Formation as 4.95–1.95 Ma (Missimer Reference Missimer, Scott and Allmon1992).
Global climate continued to cool transitioning into the Pleistocene, which has been associated with increased primary productivity caused by wind-driven upwelling (Marlow et al. Reference Marlow, Lange, Wefer and Rosell-Melé2000). The Pleistocene is also characterized by high-amplitude glacial–interglacial cycles associated with the Milankovitch orbital cycles (Marlow et al. Reference Marlow, Lange, Wefer and Rosell-Melé2000; Elderfield et al. Reference Elderfield, Ferretti, Greaves, Crowhurst, McCave, Hodell and Piotrowski2012). Chondrichthyans are known from the Caloosahatchee, Jackson Bluff, Nashua, Bermont, Anastasia, and Fort Thompson Formations in Florida. However, in the peer-reviewed literature, Pleistocene chondrichthyans from Florida have only been mentioned from the Bermont Formation of the Leisey Shell Pit (Morgan and Hulbert Reference Morgan and Hulbert1995).
Materials and Methods
Herein, chondrichthyan paleodiversity patterns throughout the surficial geologic record of the Florida Platform are evaluated based on specimen records from the FLMNH vertebrate paleontology collection's Specify database. Chondrichthyan specimen records were downloaded on 16 September 2019, at which time there were 117,449 chondrichthyan specimens from the Eocene through the Pleistocene of Florida cataloged (Supplemental Table 1). This sample of 117,449 chondrichthyan fossils included teeth, dermal denticles, caudal spines, vertebral centra, and other rare instances of cartilage preservation.
Specimen records were reviewed for accuracy before any analyses. Taxonomic names were updated, primarily following Cappetta (Reference Cappetta2012). Updates to taxonomy from the original Specify database records included synonymizing Negaprion brevirostris (= Negaprion eurybathrodon), Physogaleus contortus (= Galeocerdo contortus), Hemipristis curvatus (= Hemipristis wyattdurhami), Otodus chubutensis (= Carcharocles subauriculatus), Otodus angustidens (= Carcharocles sokolovi), Macrorhizodus praecursor (= Isurus praecursor), and Aetomylaeus (= Pteromylaeus). Taxa that were obviously assigned an incorrect geologic age were removed from the dataset (e.g., Otodus megalodon from the Pleistocene). Among the initial sample of 117,449 chondrichthyan specimens, 77 taxa were originally cataloged in the FLMNH Specify database. After updating the taxonomy, reidentifying, and removing erroneous records, a total of at least 70 taxa were recognized. These taxa comprise 56 sharks and 14 rays, representing 10 orders, 26 families, and 42 genera (Supplemental Table 2).
Within the Specify database, there are data entry fields for chronostratigraphy, lithostratigraphy, and biostratigraphy that constrain the temporal range of the fossils. The best temporal resolution recorded in the Specify database that still maintained most of the sample was a combination of Gulf Coast stage (i.e., chronostratigraphy) and NALMA (i.e., biostratigraphy). These two chronologies are combined as a single field in the FLMNH vertebrate paleontology Specify database. Before the first occurrence of a terrestrial mammal in Florida, Gulf Coast stages are used to define the age of vertebrate fossil sites. Namely, the Avon Park Formation is placed within the Claibornian Stage, the Ocala Limestone is placed within the Jacksonian Stage, and the Suwannee Limestone is placed in the Vicksburgian Stage. The Claibornian Stage corresponds closely with the Lutetian and Bartonian European Stages. The Jacksonian Stage corresponds closely with the Priabonian European Stage. The Vicksburgian Stage corresponds closely with the Rupelian European Stage. For a more detailed discussion on Gulf Coast stages, see Siesser (Reference Siesser1984). Following the first occurrence of terrestrial mammalian fossils in the Oligocene I-75 site, the FLMNH begins to define vertebrate fossil sites by their land mammal age. In Florida, terrestrial mammalian fossils commonly occur in marine Neogene deposits, so the practice of defining sites by NALMAs has been one of the primary tools for dating chondrichthyan fossils.
A total of 12 time bins were defined based on the combination of Gulf Coast stage and NALMA (Table 1). There were 107,698 chondrichthyan specimens with sufficient temporal data to be placed in these time bins. However, there is overlap between the time encompassed in the Vicksburgian Stage and the Whitneyan NALMA. Consequently, part of the Suwannee Limestone likely falls within the Whitneyan NALMA, but no terrestrial mammals have been found in the Suwannee Limestone to verify this. As such, the Whitneyan time bin does not entirely reflect the Whitneyan NALMA, but rather only refers to the single site in which Whitneyan land mammals have been recovered in Florida. It is possible that some specimens collected from phosphate mines or in fluvial settings may have been reworked from older geologic units.
Table 1. Temporal ranges for the 12 time bins. Associated metrics that may relate to sampling bias for each time bin: time elapsed, sample size, number of sites, and number of formations. NALMA, North American Land Mammal Age.

After the specimen records were sorted into the 12 time bins, the 107,698 specimens included 8 orders, 24 families, and 39 genera. The three genera that did not have sufficient temporal data included Isistius, Heterodontus, and Mustelus. These taxa were originally only found at a single site in Sarasota County known as Cookiecutter Creek; however, additional representatives of Mustelus have since been found at the Montbrook site in Levy County while this article was in preparation. Cookiecutter Creek mixes multiple stratigraphic layers, although the chondrichthyan remains are thought to originate from the Tamiami Formation (Perez and Marks Reference Perez and Marks2017). Thus, specimens from Cookiecutter Creek could fall into the Hemphillian or Blancan time bin (Fig. 1). Given the poor temporal constraint, taxa from Cookiecutter Creek are not included in the diversity analyses. Isistius and Heterodontus are the only representatives of their respective orders, Squaliformes and Heterodontiformes, in the FLMNH collection. Consequently, neither of these orders were represented in the quantitative stratigraphic analyses but were undoubtedly present in the Florida fossil record.
After the taxonomy was updated and erroneous records were removed, randomized species accumulation curves (i.e., rarefaction curves) were made for each time bin to analyze the completeness of sampling. These curves were created using the function specaccum (file name, method="random", permutations = 1000) within the vegan package (Oksanen et al. Reference Oksanen, Blanchet, Kindt, Legendre, O'Hara, Simpson, Solymos, Stevens and Wagner2010) in the program RStudio v. 3.6.3 (R Development Core Team 2012). Rarefaction curves used sample size as the proxy for collecting effort (i.e., individual based), rather than the number of sites or formations (i.e., sample based). The number of collecting days could not be verified with the information available in the Specify database. A summary of different sampling metrics for each time bin is provided in Table 1. Rarefaction curves illustrate the logarithmic relationship between sample size and taxonomic richness. Instances in which the rarefaction curves reach a plateau indicate that sampling is relatively complete and that additional taxa are unlikely to be recovered with continued sampling effort. Alternatively, rarefaction curves that maintain a steep slope indicate that sampling is incomplete and additional taxa are likely to be recovered with continued sampling effort.
To further illustrate the logarithmic relationship between sample size and taxonomic richness across the temporal range of this study, the number of genera and number of families were plotted with sample size. Correlation between taxonomic richness and sample size was calculated at the genus and family levels. Because former studies have found that the chondrichthyan fossil record is relatively complete at the ordinal level (e.g., Guinot et al. Reference Guinot, Adnet and Cappetta2012; Pimiento and Benton Reference Pimiento and Benton2020), the relative abundance of chondrichthyan orders across the 12 time bins was also plotted to analyze patterns in higher-level taxonomy. More specifically, this analysis of chondrichthyan orders was conducted to determine whether this sample captured the transition from a lamniform- to carcharhiniform-dominated chondrichthyan fauna, despite uneven sampling across time bins.
Alpha diversity was measured at the genus level using two different indices: Shannon H and Chao1 (Table 2). The Shannon H index accounts for richness and evenness of taxa (Shannon Reference Shannon1948); whereas Chao1 is more heavily based on richness and attempts to account for rarer taxa that are poorly represented in the sample (Chao Reference Chao1984). These diversity indices were calculated using the statistical software PAST3 (Hammer et al. Reference Hammer, Harper and Ryan2001). Diversity indices were calculated by bootstrapping percentiles with 10,000 iterations to compute 95% confidence intervals around the mean for each time bin. The range of error around the mean value for each time bin offers another indication of where sampling is most complete, with a smaller range of error corresponding with more complete sampling. A total of 95,944 specimens were identified to the genus level and had sufficient temporal data to be included in these analyses (Supplemental Table 3).
Table 2. Taxonomic and ecomorphological richness data for the 12 time bins. Alpha diversity indices were calculated at the genus-level in PAST3 (Hammer et al. Reference Hammer, Harper and Ryan2001). NALMA, North American Land Mammal Age.

The ecological significance of these diversity patterns was interpreted using two proxies: dentition types (based on Kent Reference Kent1994) and ecomorphotypes (based on Compagno Reference Compagno1990). Dentition types represent a qualitative classification scheme based on tooth morphology, in which a tooth is assigned a single function that corresponds with a dietary adaptation (Table 3). Undoubtedly, individual shark teeth may have multiple functions; however, this classification scheme attempts to define a tooth by a singular, primary function. Functional types include cutting, grasping, clutching, crushing, and filter feeding (Table 3). Dentitions may include one functional type (i.e., homodont) or multiple functional types (i.e., heterodont). Individuals represented by isolated teeth are assigned a dentition type based on known associated dentitions of the same taxon or based on related living analogues. For example, an isolated upper tooth of Carcharhinus would typically be defined as a cutting-type tooth; however, based on most extant species of Carcharhinus, a cutting-grasping dentition type can be inferred. The relative abundance of dentition types in each time bin was plotted to interpret patterns in functional morphology through time. These patterns were then compared with those observed in the relative abundance of chondrichthyan orders through time to offer a possible explanation for the transition from a lamniform- to carcharhiniform-dominated fauna.
Table 3. Description of chondrichthyan dentition types and their corresponding feeding behavior, based on Kent (Reference Kent1994).

Compagno (Reference Compagno1990) defined chondrichthyan ecomorphotypes as groupings of taxa based on similar morphology, habitat, and behavior. These groupings may not correspond with phyletic relationships, as taxa that have convergently evolved similar ecomorphological adaptations are grouped together. Within this classification scheme, there were 27 unique ecomorphotypes proposed by Compagno (Reference Compagno1990: table 1) in an attempt to qualitatively organize the multivariate relationship between form and function. Assigning these ecomorphotypes to fossil taxa requires assumptions regarding their external anatomy and behavior, which are not verifiable by the dental records that predominantly characterize the chondrichthyan fossil record. However, the patterns observed from these analyses may serve as testable hypotheses for future research endeavors.
Results
The vertebrate paleontology collection at the Florida Museum consists of at least 70 different chondrichthyan taxa, representing 10 orders, 26 families, and 42 genera (Supplemental Table 2). Among these 70 taxa, 20 represent first occurrences for the Florida fossil record, including: Hexanchus griseus, Heterodontus sp., Rhincodon sp., Alopias vulpinus, Carcharoides catticus, Jaekelotodus trigonalis, Parotodus benedenii, cf. Cetorhinus sp., Scyliorhinidae indet., Galeorhinus sp., cf. Mustelus sp., Hemipristis curvatus, Isogomphodon acuarius, Sphyrna lewini, Sphyrna tiburo, Pristis lathami, Rhinobatos sp., cf. Mobula hypostoma, cf. Mobula birostris, and Plinthicus stenodon. Selachians are represented by seven orders, and batoids are represented by three orders.
Carcharhiniformes is the most abundant and taxonomically diverse chondrichthyan order in the Florida fossil record, with 29 taxa accounting for nearly 65% of the total sample (examples shown in Fig. 3). The 29 carcharhiniform taxa belong to 5 families (i.e., Scyliorhinidae, Triakidae, Hemigaleidae, Carcharhinidae, and Sphyrnidae) and 11 genera (i.e., Scyliorhinidae indet., Galeorhinus, Mustelus, Hemipristis, Galeocerdo, Physogaleus, Negaprion, Isogomphodon, Carcharhinus, Rhizoprionodon, and Sphyrna). These taxa are assigned to six different dentition types and nine different ecomorphotypes (Supplemental Table 2).

Figure 3. Order Carcharhiniformes: A–E, Scyliorhinidae: A–C, UF 496795, lingual, labial, and basal views, Miocene Hawthorn Group; D, E, UF 516838, lingual and labial views, Mio-Pliocene Tamiami Formation. F, G, Galeorhinus sp., UF 434684, lingual and labial views, Miocene Hawthorn Group. H, I, Mustelus sp., UF 434668, lingual and labial views, Miocene Hawthorn Group. J, Hemipristis curvatus, UF 496250, lingual view, Oligocene Suwannee Limestone. K–M, Hemipristis serra: K, UF 7145, upper, lingual view, Miocene Coosawhatchie Formation; L, M, UF 7171, lower, lingual and lateral views, Miocene Coosawhatchie Formation. N, Carcharhinus gibbesi, UF 496238, upper lateral, lingual view, Oligocene Suwannee Limestone; O, Carcharhinus leucas, UF 233474, upper anterior, lingual view, Pleistocene Caloosahatchee Formation. P–S, Carcharhinus spp.: P, UF 7230, upper anterior, lingual view, Miocene Coosawhatchie Formation; Q, UF 7229, upper lateral, lingual view, Miocene Coosawhatchie Formation; R, UF 278632, upper lateral, Miocene Torreya Formation; S, UF 7231, lower, lingual view, Miocene Coosawhatchie Formation. T, Galeocerdo alabamensis, UF 115706, labial view, Eocene Avon Park Formation. U, Galeocerdo aduncus, UF 7910, labial view, Miocene Coosawhatchie Formation. V, Galeocerdo mayumbensis, UF 100156, lingual view, Miocene Torreya Formation. W, Galeocerdo cuvier, UF 233649, lingual view, Pleistocene Caloosahatchee Formation. X, Physogaleus contortus, UF 7177, lingual view, Miocene Coosawhatchie Formation. Y, Z, Negaprion brevirostris: Y, UF 228536, upper lateral, Pliocene Peace River Formation; Z, UF 415411, lower, lingual view, Mio-Pliocene Tamiami Formation. AA, Isogomphodon acuarius, UF 496253, lingual view, Oligocene Suwannee Limestone. AB, AC, Rhizoprionodon sp.: AB, UF 278638, lingual view, Miocene Torreya Formation. AC, UF 294258, lower, lingual view, Pliocene Peace River Formation. AD, AE, Sphyrna mokarran, UF 333991, lingual and labial views, Miocene Coosawhatchie Formation. AF–AI, Sphyrna tiburo: AF, AG, UF 516841, upper, lingual and apical views; AH, AI, UF 516839, posterior, apical and lateral views, Mio-Pliocene Tamiami Formation. AJ, Hemipristis serra, UF 22711 vertebral centrum, lateral view, Pliocene Peace River Formation. AK, Negaprion brevirostris, UF 3245, articulated vertebral column, lateral view, Miocene Alachua Formation. Photographs for K–Y, AB, AC, and AJ, AK are from the Florida Museum of Natural History (FLMNH) vertebrate paleontology online database, taken by Sean Moran. Photograph for Z is from Perez and Marks (Reference Perez and Marks2017). Photographs for D, E and AF–AI were shared by Ken Marks. Scale bars, 5 mm, except AK.
Lamniformes is the second most abundant and taxonomically diverse selachian order, with 20 taxa accounting for 11% of the total sample (examples shown in Fig. 4). The 20 lamniform taxa belong to 6 families (i.e., Alopiidae, Odontaspididae, Jaekelotodontidae, Otodontidae, Lamnidae, and Cetorhinidae) and 12 genera (Alopias, Odontaspis, Carcharias, Carcharoides, Brachycarcharias, Jaekelotodus, Otodus, Parotodus, Carcharodon, Isurus, Macrorhizodus, and Cetorhinus). These taxa are assigned to four different dentition types and seven different ecomorphotypes (Supplemental Table 2).

Figure 4. Order Lamniformes: A, B, Brachycarcharias lerichei: A, UF 95770, upper lateral tooth, lingual view, Eocene Ocala Limestone; B, UF 124695, lower anterior tooth, lingual view, Eocene Ocala Limestone. C, Jaekelotodus trigonalis, UF 419224, labial view, Miocene Hawthorn Group. D, Carcharoides catticus, UF 229944, lingual view, Miocene Peace River Formation. E, Carcharias cuspidatus, UF 205039, lower tooth, lingual view, Oligocene Suwannee Limestone. F, G, Carcharias taurus: F, UF 4493, upper lateral tooth, lingual view, Pliocene Peace River Formation; G, UF 4492, lower tooth, lateral view, Pliocene Peace River Formation. H, Otodus auriculatus, UF 115990, lingual view, Eocene Ocala Limestone. I, Otodus angustidens, UF 17994, lingual view, Oligocene Parachucla Formation. J, K, Otodus megalodon: J, UF 300, lingual view, Pliocene Peace River Formation; K, UF 245000, lingual view, Miocene Coosawhatchie Formation. L, M, Macrorhizodus praecursor: L, UF 116001, lingual view, Eocene Ocala Limestone. M, UF 235823, lingual view, Eocene Ocala Limestone. N, O, Carcharodon hastalis: N, UF 3772, lingual view, Miocene Coosawhatchie Formation; O, UF 17862, lingual view, Pliocene Peace River Formation. P, Carcharodon carcharias, UF 131981, lingual view, Pleistocene Fort Thompson Formation. Q, Isurus sp., UF 416540, upper lateral, lingual view, Miocene Hawthorn Group. R, Isurus oxyrinchus, UF 427198, lower lateral, lingual view, Miocene Hawthorn Group. S, Parotodus benedenii, UF 223346, lingual view, Pliocene. T, U, Alopias spp.: T, UF 278651, lingual view, Miocene Coosawhatchie Formation; U, UF 232591, lingual view, Miocene Torreya Formation. V, W, cf. Cetorhinus sp., UF 434654, labial and lateral view, Miocene Hawthorn Group. X–AA, Lamniformes indeterminate: X, Y, UF 287616, rostral node, lateral and apical views Pliocene Peace River Formation; Z, AA, UF 287443, vertebral centrum, articular and lateral views, respectively, Pliocene Peace River Formation. Additional photographs are available on the Florida Museum of Natural History (FLMNH) vertebrate paleontology online database taken by Sean Moran. Scale bars, 1 cm, except D, V, W.
All other selachian orders (i.e., Squaliformes, Squatiniformes, Orectolobiformes, Hexanchiformes, and Heterodontiformes) each account for less than 1% of the total sample (examples shown in Fig. 5). The order Squaliformes is solely represented by Isistius triangulus. The order Squatiniformes is solely represented by Squatina sp. The order Orectolobiformes is represented by two species of Ginglymostoma and Rhincodon sp. However, there is also a single indeterminate species of orectolobiform that possibly represents Orectolobus (Fig. 5S–U). The order Hexanchiformes is represented by Notorynchus cepedianus and H. griseus. The order Heterodontiformes is solely represented by Heterodontus sp. These seven taxa correspond with five different dentition types and six different ecomorphotypes (Supplemental Table 2).

Figure 5. Orders Squaliformes, Squatiniformes, Orectolobiformes, Hexanchiformes, and Heterodontiformes: A–F, Isistius triangulus: A, B, UF 413753, lower tooth, lingual and labial views, respectively; C, D, UF 413774, symphyseal lower tooth, lingual and labial views, respectively; E, F, UF 413775, posterior lower tooth, lingual and labial views, respectively, Mio-Pliocene Tamiami Formation. G–N, Squatina sp., G–J, UF 415408, indeterminate tooth position, lingual, labial, lateral, and basal views, respectively; K–N, UF 333801, indeterminate tooth position, lingual, labial, lateral, and basal views, respectively, Mio-Pliocene Tamiami Formation. O–Q, Ginglymostoma delfortriei, UF 17925, tooth, labial, lingual, and apical views, respectively, Pliocene Peace River Formation. R, Ginglymostoma cirratum, UF/TRO 16530, tooth, labial view, Pliocene Peace River Formation. S–U, Orectolobiformes indet., UF 493197, lingual, labial, and basal views, respectively, Miocene Hawthorn Group. V, W, Notorynchus cepedianus, UF 130073, lower tooth, lingual and labial views, respectively, Pliocene Peace River Formation. X, Y, Hexanchus griseus, UF 256992, lower tooth, lingual and labial, Pleistocene Jackson Bluff Formation. Z–AB, Heterodontus sp., Z, UF 431348, tooth, apical view; AA, AB, UF 431349, apical and basal views, respectively, Mio-Pliocene Tamiami Formation. Photographs for A–N from Perez and Marks (Reference Perez and Marks2017). Photographs for O–Q and V, W from the Florida Museum of Natural History (FLMNH) vertebrate paleontology online database, taken by Sean Moran. Photographs for Z–AB taken by Ken Marks. Scale bars, 5 mm.
Batoids are represented by three orders: Myliobatiformes, Rhinopristiformes, and Rajiformes (examples shown in Fig. 6). Myliobatiformes is the most abundant and taxonomically diverse order of batoids, with at least eight taxa accounting for 17.5% of the total sample. These eight taxa belong to five families (i.e., Dasyatidae, Myliobatidae, Rhinopteridae, Aetobatidae, and Mobulidae) and seven genera (Dasyatis, Myliobatis, Aetomylaeus, Rhinoptera, Aetobatus, Mobula, and Plinthicus). The order Rhinopristiformes is represented by five taxa, which accounted for nearly 2% of the total sample. These five taxa belong to three families (Pristidae, Rhinidae, and Rhinobatidae) and four genera (Pristis, Anoxypristis, Rhynchobatus, and Rhinobatos). Specimens from the order Rajiformes are not identified beyond the family level and accounted for less than 1% of the total sample. These 14 taxa are assigned to 3 dentition types and 6 ecomorphotypes (Supplemental Table 2).
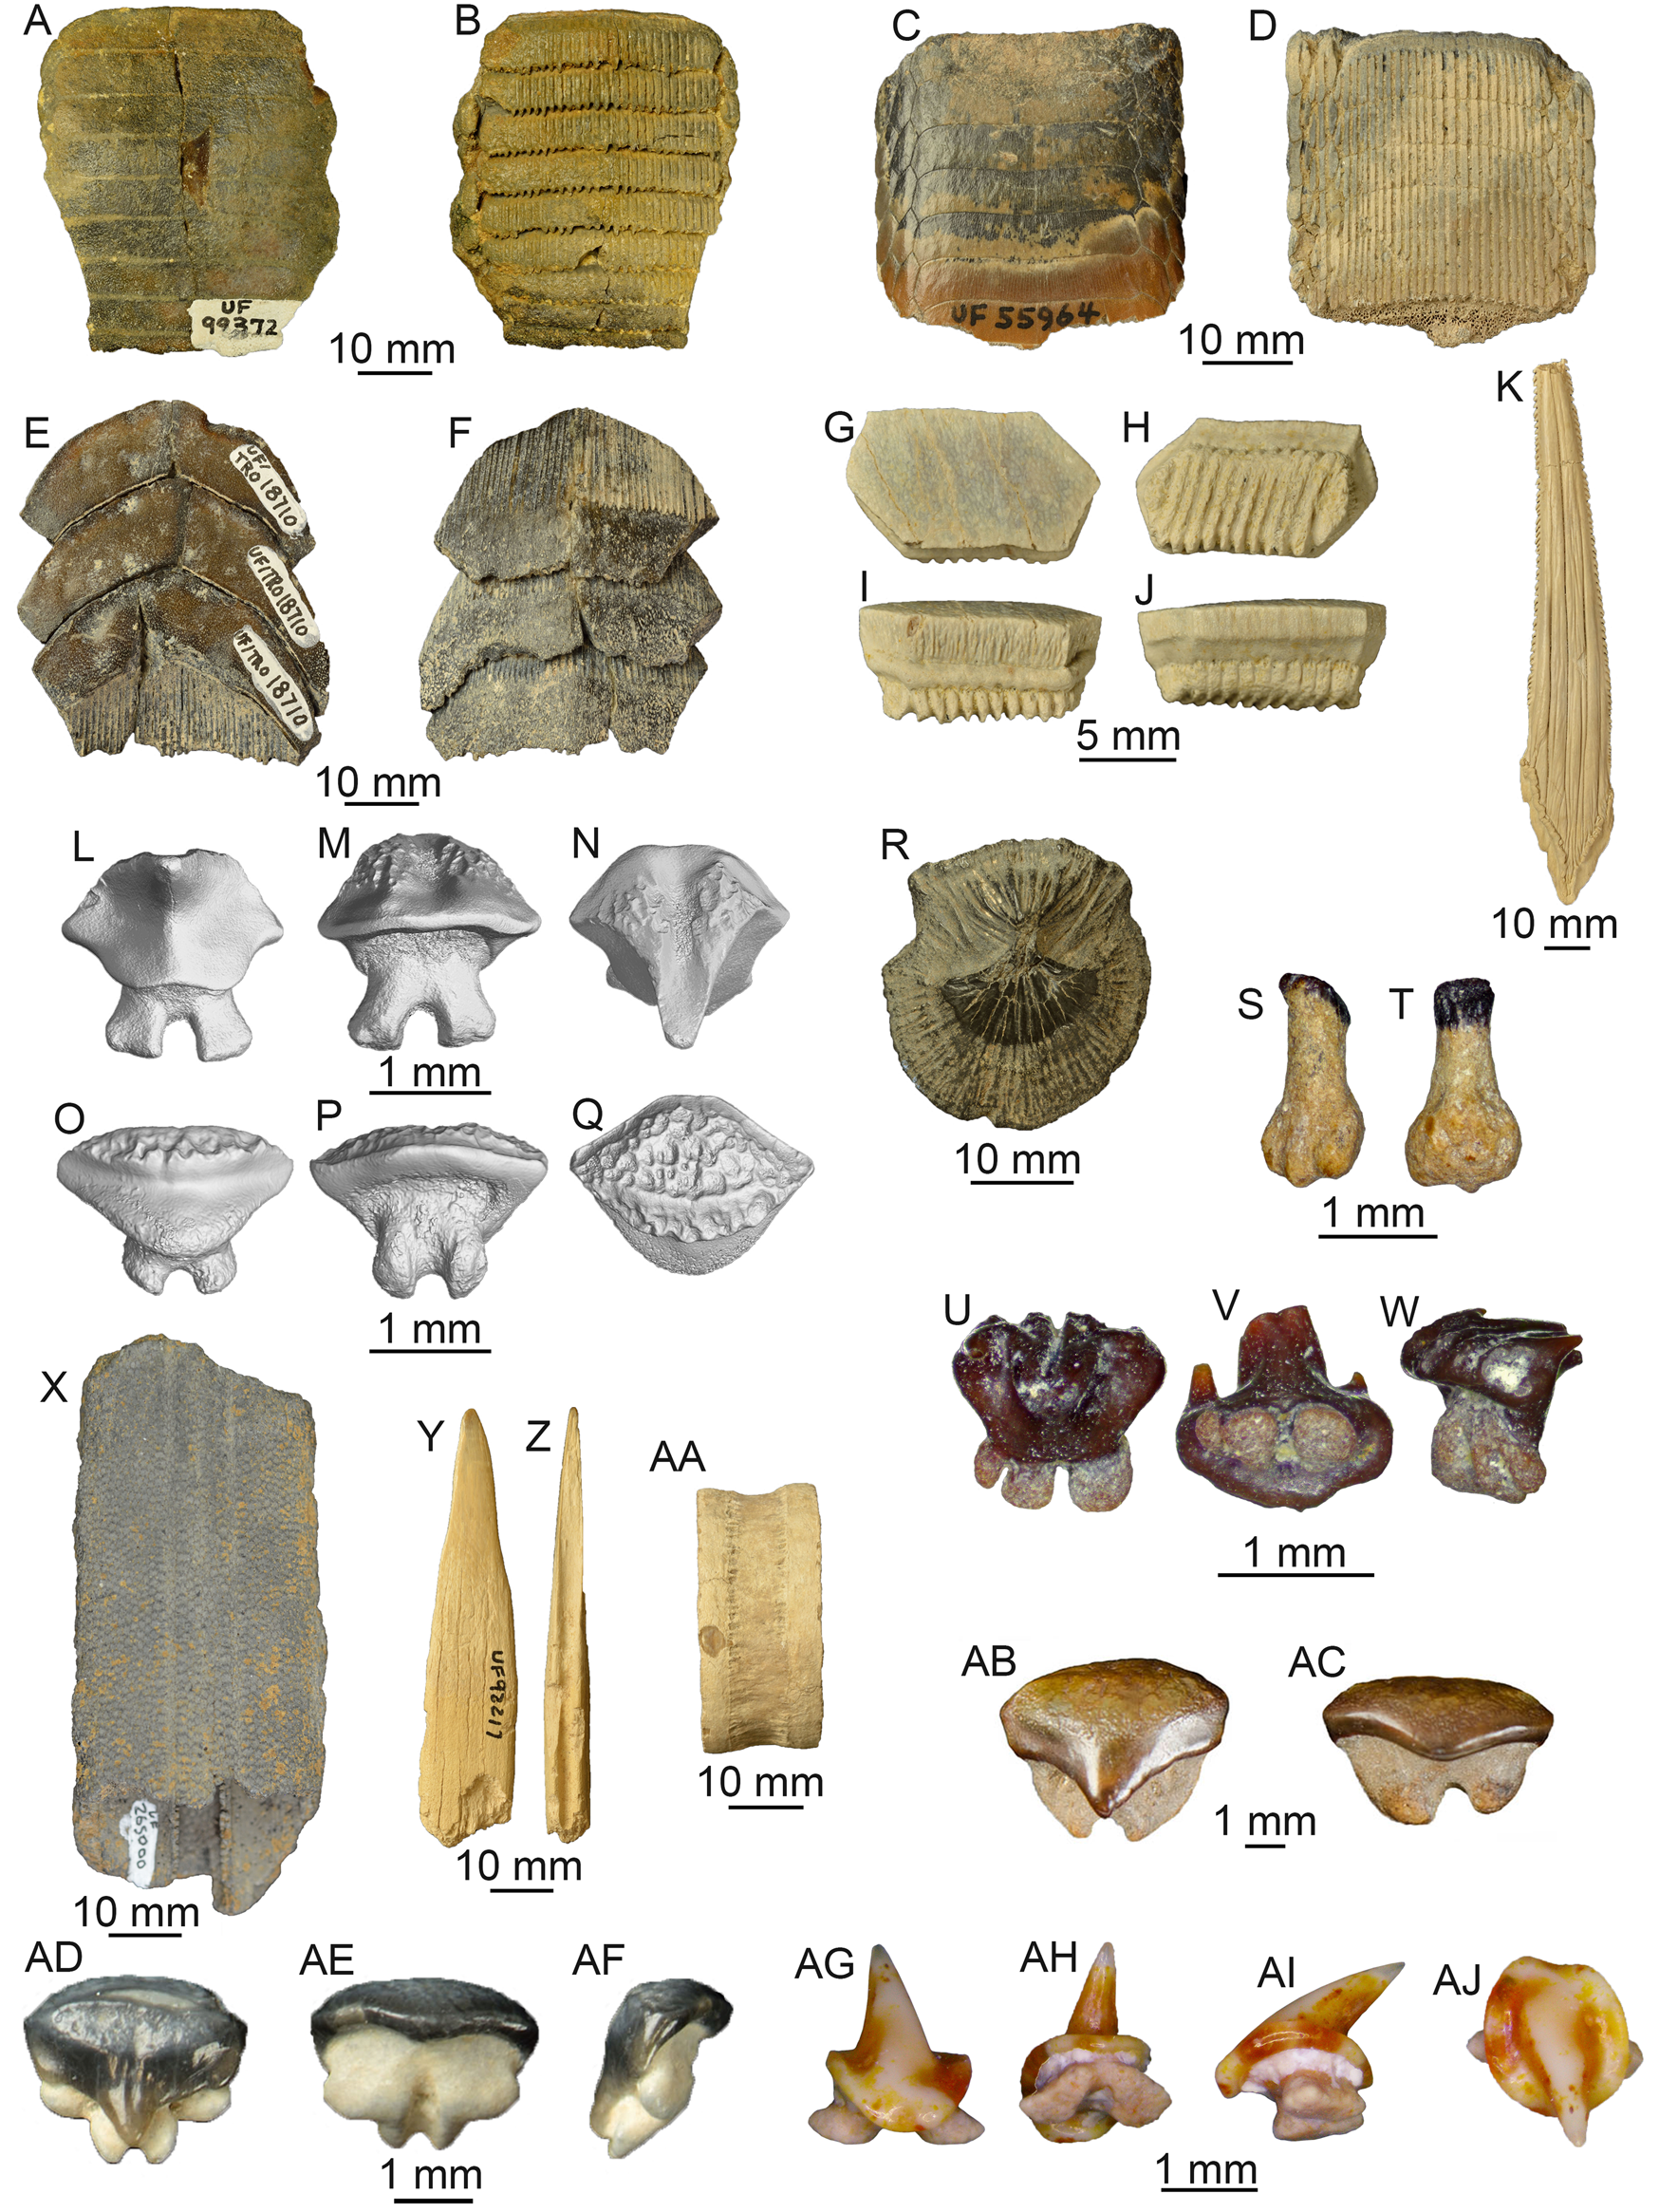
Figure 6. Orders Myliobatiformes, Rhinopristiformes, and Rajiformes: A, B, Myliobatidae, UF 99372, mouth plate, apical and basal views, respectively, Eocene Ocala Limestone. C, D, Aetomylaeus sp., UF 55964, apical and basal views, respectively, Pliocene Peace River Formation. E, F, Aetobatus sp., UF 18710, apical and basal views, respectively, Pliocene Peace River Formation. G–J, Rhinoptera sp., UF 20809, lateral dental plate, apical, basal, lingual, and labial views, respectively, Pliocene Peace River Formation. K, Myliobatiformes indet., UF 55969, caudal spine, dorsal view, Pliocene Peace River Formation. L–Q, Dasyatis sp.: L–N, UF 430925, male tooth, lingual, labial, and apical views, respectively; O–Q, UF 430926, female tooth, lingual, labial, and apical views, respectively, Miocene undifferentiated Hawthorn Group, SEM images by Natasha Vitek and Josh Ringer, Florida Museum of Natural History (FLMNH). R, Dasyatidae indet., UF 95233, dermal denticle, Pleistocene Caloosahatchee Formation. S, T, cf. Mobula birostris, UF 516841, tooth, lingual and labial views, respectively, Mio-Pliocene Tamiami Formation. U–W, cf. Mobula hypostoma, UF 516842, tooth, lingual, basal, and lateral views, respectively, Mio-Pliocene Tamiami Formation. X, Pristis lathami, UF 265000, partial rostrum, dorsal view, Eocene Ocala Limestone. Y–AA, Pristis sp.: Y, Z, UF 92217, rostral denticle, dorsal and proximal views, respectively, Miocene Coosawhatchie Formation; AA, UF 22620, vertebral centrum, lateral view, Pliocene Peace River Formation. AB, AC, Rhynchobatus sp., UF 415420, tooth, lingual and labial views, respectively, Mio-Pliocene Tamiami Formation. AD–AF, Rhinobatos sp., UF 22511, tooth, lingual, labial, and lateral views, respectively, Pliocene Peace River Formation. AG–AJ, Rajidae indeterminate, UF 501000, tooth, lingual, baso-labial, lateral, and apical views, respectively, Miocene Hawthorn Group. Photographs for A–R, Y–AA, and AD–AF from the FLMNH vertebrate paleontology online database taken by Sean Moran. Photographs for S–W and AG–AJ taken by Ken Marks. Photographs for AA, AB from Perez and Marks (Reference Perez and Marks2017).
Sampling Completeness
To evaluate paleodiversity patterns, specimen occurrences are organized by their temporal context into 12 time bins. Species accumulation curves for the 12 time bins show that the Paleogene is not well sampled, particularly the Claibornian and Whitneyan time bins (Fig. 7). Only 21 chondrichthyan specimens from two sites that expose the Claibornian Avon Park Formation are cataloged in the FLMNH collection (Table 1). Sampling from the Jacksonian and Vicksburgian time bins is more complete, but additional taxa are still likely to be recovered. There are 192 chondrichthyan fossils cataloged from the late Eocene Jacksonian that were collected from 44 sites within the Ocala Limestone. There are 265 chondrichthyan specimens from the early Oligocene Vicksburgian that were collected from a single site exposing the Suwannee Limestone, and 1 specimen from the Marianna Limestone. The Whitneyan time bin is represented by 23 chondrichthyan specimens collected from a sinkhole deposit that is no longer accessible (Patton Reference Patton1969). The age of the chondrichthyan specimens is uncertain, which means that there may be no record of chondrichthyans from this time bin.

Figure 7. Species accumulation curves for the 12 time bins (N = 107,698). A, Rancholabrean (n = 779). B, Irvingtonian (n = 1193). C, Blancan (n = 1276). D, Hemphillian (n = 88,300). E, Clarendonian (n = 10,200). F, Barstovian (n = 3438). G, Hemingfordian (n = 1176). H, Arikareean (n = 834). I, Whitneyan (n = 23). J, Vicksburgian (n = 266). K, Jacksonian (n = 192). L, Claibornian (n = 21).
The transition from the Paleogene to the Neogene occurs within the Arikareean time bin. This time bin is represented by 834 specimens, collected from 11 sites and 2 formations. Most of these specimens were derived from the Parachucla Formation. The plateau exhibited on the species accumulation curve for the Arikareean time bin indicates that sampling is relatively complete and additional taxa are unlikely to be recovered with additional sampling (Fig. 7H).
There are 1176 chondrichthyan specimens cataloged from the Hemingfordian, which were derived from 15 sites and 4 formations. The Hemingfordian species accumulation curve indicates that chondrichthyans are fairly well sampled, but additional taxa are still likely to be recovered (Fig. 7G). The species accumulation curves indicate that sampling is most complete from the Barstovian, Clarendonian, and Hemphillian time bins (Fig. 7D–F). There are 3438 chondrichthyan specimens cataloged from the Barstovian, which came from 16 sites and 3 formations. Sample size increases drastically to 10,200 chondrichthyan specimens cataloged from the Clarendonian that were collected from 29 sites and 3 formations. Sample size peaks in the Hemphillian, with 88,300 cataloged chondrichthyan specimens (~80% of the chondrichthyan sample from Florida) collected from 116 sites and 4 formations. The vast majority of the Hemphillian specimens were from the Peace River Formation in the Bone Valley region (i.e., the Palmetto Fauna). A significant portion (~14%) was collected from the undifferentiated Hawthorn Group at the Montbrook fossil site.
The species accumulation curve for the Plio-Pleistocene Blancan time bin is similar to that of the Hemingfordian, in which the time bin appears to be relatively well sampled but additional taxa are still likely to be found (Fig. 7C). There are 1276 chondrichthyan specimens recorded from the Blancan, derived from 31 sites and 4 formations. Most of these specimens came from the Tamiami Formation, which spans from the Hemphillian into the Blancan. Many specimens from the Tamiami Formation were not included in the diversity analyses, because it was unclear if they belonged in the Hemphillian or Blancan time bin. The Pleistocene Irvingtonian and Rancholabrean time bins are moderately well sampled (Fig. 7A,B). There are 1193 chondrichthyan specimens cataloged from the Irvingtonian that came from 10 sites and 3 formations. The Rancholabrean is represented by 779 chondrichthyan specimens from 52 sites and 2 formations.
Taxonomic Diversity
There are 107,698 specimens with adequate geochronological data to be placed within the 12 time bins (Table 2). This sample comprises 8 orders, 24 families, and 39 genera. However, of this sample, only 95,944 specimens are identified to the genus level. A range chart depicts the presence/absence of each genus across the 12 time bins (Fig. 8).

Figure 8. Presence/absence of chondrichthyan genera across the 12 time bins. Note the uncertain ages for Isistius, Heterodontus, and Mustelus.
Across all 12 time bins, sample size has a logarithmic relationship with taxonomic diversity, with R 2 = 0.89 at the genus level and R 2 = 0.88 at the family level. To visually illustrate the logarithmic relationship between taxonomic richness and sample size through time, the number of genera and number of families were plotted with sample size across the 12 time bins (Fig. 9). The only instance in which taxonomic richness and sample size do not match up is between the Jacksonian and Vicksburgian time bins. Despite an increase in sample size, there is stasis in the number of genera and a decrease in the number of families across these time bins (Fig. 9).

Figure 9. Chondrichthyan taxonomic and ecomorphological richness plotted with sample size across the 12 time bins. Time bins corresponding with the middle Miocene climatic optimum (MMCO) and Eocene–Oligocene transition (EOT) are shaded in gray.
The Shannon H index indicates an overall trend of increasing taxonomic diversity, with a significant drop in diversity across the Plio-Pleistocene boundary (i.e., between the Blancan and Irvingtonian time bins). In contrast, the Chao1 index indicates an overall increase in taxonomic diversity from the Eocene through the Miocene and decreasing diversity through the Pliocene and Pleistocene (Fig. 10). Interestingly, based on the mean values, the Shannon H index shows a decrease in alpha diversity across the Eocene/Oligocene boundary, whereas the Chao1 index shows an increase in alpha diversity across the EOT (i.e., between the Jacksonian and Vicksburgian time bins). However, the differences in diversity between the Jacksonian and Vicksburgian time bins are insignificant given the overlapping range of errors in both the Shannon and Chao1 indices (Fig. 10).

Figure 10. Shannon (A) and Chao1 (B) diversity indices plotted across the 12 time bins. Diversity indices were calculated in PAST3 (Hammer et al. Reference Hammer, Harper and Ryan2001). Error bars represent 95% confidence intervals around the mean.
In addition, the relative abundance of each order is calculated for each time bin, which shows that three orders dominated Florida's chondrichthyan fossil record: Carcharhiniformes, Lamniformes, and Myliobatiformes (Fig. 11A). The other five orders (i.e., Rhinopristiformes, Orectolobiformes, Hexanchiformes, Squatiniformes, and Rajiformes) that occur within Florida's chondrichthyan fossil record never account for more than 4% of the sample in any given time bin. The orders Squaliformes and Heterodontiformes are also present, but only from a single site with poor stratigraphic constraint, and were consequently not included in this analysis.

Figure 11. Relative abundance of chondrichthyan orders (A) and dentition types (B) across the 12 time bins. The Claibornian and Whitneyan data are not included because of their small sample sizes.
In the late Eocene Jacksonian time bin, lamniform sharks are the most abundant, representing 81% of the chondrichthyan sample. Carcharhiniform sharks comprise 9% and myliobatiform rays comprise 8% of the Jacksonian sample. There is a clear transition in the early Oligocene Vicksburgian time bin, which consists of 55% myliobatiform rays, 41% carcharhiniform sharks, and 4% lamniform sharks. In the late Oligocene to early Miocene Arikareean time bin, myliobatiform rays comprise 65%, carcharhiniform sharks comprise 30%, and lamniform sharks comprise 3% of the chondrichthyan sample (Fig. 11A).
In the early to middle Miocene Hemingfordian time bin, carcharhiniform sharks are the dominant order, representing 81% of the chondrichthyan sample. Lamniform sharks and myliobatiform rays each represent about 8% of the chondrichthyan sample. This trend persists through the Pleistocene Rancholabrean time bin. From the middle Miocene through the Pleistocene, carcharhiniform sharks range from 50% to 89%, myliobatiform rays range from 6% to 27%, and lamniform sharks range from 8% to 22% of the sample (Fig. 11A).
Ecomorphological Diversity
The 70 chondrichthyan taxa present in the Florida fossil record are represented by 10 different dentition types and 21 different ecomorphotypes (Supplemental Table 2). Across all 12 time bins, ecomorphotypes exhibit a relatively strong logarithmic correlation with sample size (R 2 = 0.81); however, the logarithmic relationship between dentition types and sample size is much weaker (R 2 = 0.55). For a visual representation, richness of both ecomorphological metrics is plotted with sample size across the 12 time bins (Fig. 9). The number of dentition types is relatively consistent throughout Florida's geologic record, with two minor peaks. There is an increase in dentition types across the EOT, which can be attributed to the recovery of clutching-type teeth of Rhizoprionodon in the early Oligocene Suwannee Limestone. Following the EOT, there is stasis in the number of dentition types from the Oligocene through the middle Miocene. Following the MMCO, when sample size peaks, the number of dentition types also peaks. The increase in dentition types can be attributed to the specialized filter-feeding dentitions of Rhincodon and Mobula, as well as the cutting-clutching dentition of Galeorhinus. The number of dentition types decreases in the Pliocene, as sample size decreases, and then reaches stasis yet again in the Pleistocene (i.e., Irvingtonian to Rancholabrean time bins).
While there is little change in the richness of dentition types, the evenness of dentition types changes through time and largely corresponds with taxonomic diversity patterns observed at the order level (Fig. 11). Cutting-dominant dentition types are the most common throughout most of the surficial Florida geologic record, except during the Oligocene. There is a decrease in the number of grasping-dominant dentition types following the EOT, which corresponds with the extinction of Brachycarcharias, Jaekelotodus, and Macrorhizodus (Fig. 8). After the EOT, Carcharias, Odontaspis, Carcharoides, and Isurus are the only taxa with a grasping-dominant dentition that occur in the Florida sample.
Crushing dentition types, attributed to most batoids, are consistently present from the Eocene through the Pleistocene (Fig. 11B). Three selachian taxa independently developed crushing-type teeth: cf. Mustelus sp. (Fig. 3H,I), S. tiburo (Fig. 3AH,AI), and Heterodontus sp. (Fig. 5Z–AB). The only batoids that do not exhibit crushing-type teeth are male Dasyatis during breeding season that have clutching-type dentitions (Fig. 9L–N), the mobulid rays that have a specialized filter-feeding dentition (Fig. 6S–W), and the rajid skates that have diminutive clutching-type dentitions (Fig. 6AG–AJ). The specialized filter-feeding dentition type evolved independently in three different orders: Myliobatiformes (i.e., Mobula and Plinthicus), Lamniformes (i.e., Cetorhinus), and Orectolobiformes (i.e., Rhincodon); but it is always rare, representing less than 0.5% of the chondrichthyan sample in any given time bin.
Richness of ecomorphotypes through time exhibits a linear relationship with family-level taxonomic diversity (R 2 = 0.89). The increase in ecomorphotypes from the Eocene through the Miocene can mostly be attributed to the recovery of additional benthic taxa through time. Benthic taxa in this sample are assigned to six different ecomorphotypes (i.e., squatinobenthic, probenthic, pristobenthic, rhynchobenthic, rhinobenthic, and rajobenthic), which are each represented by one or two species. The littoral ecomorphotype is the most common and becomes increasingly more diverse through time, corresponding mostly with the increase of taxa within the family Carcharhinidae. Recovery of specialized littoral taxa within the families Sphyrnidae and Triakidae also contribute to the increase in ecomorphotype richness during the Miocene. The microtrophic ecomorphotype (i.e., filter-feeding dentition type) occurs in the Miocene and Pliocene of Florida.
Discussion
Before this study, 50 chondrichthyan taxa from the Florida fossil record had been reported in peer-reviewed literature, representing 9 orders, 18 families, and 28 genera. At least 70 chondrichthyan taxa from the Florida Platform are now recognized. While this study represents a significant increase in our documentation of the chondrichthyan species present in Florida's surficial geologic record, there are numerous gaps in sampling where additional taxa are likely to be recovered.
Rarefaction curves indicate that sampling is most complete from the middle to late Miocene (Fig. 7D–F), moderately complete in the early Miocene (Fig. 7G,H) and the Plio-Pleistocene (Fig. 7A–C), and poor from the Paleogene (Fig. 7I–L). Gaps in sampling are also evident in the genus presence/absence graph (Fig. 8). Alopias, Odontaspis, Carcharoides, Isurus, Sphyrna, Pristis, Rhynchobatus, Dasyatis, Myliobatis, and Aetomylaeus all occurred inconsistently throughout Florida's geologic record. Sporadic occurrences of a genus in Florida's fossil record may relate to local extirpation, but more likely represent limitations in identifying specimens and/or insufficient sampling.
Extant chondrichthyans around the Florida Platform offer some insight as to what additional taxa are likely to be recovered with additional sampling and when local extirpation occurred. Based on the Chondrichthyan Tree of Life project (sharksrays.org) there are currently more than 100 chondrichthyan species around the Florida Platform, representing 11 orders, 35 families, and 54 genera. To date, no fossil occurrences from the orders Chimaeriformes or Torpediniformes have been recovered from the Florida fossil record, despite having extant representatives in the waters surrounding the Florida Platform. Notorynchus, Heterodontus, and Hemipristis are the only extant genera that occur in Florida's fossil record but are no longer present in the North Atlantic and Gulf Coastal Plains (i.e., local extirpation).
Of the 107,698 specimens with sufficient temporal data to be sorted into the 12 time bins, there are 95,944 (89%) identified to the genus level. For most taxonomic groups, identification to the genus level is feasible. However, for some (i.e., Scyliorhinidae, Rajidae, Myliobatidae, and Rhinopteridae), identification beyond the family level is exceedingly difficult. Apparent gaps in sampling for Myliobatis and Aetomylaeus are likely an artifact caused by conservative identifications for partial dental plates, which are typically not identified beyond Myliobatiformes or Myliobatidae. Inability to distinguish fragmentary ray dental plates suppresses the true taxonomic diversity of myliobatiform rays. Likewise, Eocene specimens assigned to Galeocerdo also require further review, in light of recent studies by Ebersole et al. (Reference Ebersole, Cicimurri and Stringer2019) and Türtscher et al. (Reference Türtscher, López-Romero, Jambura, Kindlimann, Ward and Kriwet2021), as some specimens likely represent Physogaleus.
Limitations associated with identifying specimens to lower taxonomic ranks are somewhat irrelevant when assigning specimens to ecomorphological categories (i.e., dentition types and ecomorphotypes). For example, taxa belonging to Myliobatidae, Aetobatidae, and Rhinopteridae are grouped together in the crushing dentition type and aquilopelagic ecomorphotype categories. These qualitative classification schemes attempt to organize the multivariate ecological roles of chondrichthyans into discrete categories based on morphology, behavior, and habitat (see Table 3). The biological relevance of functional tooth morphology in chondrichthyans has been studied by numerous researchers (e.g., Moss Reference Moss1977; Frazzetta Reference Frazzetta1988; Kent Reference Kent1994; Motta et al. Reference Motta, Hueter, Tricas, Summers, Huber, Lowry, Mara, Matott, Whitenack and Wintzer2008; Kolmann and Huber Reference Kolmann and Huber2009; Whitenack and Motta Reference Whitenack and Motta2010; Whitenack et al. Reference Whitenack, Simkins and Motta2011; Cappetta Reference Cappetta2012; Crofts and Summers Reference Crofts and Summers2014; Corn et al. Reference Corn, Farina, Brash and Summers2016; Huber et al. Reference Huber, Wilga, Dean, Ferry, Gardiner, Habegger, Papastamatiou, Ramsay, Whitenack, Bels and Whishaw2019).
Although biomechanical studies on shark tooth loading and performance have found little support for the morphotype categories (Whitenack and Motta Reference Whitenack and Motta2010; Whitenack et al. Reference Whitenack, Simkins and Motta2011), these studies analyzed tooth function in isolation from the overall dental arcade and oversimplify the functions necessary to capture and process prey (Huber et al. Reference Huber, Wilga, Dean, Ferry, Gardiner, Habegger, Papastamatiou, Ramsay, Whitenack, Bels and Whishaw2019). However, when dynamic testing was applied with more realistic conditions (i.e., multiple teeth functioning together), notable differences in performance were observed between teeth of Hexanchus and Carcharhinus (Corn et al. Reference Corn, Farina, Brash and Summers2016). Even more complex biomechanical studies that consider heterodonty, jaw musculature, and a wider variety of tooth morphologies will be necessary to adequately assess the validity of ecomorphological categories.
Smaller chondrichthyan fossils (i.e., specimens smaller than 5 mm) are poorly sampled throughout most of Florida's fossil record, especially from the Paleogene. This is primarily due to uneven screenwashing efforts across different time periods, with most screenwashing occurring in sites that expose Mio-Pliocene–aged fossils. Chondrichthyan taxa with small dental remains correspond with the following taxonomic groups: Squaliformes, Heterodontiformes, Cetorhinidae, Scyliorhinidae, Triakidae, Rhinopristiformes, Rajiformes, and Mobulidae. These taxa predominantly represent benthic ecomorphotypes (i.e., Probenthic, Pristobenthic, Rhynchobenthic, Rhinobenthic, and Rajobenthic) and filter-feeding specialists (i.e., the microtrophic ecomorphotype). Consequently, insufficient sampling of smaller chondrichthyan fossils predictably obscures both taxonomic and ecomorphological diversity.
Various methods have been created to quantify diversity, each with their own assumptions and limitations (Gotelli and Colwell Reference Gotelli and Colwell2001, Reference Gotelli, Colwell, Magurran and McGill2011; Close et al. Reference Close, Evers, Alroy and Butler2018). Two diversity indices (i.e., Shannon H and Chao1) were calculated to measure taxonomic diversity at the genus level (Fig. 10). These indices both attempt to quantify alpha diversity by accounting for richness and evenness in different ways. The Shannon H index measures proportional abundance of each taxon, incorporating both richness and evenness (Shannon Reference Shannon1948). The Chao1 index also measures abundance but puts greater emphasis on rare taxa (i.e., singletons and doubletons), which results in a metric that is more closely related to richness (Chao et al. Reference Chao, Colwell, Lin and Gotelli2009). Notice how taxonomic richness at the genus level in Figure 9 is nearly identical to the Chao1 plot in Figure 10B. Taxonomic richness at the genus level exhibits a linear relationship with the mean values from the Chao1 diversity index (R 2 = 0.91), which further illustrates that evenness plays a minor role in the Chao1 index. While these diversity indices offer a more rigorous way of evaluating biodiversity than simple counts, they are still subject to misinterpretation when sampling is incomplete (Chao et al. Reference Chao, Colwell, Lin and Gotelli2009; Close et al. Reference Close, Evers, Alroy and Butler2018). Understanding the underlying causes for the observed sampling bias in the FLMNH collection can aid in directing future collection and research efforts.
Sampling Bias
The chondrichthyan collection at the FLMNH was subject to three general categories of sampling bias: lithologic controls, collection habits, and research effort. Lithologic controls refer to the variable taphonomic processes associated with carbonate versus siliciclastic rocks and the rock record available for sampling. Collection habits refer to the sampling methods employed (i.e., surface collecting vs. screenwashing) and the asymmetric effort placed on specific taxa and geologic time periods. Sampling is particularly insufficient for smaller chondrichthyan fossil remains, which are typically only recovered by screenwashing sediment and carefully picking fossils under a microscope. Half of the first occurrences reported in this study were only found through screenwashing (i.e., Heterodontus sp., Rhincodon sp., cf. Cetorhinus sp., Scyliorhinidae indet., Galeorhinus sp., cf. Mustelus sp., Sphyrna tiburo, Rhinobatos sp., cf. Mobula hypostoma, and cf. Mobula birostris). Research effort refers to the role of professional paleontologists in shaping the chondrichthyan assemblage in the FLMNH collection through research prioritizations and regulation of fossil collecting on state lands.
As was discussed previously, Florida's geology is primarily composed of two types of sedimentary rocks: carbonate and siliciclastic. Carbonate rocks were primarily deposited as cemented limestone and dolomite, which are prone to chemical weathering. Consequently, chondrichthyan fossils preserved in carbonate rocks are often exposed in isolation and found through surface collecting. Siliciclastic rocks were primarily deposited as unconsolidated sands and clays that are prone to physical weathering and tend to accumulate in lag deposits. This facilitates recovery of large sample sizes through either surface collecting or screenwashing but can make it difficult to constrain the age of the deposit.
The Eocene and early Oligocene of Florida are predominantly represented by carbonate rocks, which has restricted sampling to surface collecting and partially contributed to the small sample sizes in the Claibornian, Jacksonian, and Vicksburgian time bins. In contrast, the late Oligocene and Neogene of Florida are predominantly represented by siliciclastic rocks, facilitating accumulation of larger sample sizes in the corresponding time bins. Spatial coverage of the different time bins also relates to lithology, with carbonate rocks typically occurring beneath siliciliclastic rocks, resulting in a greater number of collecting sites with younger siliciclastic rocks exposed.
The public has also played a major role in shaping the collection of chondrichthyan fossils reposited at the FLMNH through the numerous donations that have accumulated over more than 125 years. Public participation in paleontology ranges from casual collecting to advanced research (Bonney et al. Reference Bonney, Ballard, Jordan, McCallie, Phillips, Shirk and Wilderman2009; Crippen et al. Reference Crippen, Ellis, Dunckel, Hendy and MacFadden2016; MacFadden et al. Reference MacFadden, Lundgren, Crippen, Dunckel and Ellis2016; Perez et al. Reference Perez, Leder, Lundgren, Ellis, Dunckel and Crippen2020). Those who are casual collectors are likely to collect at easily accessible, well-known sites and often target large teeth, such as those of Otodus megalodon. Frequently collected sites include rivers (e.g., Peace River), creeks (e.g., Gainesville creeks), and beaches (e.g., Venice Beach). In the past, phosphate mines were also frequently collected by avocational paleontologists; however, accessibility to these mines has become increasingly difficult, due to safety and liability concerns on the part of mine operators. These factors exacerbate sampling bias toward the Mio-Pliocene of Florida. This bias is slightly mitigated, as donations to the FLMNH that lack locality data and/or originate from heavily sampled sites tend not to be cataloged and are instead used as education and outreach tools.
Professional paleontologists have impacted the chondrichthyan collection at the FLMNH through decades of rigorous excavations and research (MacFadden Reference MacFadden2017). However, research on chondrichthyans was often secondary to other taxonomic groups, with most vertebrate paleontology studies focusing on terrestrial taxa that do not appear until the Neogene. Further, previous publications often mention the presence of chondrichthyans within a faunal list and rarely provide detailed descriptions or quantitative analyses. The most in-depth research on the chondrichthyan record of Florida was done by graduate students and largely remains unpublished (e.g., Tessman Reference Tessman1969; Stoutamire Reference Stoutamire1975; Soto Reference Soto2015). The largest chondrichthyan sample in the FLMNH collection comes from the Palmetto Fauna, which was heavily sampled during excavations in the central Florida phosphate district, commonly referred to as the Bone Valley region. This again biases the chondrichthyan sample in the FLMNH collection toward the Neogene.
The Florida Museum also regulates fossil collecting on state lands through the issuance of a fossil permit, which is required to collect any vertebrate fossil except shark teeth. The Florida Museum website states that “the purpose of the fossil collecting permit is not only to manage this non-renewable part of Florida's heritage, but to help paleontologists learn more about the range and distribution of the state's fossil animals” (www.floridamuseum.ufl.edu/vertpaleo/amateur-collector/fossil-permit). The omission of sharks from the purview of this permit reinforces the mentality that chondrichthyan fossils are not scientifically valuable. It is important that professional paleontologists communicate the gaps in sampling to the public, as it is very likely that specimens from undersampled units already exist in private collections. As a good example, the first occurrences of Isistius and Squatina from the Florida fossil record were known among avocational paleontologists for more than a decade before they were documented by professional paleontologists (Perez and Marks Reference Perez and Marks2017).
Diversity Patterns
While Florida's chondrichthyan fossil record from the Paleogene has been poorly sampled, chondrichthyans are well documented from other sites throughout the Atlantic and Gulf Coastal Plains (Fowler Reference Fowler1911; White Reference White1956; Case Reference Case1981, Reference Case1994; Westgate Reference Westgate1984, Reference Westgate1989; Dockery and Manning Reference Dockery and Manning1986; Manning and Standhardt Reference Manning, Standhardt, Schiebout and van den Bold1986; Ward and Wiest Reference Ward and Wiest1990; Breard Reference Breard1991; Kent Reference Kent1994, Reference Kent, Weems and Grimsley1999a,Reference Kent, Weems and Grimsleyb; Breard and Stringer Reference Breard and Stringer1995, Reference Breard and Stringer1999; Case and Borodin Reference Case and Borodin2000a,Reference Case and Borodinb; Stringer et al. Reference Stringer, Breard and Kontrovitz2001; Parmley et al. Reference Parmley, Cicimurri and Campbell2003; Cicimurri and Knight Reference Cicimurri and Knight2009; Ehret and Ebersole Reference Ehret and Ebersole2014; Maisch et al. Reference Maisch, Becker, Raines and Chamberlain2014; Cappetta and Case Reference Cappetta and Case2016; Ebersole et al. Reference Ebersole, Cicimurri and Stringer2019). These studies show that a turnover in chondrichthyan taxonomic diversity occurred in nearshore marine environments sometime during the Paleogene, corresponding with a shift in the dominant selachian order from lamniform to carcharhiniform taxa. Based on the number of genera within each order (i.e., taxonomic richness), this turnover occurred gradually throughout the Paleogene (Maisch et al. Reference Maisch, Becker, Raines and Chamberlain2014). Despite sampling limitations in the Florida fossil record, this turnover is partially captured in the existing FLMNH collections (Fig. 11A). This taxonomic turnover occurred as global climate was shifting from warmhouse to coolhouse conditions (Westerhold et al. Reference Westerhold, Marwan, Drury, Liebrand, Agnini, Anagnostou, Barnet, Bohaty, De Vleeschouwer, Florindo and Frederichs2020), suggesting a possible abiotic driver. However, the temporal resolution of this study is insufficient to determine whether the turnover occurred at or before the EOT.
Even though carcharhiniform sharks became the dominant chondrichthyan order during the Paleogene, both carcharhiniform and lamniform sharks were impacted by late Eocene extinctions (possibly coincident with the EOT). There were 13 carcharhiniform genera identified from the middle Eocene of Alabama (Ebersole et al. Reference Ebersole, Cicimurri and Stringer2019), of which 5 became extinct at or before the EOT (Premontreia, Stenoscyllium, Pachygaleus, Abdounia, and Pseudabdounia). There were 10 lamniform genera identified from the middle Eocene of Alabama (Ebersole et al. Reference Ebersole, Cicimurri and Stringer2019), of which 8 became extinct at or before the EOT (Anomotodon, Striatolamia, Brachycarcharias, Hypotodus, Jaekelotodus, Mennerotodus, Tethylamna, and Macrorhizodus).
Among the carcharhiniform sharks that went extinct, Premontreia, Stenoscyllium, and Abdounia are characterized as having either a grasping or clutching dentition type. Among the lamniform genera that went extinct, all are characterized as having either a grasping or grasping-cutting dentition type. Carcharhiniform and lamniform sharks that survived the late Eocene extinctions were predominantly characterized as having cutting-dominant dentition types. Again, this trend is also captured within the Florida fossil record, despite sampling limitations (Fig. 11B). Further, more advanced cutting adaptations evolved independently in Hemipristis (see Fig. 4H–J) and Otodus (see Fig. 3J–K) during the Oligo-Miocene.
These ecomorphological patterns suggest that there is an underlying biotic explanation for this taxonomic turnover. Marine mammals first evolved in the Eocene and diversified rapidly in the Oligocene and early Miocene (Fordyce Reference Fordyce1980; Marx and Uhen Reference Marx and Uhen2010; Uhen Reference Uhen2010). Given that cutting-type teeth aid in the dismemberment of larger prey into smaller consumable portions, the ecomorphological shift from grasping-dominated to cutting-dominated dentition types may have been driven, at least in part, by a greater dietary emphasis on active predation and scavenging on larger prey, such as marine mammals, teleost fish, and other sharks. This macroevolutionary trend has already been proposed as a driving force in the evolution of the megatooth lineage Otodus (Perez et al. Reference Perez, Godfrey, Kent, Weems and Nance2019), but likely contributed to widespread evolutionary changes in multiple taxonomic groups.
Among the myliobatiforms, there is a significant increase in their relative abundance following the EOT (Fig. 10A), corresponding with an increase in the relative abundance of crushing dentition types (Fig. 10B). The extinction of numerous grasping-type sharks may have contributed to the success of myliobatiform rays in the Oligocene and early Miocene (Vicksburgian and Arikareean time bins). As littoral generalists became more diverse and abundant during the Miocene (starting during the Hemingfordian time bin), the abundance of myliobatiform rays dropped. Unfortunately, inability to distinguish partial dental plates inhibits interpretation of myliobatiform diversity at lower taxonomic ranks.
Surprisingly, Manning (Reference Manning, Prothero, Ivany and Nesbitt2003) suggested that marine vertebrates of the Gulf Coastal Plain were relatively unaffected across the EOT, specifically noting that there was no change in the following chondrichthyans: Galeocerdo, Hemipristis, and Plinthicus. This is clearly untrue, as there was a significant turnover in selachian orders that corresponded with a change in the dominant dental morphology exhibited. However, Manning (Reference Manning, Prothero, Ivany and Nesbitt2003) did note that Carcharocles (= Otodus), Carcharias, and Carcharhinus all appeared to be slightly larger across the EOT, but this observation was not substantiated with any quantitative data. Increasing body size could represent another adaptation for feeding on larger prey and would be an interesting avenue for future study.
Future Work
In consideration of the widespread sampling biases discussed earlier, I wanted to provide some recommendations to orient future collection and research efforts. Challenges associated with collecting chondrichthyans from carbonate rocks can realistically only be accounted for through more intentional sampling. Of particular interest are the Ocala Limestone, Suwannee Limestone, and Marianna Limestone to improve sampling resolution across the Eocene/Oligocene boundary. These limestones are readily accessible at many famous terrestrial sinkhole deposits (e.g., Thomas Farm and Haile Quarry). Fieldwork at sites that contain these limestones should be periodically surveyed for Eocene and Oligocene marine vertebrate remains. Further, these limestones are naturally weathered and accumulated in sinkhole deposits, which may facilitate screenwashing efforts to better document smaller chondrichthyan remains.
This concerted effort to improve sampling of marine vertebrates from the Eocene and Oligocene of Florida should be advertised to the public. Perhaps the greatest barrier to public participation in scientific research is awareness of how to get involved. There seems to be a false impression that the chondrichthyan fossil record of Florida is already well described and that chondrichthyan fossils have little research value. Information regarding research and collection gaps should be spread through public exhibits, social media, and directly to fossil clubs to increase awareness and promote public participation. The FOSSIL project (www.myfossil.org) has already established a platform where anyone can document their fossil collections, while being guided through the best practices associated with fossil curation (Crippen et al. Reference Crippen, Ellis, Dunckel, Hendy and MacFadden2016; MacFadden et al. Reference MacFadden, Lundgren, Crippen, Dunckel and Ellis2016; Perez et al. Reference Perez, Leder, Lundgren, Ellis, Dunckel and Crippen2020). This platform can be utilized to address specific research questions and focus the efforts of passionate, enthusiastic avocational paleontologists.
In addition to improving sampling, future research should aim to improve the temporal resolution of fossil occurrences in Florida. In most carbonate depositional environments, chondrichthyan fossils are assigned an age based on invertebrate biostratigraphy and/or strontium dating of carbonate shells. In most siliciclastic depositional environments, chondrichthyan fossils are often assigned an age based on terrestrial mammalian biostratigraphy (i.e., NALMA). In many siliciclastic depositional environments, invertebrates have moldic preservation, which make them unusable for strontium dating. One potential solution is to independently date the chondrichthyan fossils themselves through strontium dating of chondrichthyan tooth enameloid (Becker et al. Reference Becker, Seidemann, Chamberlain, Buhl and Slattery2008). Improving the temporal resolution of fossil occurrences in Florida will allow researchers to more accurately associate diversity patterns with known climatic events (e.g., the EOT, MMCO, Pliocene warming event, and Pleistocene glaciations). In addition, improved dating of fossil occurrences will allow for more even subdivisions across time bins, resulting in more meaningful comparisons of diversity through time.
Despite limitations in sampling completeness and temporal resolution, this study found evidence in support of a taxonomic turnover between lamniform and carcharhiniform sharks and an ecomorphological turnover from grasping-dominant to cutting-dominant dentition types that occurred across the Eocene/Oligocene boundary. This turnover played a major role in establishing modern nearshore marine communities and should be studied in greater detail. Morphometric analyses of chondrichthyan teeth may serve as a more objective means of analyzing this ecomorphological trend (e.g., Bazzi et al. Reference Bazzi, Kear, Blom, Ahlberg and Campione2018, Reference Bazzi, Campione, Ahlberg, Blom and Kear2021). Further, the qualitative ecomorphological classification schemes (i.e., dentition type and ecomorphotype) combine multiple ecologically relevant variables. Separating out these ecologically relevant variables into discrete categories (e.g., habitat, diet, and behavior) and reanalyzing diversity in a multidimensional framework may offer more meaningful insights into chondrichthyan functional diversity through time (e.g., Gagic et al. Reference Gagic, Bartomeus, Jonsson, Taylor, Winqvist, Fischer, Slade, Steffan-Dewenter, Emmerson, Potts and Tscharntke2015).
Conclusions
Chondrichthyan remains were ubiquitously present in nearshore deposits from the Eocene through the Pleistocene of Florida. Based on specimens curated at the Florida Museum, at least 70 chondrichthyan taxa are known to occur in the Florida fossil record, representing 10 orders, 26 families, and 42 genera. At least 20 of these taxa represent first occurrences for the Florida fossil record, including: Hexanchus griseus, Heterodontus sp., Rhincodon sp., Alopias vulpinus, Carcharoides catticus, Jaekelotodus trigonalis, Parotodus benedenii, cf. Cetorhinus sp., Scyliorhinidae indet., Galeorhinus sp., cf. Mustelus sp., Hemipristis curvatus, Isogomphodon acuarius, Sphyrna lewini, Sphyrna tiburo, Pristis lathami, Rhinobatos sp., cf. Mobula hypostoma, cf. Mobula birostris, and Plinthicus stenodon. This study recognized 40% more taxa than the previous review of Florida's chondrichthyan fossil record (Hulbert Reference Hulbert2001), which is largely due to increased screenwashing efforts over the past 20 years, as well as increased curation effort (i.e., identification, cataloging, and imaging).
While the documentation of the chondrichthyan fossil record of the Florida Platform has improved significantly, this study found numerous gaps in sampling where additional taxa are likely to be recovered. Sampling is most complete from the middle to late Miocene, moderately complete from the early Miocene and Plio-Pleistocene, and poor from the Paleogene. Differences in sampling completeness across different time periods are due to lithologic controls, sampling methods, and research prioritizations. The Florida Platform experienced a gradual shift in the dominant lithology from carbonate to siliciclastic rocks during the Oligocene. Different weathering patterns associated with carbonate versus siliciclastic rocks result in vastly different distributions of chondrichthyan fossils, with siliciclastic units concentrating specimens in lag deposits. Differences in lithology also impact sampling methods, with siliciclastic units being more amenable to screenwashing than carbonate units. Further, avocational paleontologists have contributed to the recovery of large sample sizes of chondrichthyan fossils from middle to late Miocene units through targeted collecting for large teeth, such as those of Otodus megalodon. Finally, professional paleontologists have also contributed to the larger sample sizes of fossils from Neogene deposits by prioritizing research on the fossil record of terrestrial mammals, which are extremely uncommon from the Paleogene of Florida.
Chondrichthyan dentition types and ecomorphotypes indicate that sampling bias in favor of larger specimens suppresses diversity of demersal predators and filter-feeding specialists. Demersal predators are typically characterized as having a crushing or clutching dentition type. Ecomorphotypes separate these demersal predators into a wide variety of benthic types, including: squatinobenthic, probenthic, pristobenthic, rhynchobenthic, rhinobenthic, and rajobenthic. Except for pristobenthic taxa that possess large rostral denticles, the other benthic ecomorphotypes are almost exclusively found through screenwashing. Likewise, filter-feeding specialists (i.e., Rhincodon, Cetorhinus, and Mobula), corresponding with the microtrophic ecomorphotype, are also only recovered through screenwashing. Consequently, the absence of these ecomorphological groups in any given time bin may be related to the sampling methods employed.
Differences in sampling effort across the 12 time bins inhibit an accurate, holistic interpretation of chondrichthyan diversity patterns through time. Despite this limitation, based on the relative abundance of chondrichthyan orders, there is evidence in support of a taxonomic turnover from lamniform to carcharhiniform sharks between the Eocene and Oligocene. This turnover is evident in nearshore marine sites throughout the Atlantic and Gulf Coastal Plains. However, given the current temporal resolution of the chondrichthyan fossils from Florida, it is unclear whether this turnover occurred abruptly at the EOT or more gradually throughout the Paleogene.
Based on the relative abundance of chondrichthyan dentition types, the turnover between the Eocene and Oligocene corresponded with the preferential extinction of taxa with grasping-dominant dentition types. Taxa exhibiting cutting-dominant dentition types were less affected. In fact, taxa that survived from the order Lamniformes (e.g., Otodus) and Carcharhiniformes (e.g., Hemipristis) convergently adapted more advanced cutting-type teeth through the Oligo-Miocene. As cutting aids in the dismemberment of prey into smaller consumable portions, this morphological turnover may relate to a greater dietary emphasis on predation and scavenging on larger prey, such as marine mammals, teleost fish, and other sharks.
Acknowledgments
I would first like to thank my graduate committee, B. MacFadden, D. Jones, E. Martin, K. Bjorndal, and K. Crippen, for their constant support and guidance in producing this article. Thank you to R. Portell and R. Hulbert for their assistance in navigating the FLMNH collections and their willingness to share their own expertise regarding Florida geology and paleontology. I thank M. Kowalewski for teaching me the basics on how to use R and applying it to my research. I also wish to thank all the fossil collectors who donated specimens to the FLMNH, which made this research possible. In particular, I am ever grateful for K. Marks's intensive screenwashing efforts, eagerness to collaborate on research, and willingness to share many photographs. Likewise, I thank S. Moran for his efforts to digitize the FLMNH vertebrate paleontology collection and for allowing me to utilize his photographs. Finally, thank you to the reviewers and Paleobiology editorial team for helping to refine this publication. This study is based upon work supported by the Florida Education Fund McKnight Doctoral Fellowship and the National Science Foundation Graduate Research Fellowship program (grant no. DGE-1315138). This manuscript is University of Florida Contribution to Paleobiology number 882.
Data Availability Statement
Data available from the Dryad Digital Repository and Supplementary Material available at https://doi.org/10.5061/dryad.vx0k6djs5.
Supplementary Table 1. An excel spreadsheet of all chondrichthyan occurrences from Florida in the Florida Museum of Natural History vertebrate paleontology Specify Database (N = 117,449). Data include catalog number, taxonomy, nature of specimen, lithostratigraphy/biostratigraphy, site name, and county. https://doi.org/10.5061/dryad.1zcrjdfrm.
Supplementary Table 2. Chondrichthyan taxa from the Eocene through the Pleistocene of Florida cataloged in the Florida Museum of Natural History vertebrate paleontology Specify Database. Dentition types (Kent 1994) and ecomorphotypes (Compagno 1990) are inferred based on modern analogs. Asterisks (*) denote first occurrences for the Florida fossil record. Daggers (†) denote extinct taxa. See Supplementary Material attached to this article.
Supplementary Table 3. Relative abundance of chondrichthyan genera in each of the 12 time bins (N = 95,944). These data were used to calculate the diversity indices reported in Fig. 10. https://doi.org/10.5061/dryad.vx0k6djs5.
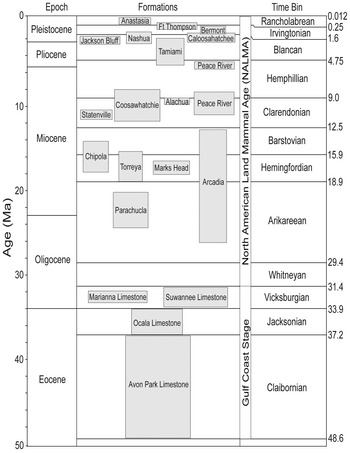
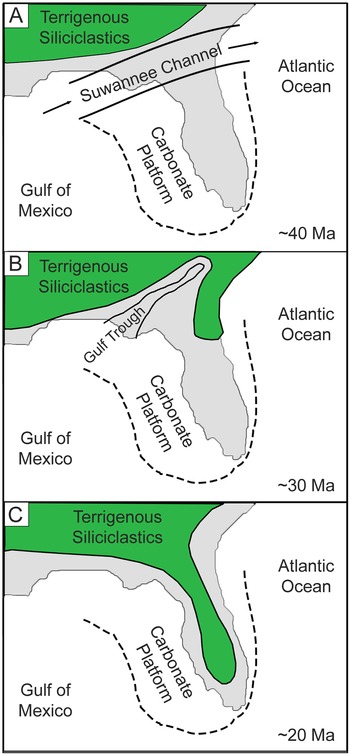


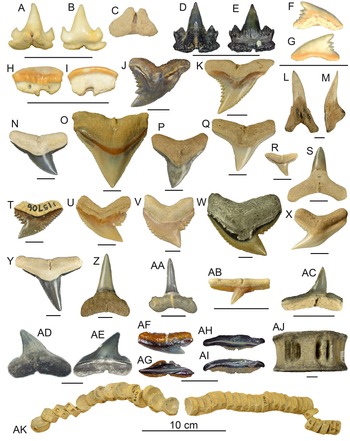
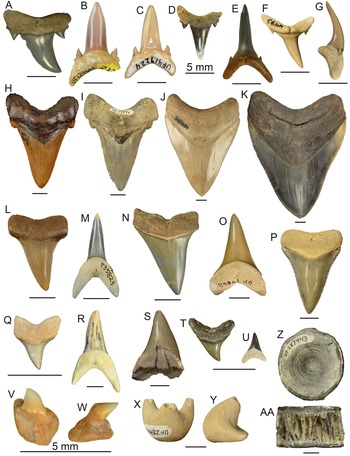
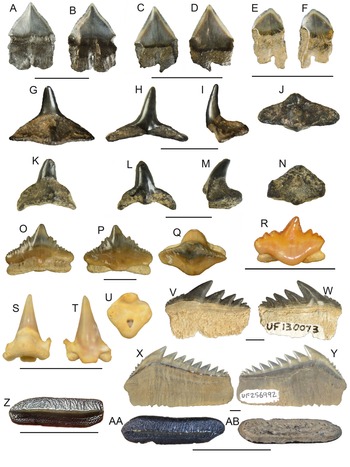

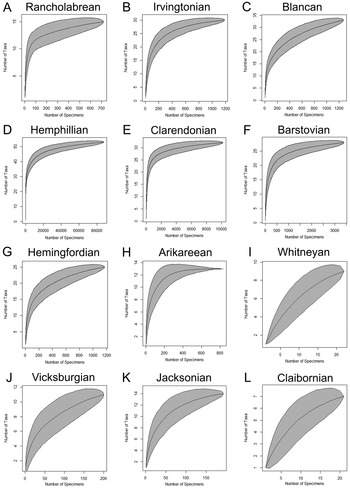

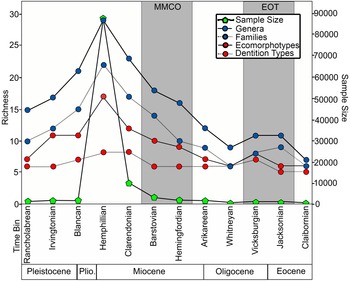

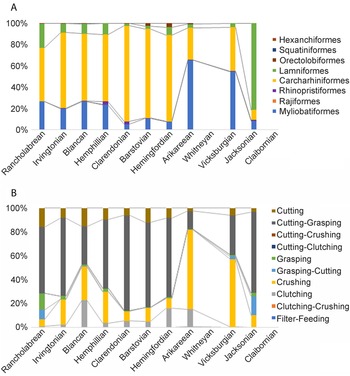


 Open access