


Many epidemiological studies have demonstrated that high alcohol intake is associated with an increased risk of mortality(Reference Griswold, Fullman and Hawley1,Reference Wood, Kaptoge and Butterworth2) , various types of cancer(Reference Bagnardi, Blangiardo and La Vecchia3,Reference Corrao, Bagnardi and Zambon4) and CVD(Reference Wood, Kaptoge and Butterworth2). Although a curvilinear dose–response relationship between alcohol intake and the risk of chronic diseases and mortality has often been observed, a meta-analysis of cohort studies has demonstrated a J-shaped association between alcohol intake and the incidence of CHD(Reference Griswold, Fullman and Hawley1,Reference Corrao, Bagnardi and Zambon4) . A reduction in the risk of CHD due to moderate alcohol intake is plausible, due to an improvement in the blood lipid profile. A meta-analysis of intervention studies has indicated that moderate alcohol intake significantly increases circulating HDL-cholesterol levels(Reference Rimm, Williams and Fosher5,Reference Brien, Ronksley and Turner6) , which has been proposed to have anti-atherogenic properties(Reference Rye, Bursill and Lambert7). Furthermore, several studies have reported that alcohol intake was inversely associated with circulating LDL-cholesterol levels(Reference Choudhury, Ueshima and Kita8–Reference Nakanishi, Yoshida and Nakamura10), which is a major cause of CHD, although other studies have conversely reported that heavy alcohol intake was associated with increased LDL-cholesterol levels(Reference Kwon, Kim and Park11,Reference Onat, Hergenc and Dursunoglu12) . Alcohol intake is also associated with circulating TAG levels, and J-shaped or U-shaped associations have been observed in several studies(Reference Rouillier, Boutron-Ruault and Bertrais13,Reference Kato, Kiyohara and Kubo14) .
Although several studies have shown the association between alcohol intake and blood lipid profile as described above, the association of a dietary pattern characterised by high alcohol intake with blood lipid or dyslipidaemia has not been fully investigated. Alcohol intake is potentially one of the most important determinants of dietary habits, a fact which is supported by a genetic association study showing that alcohol consumption-associated genetic loci are strongly associated with dietary habits(Reference Matoba, Akiyama and Ishigaki15). A diet consumed with high alcohol intake may not only affect lipid metabolism but also confound the association between alcohol intake and blood lipid levels. Therefore, studies on dietary patterns specific to alcohol drinkers will help to better understand the relationship between alcohol intake and lipid metabolism. Several studies conducting dietary pattern analysis by principal component analysis have identified the ‘alcohol dietary pattern’ as the major dietary pattern. Interestingly, the factor loadings characterising alcohol dietary patterns differed among the studies, and various patterns such as ‘red meat and alcohol’(Reference Kim, Joung and Shin16,Reference Alferink, Erler and de Knegt17) , ‘snacks and alcohol’(Reference Kolahdooz, Ibiebele and Van Der Pols18,Reference Pou, del Pilar Díaz and De La Quintana19) and ‘noodles and alcohol’(Reference Okada, Takahashi and Takimoto20,Reference Huang, Martins and Okada21) have been proposed. Therefore, there is a possibility that a dietary pattern specific to alcohol drinkers in each study has a different impact on the blood lipid profile. We previously identified a dietary pattern characterised by a high intake of alcoholic beverages and seafood among alumni of a Japanese university(Reference Ito, Kawakami and Tanisawa22). Because the consumption of fish, fish oil and alcohol intake itself has been reported to improve the blood lipid profile, the alcohol dietary pattern identified in Japan may be inversely associated with the prevalence of dyslipidaemia, and investigating it will provide useful information for the prevention and treatment of dyslipidaemia by modifying the diet. Therefore, we performed a cross-sectional study consisting of middle-aged and elderly individuals who are alumni of a Japanese university to examine the association between the alcohol dietary pattern and the prevalence of dyslipidaemia and its components.
Experimental methods
Participants
In this cross-sectional study, we used baseline survey data from the Waseda Alumni’s Sports, Exercise, Daily Activity, Sedentariness, and Health Study (WASEDA’S Health Study), which is a prospective cohort study aimed at examining the relationship between physical activity, exercise, sedentary behaviour, health outcomes and various correlates among the alumni of Waseda University and their spouses aged ≥40 years. The WASEDA’S Health Study consists of four cohorts (cohorts A–D) with different measurement items, and the participants selected one of the four cohorts when they registered for the study. The present study comprised a total 2544 individuals (men: n 1614, women: n 930) who participated in the baseline survey of cohort C or D between March 2015 and February 2020. We excluded participants based on the following criteria: (1) a history of heart diseases (n 196); (2) incomplete web-based questionnaires (n 93); (3) incomplete dietary survey (n 19); (4) extreme self-reported energy intake (<600 kcal/d or ≥4000 kcal/d) (n 10); (5) extreme self-reported physical activity (n 26); (6) consumption of breakfast before blood sampling (n 22) and (7) lack of blood biochemical parameters (n 7). Based on the above criteria, 2171 individuals (men, n 1354, mean age 55·5 (sd 10·1) years; women, n 817, mean age 51·5 (sd 8·1) years) were included in the analysis. All participants provided written informed consent before enrolment in the study, which was approved by the Ethical Committee of Waseda University (reference number. 2014-095, 2014-G002, 2018-320 and 2018-G001). The study was conducted in accordance with the principles of the Declaration of Helsinki.
Anthropometry
The participants visited the laboratory between 08.30 and 10.30 hours, and all measurements were conducted by trained investigators. Height was measured using a stadiometer (YHS-200D, YAGAMI Inc.). Body weight was measured using an electronic scale (MC-980A, Tanita Corp.), with the participants wearing light clothing and no shoes. BMI was calculated as body weight (kg) divided by the square of the body height (m). Waist circumference was measured at the umbilical region with an inelastic measuring tape at the end of normal expiration to the nearest 0·1 cm.
Blood sampling and analysis
Venous blood samples were collected by venepuncture after at least 12 h of overnight fasting. Blood samples were collected into serum separation tubes or EDTA-containing tubes and subsequently centrifuged at 3000 rpm at 4°C for 10 min using a centrifuge (Model 5911, Kubota). The serum levels of aspartate aminotransferase (AST), alanine aminotransferase (ALT) and γ-glutamyl transferase, and the concentrations of LDL-cholesterol, HDL-cholesterol, TAG, fasting insulin and plasma concentrations of fasting glucose were determined at BML, Inc.. The ALT:AST ratio was calculated as an index of alcoholic liver disease. The hepatic steatosis index(Reference Lee, Kim and Kim23) was calculated as an index of non-alcoholic fatty liver disease from the ALT, AST, BMI, sex and the presence of diabetes mellitus, using the following formula:
 \begin{align}\rm Hepatic\ steatosis\ index &= 8 \times \rm ALT:AST ratio+ BMI \\ &\quad \ (+2, \rm if\ diabetes\ mellitus; +2, if\ female)
\end{align}
\begin{align}\rm Hepatic\ steatosis\ index &= 8 \times \rm ALT:AST ratio+ BMI \\ &\quad \ (+2, \rm if\ diabetes\ mellitus; +2, if\ female)
\end{align}
Homoeostasis model assessment of insulin resistance (HOMA-IR) was calculated from the fasting concentrations of plasma glucose and serum insulin as follows:
 \begin{align}\rm HOMA-IR & =\rm (fasting\ glucose\ (mg/dl)) \\ &\quad\ \rm \times (fasting\ insulin\ (\mu U/ml))/405\end{align}
Dietary assessment
Dietary intake was assessed using a validated brief-type self-administered diet history questionnaire (BDHQ) in the preceding month, as described previously(Reference Ito, Kawakami and Tanisawa22,Reference Ito, Tanisawa and Kawakami24) . We carefully checked all the answered BDHQ to avoid the effect of misreporting. The BDHQ is a four-page questionnaire that takes about 15 min to complete. The dietary intake of fifty-eight food and beverage items, energy and selected nutrients were estimated using an ad hoc computer algorithm for the BDHQ, based on the Standard Tables of Food Composition in Japan(25). The validity of the dietary intake data (energy, nutrients and foods) assessed by the BDHQ was confirmed using 16-d semi-weighted dietary records as the gold standard(Reference Kobayashi, Murakami and Sasaki26,Reference Kobayashi, Honda and Murakami27) .
Other variables
Brachial systolic blood pressure and diastolic blood pressure were measured using the oscillometric method (HEM-7122; OMRON, Inc.), with participants at rest in a sitting position. Physical activity, marital status (yes or no), educational status (junior high/high school, junior college, technical college, college diploma), household income (<3 000 000 JPY, 3 000 000–5 000 000 JPY, 5 000 000–7 000 000 JPY, 7 000 000–10 000 000 JPY, >10 000 000 JPY), smoking status (current smoker, former smoker, non-smoker), use of cholesterol-lowering, TAG-lowering, antihypertensive and diabetes drugs (yes, no) were assessed via a web-based questionnaire survey. Moderate-to-vigorous physical activity (MVPA) was assessed using the Global Physical Activity Questionnaire(Reference Armstrong and Bull28) to quantify the physical activity level, and time spent in total MVPA (min/d) was calculated.
Definition of dyslipidaemia
Dyslipidaemia was defined as having at least one of the following components: high LDL-cholesterol levels (high LDL-cholesterol: fasting LDL-cholesterol level ≥140 mg/dl or use of cholesterol-lowering drugs), low HDL-cholesterol levels (low HDL-cholesterol, fasting HDL-cholesterol level <40 mg/dl for men; <50 mg/dl for women) and high TAG levels (high TAG: fasting TAG level ≥150 mg/dl or use of TAG-lowering drugs) according to the diagnostic criteria for assessing dyslipidaemia in Japan(Reference Teramoto, Sasaki and Ishibashi29). Because there is a sex difference in HDL-cholesterol of approximately 10 mg/dl, and several guidelines have defined low HDL-cholesterol as <50 mg/dl in women(Reference Alberti, Zimmet and Shaw30,Reference Alberti, Eckel and Grundy31) , we adopted different values to define low HDL-cholesterol in men and women.
Statistical analysis
To identify dietary patterns, we performed principal component analysis based on energy-adjusted food intake using a density method of fifty-two food and beverage items, as described previously(Reference Ito, Kawakami and Tanisawa22,Reference Ito, Tanisawa and Kawakami24) . We retained three factors based on their eigenvalues (>1), the slope of the scree plot and the interpretability of the factors. The differences in the characteristics across the quartiles of the alcohol dietary pattern scores were assessed by linear regression analysis (for continuous variables) and the Mantel–Haenszel χ 2 square test (for categorical variables). To evaluate the associations between each dietary pattern and the prevalence of dyslipidaemia and its components, we performed a logistic regression analysis and calculated the multivariate-adjusted OR and 95 % CI for the prevalence of dyslipidaemia, high LDL-cholesterol, low HDL-cholesterol and high TAG according to the quartile of each dietary pattern score, with the lowest quartile as the reference category. Since variables such as basic biological, socio-economic, medication and lifestyle habits were potentially related to both dietary patterns and blood lipid levels, model 1 was adjusted for age, sex, marital status, educational status, household income, use of antihypertensive drugs, use of diabetes drugs, smoking status, MVPA and energy intake. Model 2 was additionally adjusted for waist circumference and HOMA-IR to evaluate whether the observed association was mediated by abdominal obesity and insulin resistance. Model 3 was further adjusted for alcohol intake to evaluate the independent association between each dietary pattern and the prevalence of dyslipidaemia and its components. Sensitivity analysis excluding participants who took any medication was performed to evaluate potential bias associated with including those on medication. We additionally performed a subgroup analysis by sex to evaluate whether the association between the alcohol dietary pattern and the prevalence of dyslipidaemia and its components differed by sex. We added an interaction term (sex × dietary pattern (quartile)) to the model to test the significance of the interaction. The level of statistical significance was set at P < 0·05. All statistical analyses were performed using SPSS Statistics (version 25.0; SPSS, Inc.).
Results
Dietary pattern
We identified three dietary patterns using principal component analysis (Table 1). The first factor was named the healthy dietary pattern because it was characterised by a high intake of vegetables, fruits, soya products and fish. The second factor was characterised as a high intake of alcoholic beverages, liver, chicken and fish and was named the alcohol dietary pattern. The alcohol dietary pattern identified in the present study was similar to the ‘seafood and alcohol’ dietary pattern that we previously identified in the same cohort(Reference Ito, Kawakami and Tanisawa22). However, because the factor loadings of several items of seafood for the second factor were smaller than those of liver and chicken in the present study, we did not name the second factor as ‘seafood and alcohol’. The third factor was characterised by a high intake of pickled vegetables, noodles and fish, as well as low intake of animal meat (beef, pork and chicken) and was named the traditional Japanese dietary pattern. The first to third dietary patterns explained 19·1 % of the variance in food intake.
Table 1. Factor loading matrix for each dietary pattern identified by principal component analysis

A factor loading less than ± 0·15 is not shown.
* Fermented soyabeans.
† Deep-fried tofu.
‡ Savoury pancake with various ingredients (meat, fish and vegetable).
Characteristics of participants according to the quartile of alcohol dietary pattern score
Because this study focused on the alcohol dietary pattern, we compared the characteristics of participants across the quartiles of alcohol dietary pattern scores (Table 2). Compared with individuals with lower alcohol dietary pattern scores, those with higher scores were more likely to be men, more likely to report higher educational status, higher household income, higher use of TAG-lowering and antihypertensive drugs and were also more likely to be current or former smokers. The alcohol dietary pattern was positively associated with height, body weight, BMI, waist circumference, systolic blood pressure, diastolic blood pressure, AST, ALT, γ-glutamyl transferase, hepatic steatosis index, TAG, fasting glucose, HOMA-IR and MVPA, whereas it was inversely associated with LDL-cholesterol and HDL-cholesterol. The characteristics of male and female participants are shown in Supplementary Tables S1 and S2. Although the alcohol dietary pattern was positively associated with body weight, BMI, waist circumference, systolic blood pressure, diastolic blood pressure, AST, γ-glutamyl transferase, hepatic steatosis index and TAG in men, there were weak or no associations between these variables and the alcohol dietary pattern in women.
Table 2. Characteristics of participants according to the quartile of alcohol dietary pattern score
(Mean values and standard deviations, n 2171)
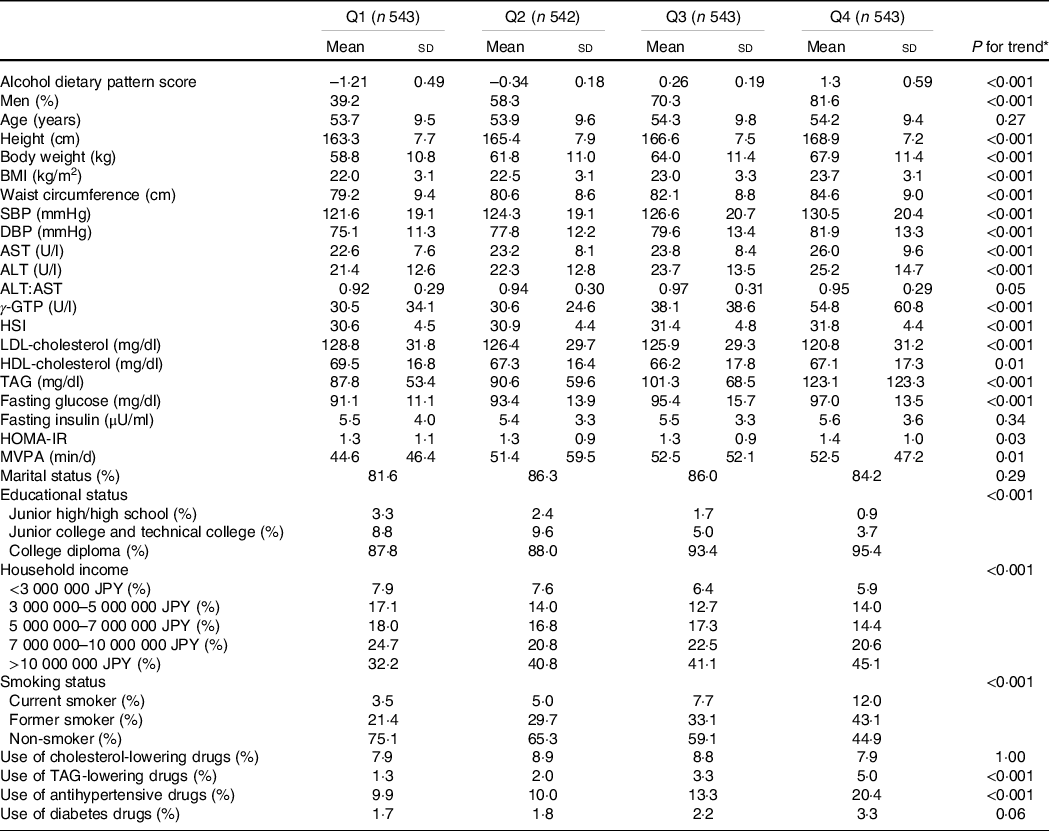
SBP, systolic blood pressure; DBP, diastolic blood pressure; AST, aspartate aminotransferase; ALT, alanine aminotransferase; γ-GTP, γ-glutamyl transpeptidase; HSI, hepatic steatosis index; HOMA-IR, homoeostasis model assessment of insulin resistance; MVPA, moderate-to-vigorous physical activity.
* P values were obtained from a linear regression analysis for continuous variables and Mantel–Haenszel χ 2 test for categorical variables.
Nutrient intake according to the quartile of alcohol dietary pattern score
The nutrient intake according to the quartiles of the alcohol dietary pattern score is shown in Table 3. The alcohol dietary pattern was positively associated with energy intake and energy percentage of protein, alcohol, n-3 PUFA, energy-adjusted intake of Na, Mg, P, Fe, Zn, vitamin A, vitamin D, vitamin K, niacin, vitamin B6, vitamin B12, pantothenic acid and cholesterol. Conversely, the alcohol diet pattern was inversely associated with the energy percentage of fat, carbohydrate, SFA, MUFA, energy-adjusted intake of Ca, Mn, α-tocopherol, vitamin B1, vitamin C and dietary fibre. The nutrient intake in men and women is shown in Supplementary Tables S3 and S4. The associations of most nutrient intake with the alcohol dietary pattern were similar between men and women. However, although the alcohol dietary pattern was positively associated with the energy percentage of PUFA and n-6 PUFA, and energy-adjusted intakes of K, Ca, Cu, α-tocopherol, vitamin B1 and vitamin B2 in women, there were no associations or inverse associations of these variables with alcohol dietary pattern in men.
Table 3. Nutrient intake according to the quartile of alcohol dietary pattern score (n 2171)
(Mean values and standard deviations)
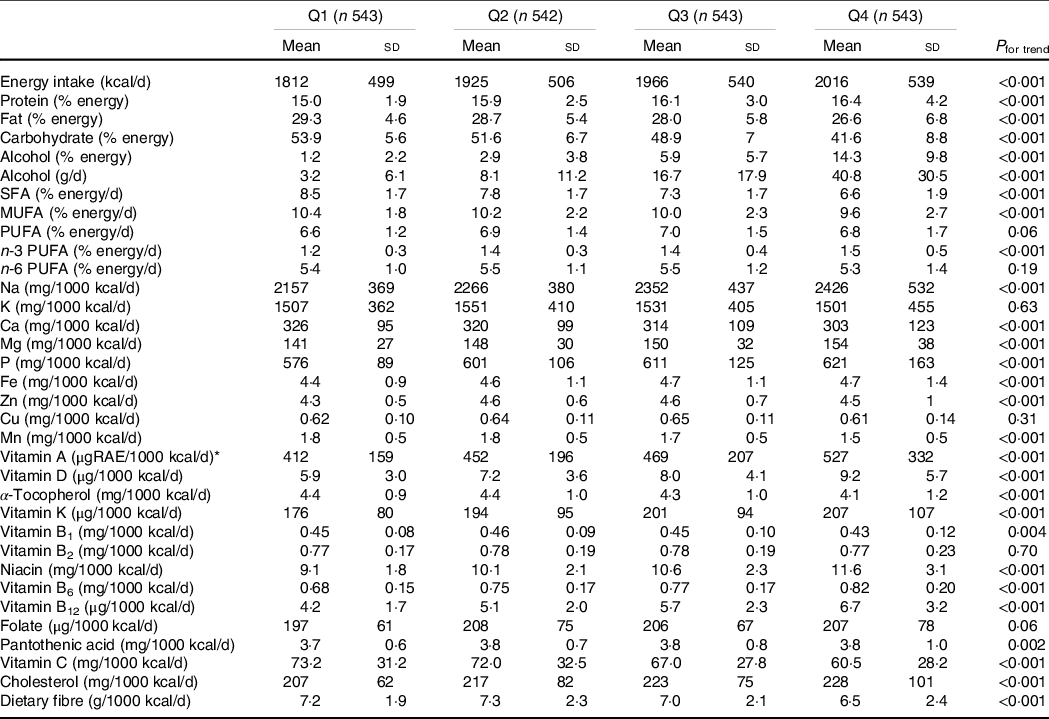
RAE, retinol activity equivalent.
* 1 μgRAE = retinol (μg) + β-carotene (μg) × 1/12 + α-carotene (μg) × 1/24 + β-cryptoxanthin (μg) × 1/24 + other provitamin A carotenoids (μg) × 1/24.
Association between dietary patterns and the prevalence of dyslipidaemia and its components
The prevalence of dyslipidaemia, high LDL-cholesterol, low HDL-cholesterol and high TAG was 45·9 %, 37·0 %, 3·8 % and 16·2 %, respectively. Table 4 shows the OR and 95 % CI for the prevalence of dyslipidaemia and its components according to the quartiles of the alcohol dietary pattern score. A logistic regression model adjusted for potential confounders showed no significant association between alcohol dietary patterns and the prevalence of dyslipidaemia in any model. However, the alcohol dietary pattern was significantly associated with components of dyslipidaemia. It was significantly inversely associated with the prevalence of high LDL-cholesterol (P for trend = 0·003), and this inverse association remained significant after adjusting for waist circumference and HOMA-IR in model 2 (P for trend = 0·001) and alcohol intake in model 3 (P for trend = 0·03). The fully adjusted OR (95 % CI) of the prevalence of high LDL-cholesterol for the lowest to the highest quartile of the alcohol dietary pattern score were 1·00 (reference), 0·83 (0·64, 1·08), 0·84 (0·64, 1·10) and 0·68 (0·49, 0·94), respectively. Furthermore, the alcohol dietary pattern was positively associated with the prevalence of high TAG in model 1 (P for trend = 0·02), and multivariate-adjusted OR (95 % CI) of the prevalence of high TAG for the lowest through highest quartile of the alcohol dietary pattern score were 1·00 (reference), 1·03 (0·70, 1·52), 1·12 (0·76, 1·64) and 1·49 (1·03, 2·16), respectively. However, this association was no longer significant in model 2 (P for trend = 0·06) and model 3 (P for trend = 0·40). In addition, there was no significant association between alcohol dietary patterns and the prevalence of low HDL-cholesterol.
Table 4. Prevalence of dyslipidaemia and its components according to the quartile of alcohol dietary pattern score
(Odds ratio and 95 % confidence intervals, n 2171)

HOMA-IR, homoeostasis model assessment of insulin resistance; MVPA, moderate-to-vigorous physical activity.
* Adjusted for age, sex, marital status, educational status, household income, use of antihypertensive drugs, use of diabetes drugs, smoking status, MVPA, energy intake.
† Additionally adjusted for waist circumference and HOMA-IR.
‡ Additionally adjusted for alcohol intake (g/d).
Since individuals with higher alcohol dietary patterns were likely to use medications, sensitivity analysis excluding those on any medication was performed. After excluding the participants who took any medication (cholesterol-lowering, TAG-lowering, antihypertensive and diabetes drugs), 1737 participants were included in the sensitivity analysis. As shown in Supplementary Table S5, there was no significant change in the OR before and after excluding those on any medication. The association between alcohol dietary pattern and reduced LDL-cholesterol level remained significant after the exclusion. The fully adjusted OR (95 % CI) of the prevalence of high LDL-cholesterol for the lowest to the highest quartile of the alcohol dietary pattern score were 1·00 (reference), 0·77 (0·58, 1·03), 0·81 (0·60, 1·10) and 0·64 (0·44, 0·94), respectively.
Although we focused on an alcohol dietary pattern in the present study, the associations of healthy or traditional Japanese dietary patterns with the prevalence of dyslipidaemia and its components were also analysed, as shown in Supplementary Tables S6 and S7. A healthy dietary pattern was significantly and inversely associated with the prevalence of dyslipidaemia (P for trend = 0·04), low HDL-cholesterol (P for trend = 0·04) and high TAG (P for trend < 0·001) in model 1, and the associations with low HDL-cholesterol and high TAG remained significant in model 3 (P for trend = 0·04, low HDL-cholesterol and 0·04 for high TAG, respectively). There was no significant association between healthy dietary patterns and the prevalence of high LDL-cholesterol in any model. The traditional Japanese dietary pattern was not significantly associated with the prevalence of dyslipidaemia, high LDL-cholesterol, low HDL-cholesterol or high TAG in any model.
Subgroup analysis
Table 5 shows the results of subgroup analysis by sex. We found a significant interaction between sex and the alcohol dietary pattern for the prevalence of dyslipidaemia (P for interaction = 0·008 in model 3), while a significant inverse association between alcohol dietary pattern and the prevalence of dyslipidaemia was observed only in women (P for trend = 0·01, model 3), not in men. There was no significant interaction between sex and the alcohol dietary pattern for the prevalence of high LDL-cholesterol, and the alcohol dietary pattern was inversely associated with high LDL-cholesterol in both men and women in model 2 (P for trend = 0·04, for men and 0·003 for women). This inverse association remained significant after adjusting for alcohol intake in women (P for trend = 0·007); however, it was no longer significant in men (P for trend = 0·37). We observed an opposing association between the alcohol dietary pattern and the prevalence of high TAG between men and women, although the interaction between sex and the alcohol dietary pattern was not significant (P for interaction = 0·07 in model 3). In men, the alcohol dietary pattern was positively and significantly associated with the prevalence of high TAG in model 2 (P for trend = 0·02). This association was no longer significant after adjusting for alcohol intake (P for trend = 0·12). In contrast, an inverse association between the alcohol dietary pattern and the prevalence of high TAG was observed in women, although it did not reach statistical significance (P for trend = 0·14 in model 3).
Table 5. Prevalence of dyslipidaemia and its components according to the quartile of alcohol dietary pattern score in men (n 1354) and women
(Odds ratio and 95 % confidence intervals, n 817)
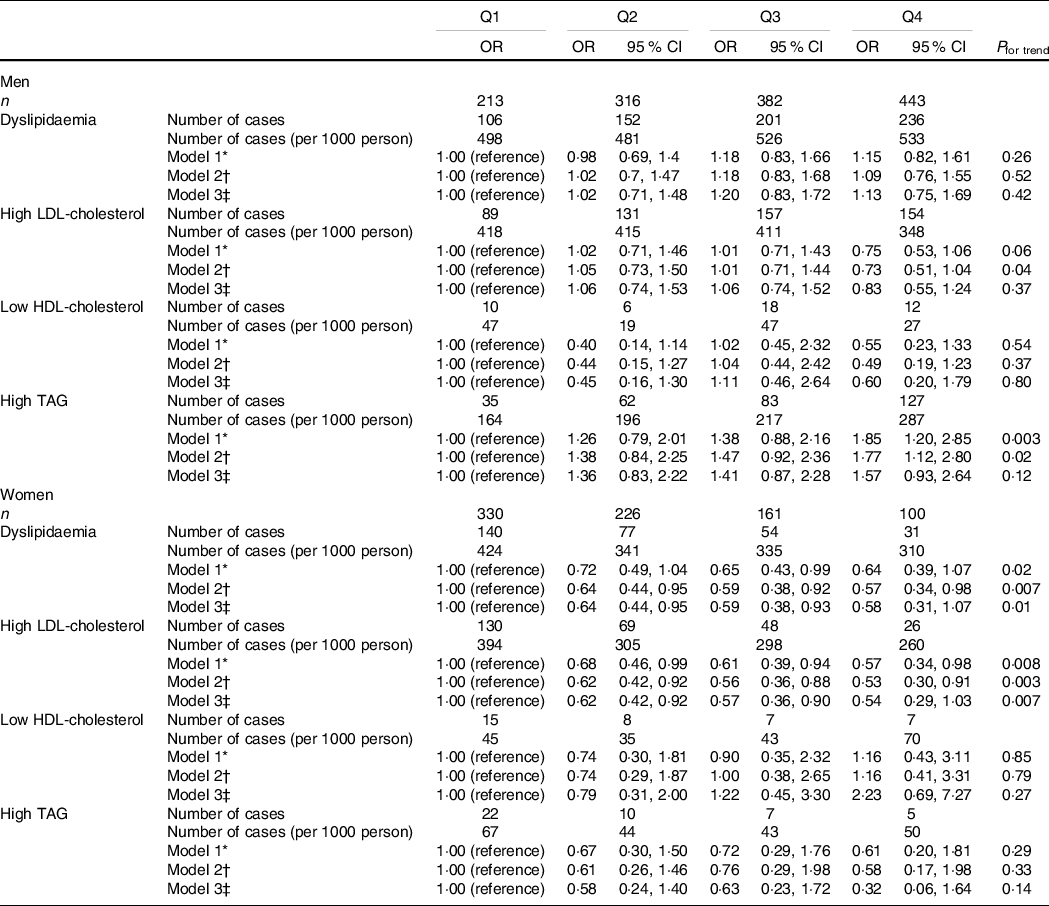
HOMA-IR, homoeostasis model assessment of insulin resistance; MVPA, moderate-to-vigorous physical activity.
* Adjusted for age, sex, marital status, educational status, household income, use of antihypertensive drugs, use of diabetes drugs, smoking status, MVPA, energy intake.
† Additionally adjusted for waist circumference and HOMA-IR.
‡ Additionally adjusted for alcohol intake (g/d).
Discussion
We performed a cross-sectional study to examine the association between alcohol dietary patterns and the prevalence of dyslipidaemia and its components. We subsequently demonstrated that the alcohol dietary pattern characterised by a high intake of alcoholic beverages, liver, chicken and fish was inversely associated with the prevalence of high LDL-cholesterol. Subgroup analysis also showed that the alcohol dietary pattern was inversely associated with the prevalence of dyslipidaemia in women, while it was positively associated with the prevalence of high TAG in men.
In the present study, the prevalence of each dyslipidaemia component differed according to sex (Table 5). In women, the prevalence of low HDL-cholesterol and high TAG was low and most cases of dyslipidaemia had high LDL-cholesterol levels. Therefore, we postulate that the inverse association between the alcohol dietary pattern and the prevalence of dyslipidaemia in women was due to its inverse association with high LDL-cholesterol levels. Conversely, the prevalence of high TAG was higher in men than in women. Although an inverse association between the alcohol dietary pattern and high LDL-cholesterol level was also observed in men, the alcohol dietary pattern was positively associated with the prevalence of high TAG (Table 5). This opposite direction of the associations could explain why the alcohol dietary pattern was not associated with the prevalence of dyslipidaemia in men.
There are several possible reasons why the alcohol dietary pattern was inversely associated with high LDL-cholesterol levels. The first is that alcohol itself may have an LDL-cholesterol-lowering effect; this has been supported by previous studies which reported an inverse association between alcohol intake and LDL-cholesterol levels(Reference Choudhury, Ueshima and Kita8–Reference Nakanishi, Yoshida and Nakamura10). Although the mechanism by which alcohol intake decreases LDL-cholesterol level has not been fully elucidated, it has been suggested that modification of LDL by acetaldehyde, a metabolite of alcohol, enhances the degradation of LDL, thereby reducing LDL-cholesterol levels(Reference Kesäniemi, Kervinen and Miettinen32). The second possible reason is that the nutrients consumed with high alcohol intake may have an LDL-cholesterol-lowering effect, which is supported by the inverse association between the alcohol dietary pattern and high LDL-cholesterol levels independent of alcohol intake in this study (Table 4). The factor loadings from the principal component analysis showed that the alcohol dietary pattern in the present study was characterised by a high intake of alcoholic beverages, liver, chicken and variety of fish, and low intake of dairy products, breads, variety of fruits and confectioneries (Table 1). We can assume that several nutrients enriched in these food items potentially affect blood lipid levels. For example, SFA intake in both men and women was lower in individuals with higher alcohol dietary pattern scores (Table 3, Supplementary Table S3 and S4). Intervention studies have shown that substitution of carbohydrates with SFA increases LDL-cholesterol levels(Reference Mensink, Zock and Kester33); it is therefore plausible that a lower SFA intake accompanied by a higher alcohol dietary pattern contributed to the low prevalence of high LDL-cholesterol. Lower carbohydrate intake was also characteristic of individuals with higher alcohol dietary pattern scores (Table 3, Supplementary Table S3 and S4). This seems to contradict previous studies that have demonstrated that a low-carbohydrate diet increases LDL-cholesterol levels(Reference Retterstøl, Svendsen and Narverud34,Reference Mansoor, Vinknes and Veierod35) . However, a plant-based low-carbohydrate diet with a low SFA has been shown to decrease LDL-cholesterol levels(Reference Jenkins, Wong and Kendall36). This suggests that increased intake of SFA, but not decreased intake of carbohydrates, has an LDL-cholesterol-raising effect. In the present study, individuals with higher alcohol dietary pattern scores showed lower intakes of both carbohydrates and SFA, which may contribute to the low prevalence of high LDL-cholesterol. Furthermore, individuals with higher alcohol dietary pattern scores showed a higher intake of micronutrients such as Na, Mg, Fe, vitamin A, vitamin D, vitamin K, niacin, vitamin B6 and vitamin B12. This raises the hypothesis that these micronutrients synergistically affect LDL-cholesterol levels. Although blood levels of some of these nutrients have been suggested to be associated with blood lipid levels(Reference Sun, Cao and Tanisawa37,Reference Al-Musharaf, Aljuraiban and Hussain38) , the evidence to support this hypothesis remains insufficient.
The subgroup analysis showed a significant association between alcohol dietary patterns and reduced LDL-cholesterol levels after adjusting for alcohol intake only in women, but not in men (Table 5). This result suggests that the association between the alcohol dietary pattern and reduced LDL-cholesterol levels in men was mainly due to the LDL-cholesterol-lowering effect of alcohol, while that in women was due to other dietary factors, but not alcohol intake. The most plausible explanation for this observation could be the difference in nutrient intake across the quartile of the alcohol dietary pattern between men and women. However, the associations of most nutrient intake with the alcohol dietary pattern were similar between men and women (Supplementary Tables S3 and S4). Furthermore, although several nutrient intakes were associated with the alcohol dietary pattern only in women, none of these nutrients were correlated with LDL-cholesterol levels (data not shown). Further studies are needed to identify the nutrient and non-nutrient factors that can explain the sex difference in the association between alcohol dietary patterns and reduced LDL-cholesterol levels.
Unlike the association between the alcohol dietary pattern and high LDL-cholesterol level, a positive association between the alcohol dietary pattern and the prevalence of high TAG was observed (Table 4). This association was no longer significant after adjustment for alcohol intake, suggesting that high alcohol intake contributed to high TAG levels. It is well known that chronic alcohol intake increases the synthesis of very LDL-TAG in the liver(Reference Crouse and Grundy39), which is the main source of circulating TAG in patients with hypertriglyceridaemia. Interestingly, a positive association between the alcohol dietary pattern and high TAG was observed only in men, whereas women showed an inverse association between them, although this association was not statistically significant (Table 5). Consistent with the results of the present study, previous studies have reported that moderate alcohol intake was associated with decreased TAG levels in women(Reference Taylor, Carter and Valente40,Reference Baer, Judd and Clevidence41) . It has been reported that women have a higher TAG-rich lipoprotein clearance capacity than men(Reference Matthan, Jalbert and Barrett42), which could explain the sex difference in the association between the alcohol dietary pattern and high TAG.
Several studies have reported an association between alcohol dietary patterns and the prevalence of dyslipidaemia or blood lipid levels(Reference Suliga, Kozieł and Cieśla43–Reference Guo, Niu and Monma46). Although the factor loadings characterising alcohol dietary patterns were different among these studies, a positive association between the alcohol dietary pattern score and the prevalence of high TAG or circulating TAG levels was consistently observed. The consistent results among the studies may be due to a TAG-raising effect of alcohol, rather than the diet consumed in conjunction with high alcohol intake, as we suggested in the present study. On the other hand, a few studies have reported an association between alcohol dietary patterns and circulating LDL-cholesterol levels, although results among the studies are inconsistent(Reference Sauvageot, Leite and Alkerwi44,Reference Guo, Niu and Monma46) . For example, Sauvageot et al. identified ‘animal protein and alcohol’ dietary patterns by rank regression analysis in a Western European population and reported a positive association between its score and LDL-cholesterol levels(Reference Sauvageot, Leite and Alkerwi44). In contrast, Guo et al. identified the ‘Izakaya (Japanese Pub)’ dietary pattern by principal component analysis in Japanese men and reported an inverse association between its score and LDL-cholesterol levels(Reference Guo, Niu and Monma46). There are two possible explanations for the inconsistent results among the studies. The first possible explanation is the difference in the LDL-cholesterol-lowering effect of alcohol intake among populations. A previous study reported a stronger association between serum LDL-cholesterol and alcohol intake in the mutant allele carriers of aldehyde dehydrogenase (ALDH2) rs671 polymorphism than that in the homozygous wild-type carriers in the Japanese population(Reference Sasakabe, Wakai and Kawai47). This finding suggests that a decreased capacity for acetaldehyde metabolism enhances the LDL-cholesterol-lowering effect of alcohol intake. Considering the allele frequency of ALDH2 rs671 in a large-scale biobank in Japanese(Reference Sakaue, Akiyama and Hirata48), more than 40 % of participants in the present study and the study by Guo et al. are expected to have a mutant allele of ALDH2 rs671. This possibly contributed to the association between alcohol dietary pattern and reduced LDL-cholesterol levels in these studies. The second possible explanation is the difference in the diet consumed with high alcohol intake among the studies. The ‘animal protein and alcohol’ dietary pattern identified by Sauvageot et al. were characterised by high intakes of lean meat and offal(Reference Sauvageot, Leite and Alkerwi44), whereas the ‘Izakaya’ dietary pattern identified by Guo et al. was characterised by high intakes of fish and seafood(Reference Guo, Niu and Monma46), like that identified in the present study. These dietary patterns may confound the association between alcohol intake and LDL-cholesterol levels, which may have led to inconsistent results among previous studies, although these studies did not examine whether the associations between dietary patterns and LDL-cholesterol levels were independent of alcohol intake. We showed that the alcohol dietary pattern was inversely associated with high LDL-cholesterol levels, independent of alcohol intake, highlighting the importance of assessing the diet consumed with high alcohol intake for a better understanding of the relationship between alcohol intake and dyslipidaemia.
As expected, a healthy dietary pattern was inversely associated with the prevalence of dyslipidaemia in this study (online Supplementary Table S6). Because the association between the healthy dietary pattern and dyslipidaemia was no longer significant after adjustment for waist circumference and HOMA-IR, this association was possibly mediated by insulin resistance induced by abdominal obesity. Interestingly, a healthy dietary pattern was inversely associated with the prevalence of low HDL-cholesterol and high TAG, but not with the prevalence of high LDL-cholesterol, suggesting that a healthy dietary pattern does not have a preventive effect against high LDL-cholesterol levels. Similar to previous studies(Reference Ito, Kawakami and Tanisawa22,Reference Ito, Tanisawa and Kawakami24,Reference Suliga, Kozieł and Cieśla43,Reference Sauvageot, Leite and Alkerwi44) , the healthy dietary pattern in the present study was characterised by a high intake of vegetables, fruits, soya products and fish. High intake of these food items was associated with a high intake of dietary fibre and micronutrients (data not shown), some of which are potentially associated with decreased levels of LDL-cholesterol. However, a healthy dietary pattern was also associated with a high intake of SFA, which is a major risk factor for high LDL-cholesterol (data not shown). Therefore, the beneficial effects brought about by the healthy dietary pattern may be cancelled by the high intake of SFA. This finding is important, as it suggests that a healthy dietary pattern believed to have beneficial effects on metabolic health is not always associated with a better lipid profile. Although a healthy dietary pattern may have a protective effect against low HDL-cholesterol and high TAG, the alcohol dietary pattern identified in this study would be recommended for individuals predisposed to high LDL-cholesterol if they are free from other metabolic risk factors. Nevertheless, as heavy alcohol consumption is undoubtedly associated with an increased risk of mortality and various chronic diseases, including cancer, it should be noted that drinking too much alcohol is not recommended.
The present study has several limitations. First, its cross-sectional design does not allow inference of causality. Prospective cohort studies or intervention studies are required to elucidate the causal relationship between alcohol dietary patterns and the incidence of dyslipidaemia. Second, the participants of this study were alumni of the same university and their spouses in Japan; therefore, the results may have been affected by selection bias. In fact, the majority of participants in the present study had a household income of more than 10 000 000 JPY, which is much higher than that of the general Japanese population. Given the fact that socio-economic status is reported to be associated with blood lipid and dietary patterns in the Japanese population(Reference Nishi, Horikawa and Murayama49,Reference Fujiyoshi, Arima and Satoh50) , caution should be exercised when generalising our findings to the general Japanese population. Further investigations among representative populations are necessary to generalise our findings to the entire Japanese population and other populations. Third, we did not consider menopausal status in women. Oestrogen has a lipid-lowering effect(Reference Knopp, Zhu and Bonet51), and postmenopausal women have higher levels of LDL-cholesterol and TAG than premenopausal women(Reference De Aloysio, Gambacciani and Meschia52). Therefore, menopausal status should be included as a covariate.
In conclusion, the present study revealed that the alcohol dietary pattern characterised by a high intake of alcoholic beverages, liver, chicken and fish was associated with the prevalence of dyslipidaemia and its components. This finding provides useful information for the prevention and treatment of dyslipidaemia by modifying the diet.
Acknowledgements
The authors would like to thank all the participants and staff of the WASEDA’S Health Study.
This study was supported in part by grants from the Japan Society for Promotion of Science (JSPS) KAKENHI Scientific Research (B) (M. H., grant number 18H03198; I. M., grant number 19H04008; K. T., grant number 19H0406) and MEXT-Supported Program for the Strategic Research Foundation at Private Universities, 2015–2019 from the Ministry of Education, Culture, Sports, Science and Technology (grant number S1511017).
K. T., T. I. and M. H. designed the study. K. T. drafted the manuscript. K. T. and R. K. performed the statistical analyses. K. T., T. I., R. K., C. U., T. K., K. S. and K. I. conducted the investigation. S. S., I. M., K. O. and M. H. conceived and supervised the study. All authors reviewed and approved the final manuscript.
There are no conflicts of interest.
Supplementary material
For supplementary material referred to in this article, please visit https://doi.org/10.1017/S0007114521002671


 Open access