


Childhood obesity has become a serious public health concern worldwide(Reference Gortmaker, Swinburn and Levy1–Reference Wang and Lobstein4). About 1/3 of children and 1/2 of adults in China are overweight or obese (ov/ob)(Reference Wang, Wang and Qu5). A complex interplay among biological, environmental and behavioural factors has contributed to the rising obesity epidemic(Reference Lobstein, Jackson-Leach and Moodie2). The role of these factors in China has not been well elucidated.
Familial clustering of ov/ob among parents and children is prevalent(Reference Cameron, Crawford and Salmon6), which is likely due to their shared genes, environmental factors and lifestyle behaviours. As primary agents of socialisation, parents have strong impacts on child lifestyle behaviours(Reference Yee, Lwin and Ho7,Reference Xu, Wen and Rissel8) . Obesogenic lifestyles and behavioural traits can be easily passed down from parents to children through family socialisation processes(Reference Hood, Moore and Sundarajan-Ramamurti9), which contribute to similarities in parent–child (P–C) weight status. Most of the existing studies were conducted in Caucasian populations and/or in high-income countries(Reference Wang, Min and Khuri10). Therefore, there is little knowledge about the P–C resemblance in weight status in China and other developing countries.
Some studies from Western countries have indicated that socio-demographic factors and types of P–C pairs may affect the resemblance in weight status. For example, in our 2017 systematic review of thirty-two studies in this field, the resemblance in P–C weight status varied by socio-demographic factors, such as age and country’s economic level(Reference Wang, Min and Khuri10). Mixed findings were reported on the types of P–C pair and the gender differences in P–C resemblance in weight status (e.g. mother–son, mother–daughter, father–son and father–daughter) in Western countries(Reference Liu, Chen and Liang11). However, no studies have examined this in China. The resemblance in P–C weight status also varied by parental age and education, and family income in the USA(Reference Zhang, Lamichhane and Chen12). Understanding such variations could help design a tailored family-based childhood obesity intervention in China.
In addition to socio-demographic factors, other modifiable childcare characteristics are associated with P–C resemblance in weight status. For example, in many developing countries, including China, grandparents are important caregivers for young children and decide what food is prepared for the family to consume. P–C resemblance in weight status for these children may be different from that of children mainly cared for by their parents. In some countries, many school-age children eat in school cafeterias on weekdays; thus, they may have different diets from that of their parents. Lower frequency of children having diets similar to their parents may reduce resemblance with their parents in weight status. However, no studies have examined the effects of these modifiable factors. Such research could provide valuable information about the aetiology of obesity and suggest new strategies for family-based obesity interventions.
To fill these knowledge gaps, using data collected from school-age children, their parents and schools in five mega-cities across China, we aimed to (1) examine P–C (including mother–son, mother–daughter, father–son and father–daughter) resemblance in weight status (BMI and ov/ob status) and (2) examine the potential modifying effects of socio-demographic and childcare characteristics on the resemblance.
Methods
Study design and participants
This study used the 2017 data from the Childhood Obesity Study in China Mega-cities (n 1973), a USNIH-funded study that examines the aetiology of childhood obesity and chronic diseases in China. Five mega-cities were selected across China, including Beijing (capital, North), Shanghai (Southeast), Nanjing (Southeast), Xi’an (Northwest) and Chengdu (Southwest) (Fig. 1). These cities reflect rapid economic growth and lifestyle behaviour changes, and they are already heavily burdened with obesity in China. More details on this study have been published elsewhere(Reference Jia, Li and Xue13).

Fig. 1 The geographical location, population size and economic status of the five mega-cities across China (Beijing, Shanghai, Nanjing, Xi’an and Chengdu) in 2017. Data source: Statistical Yearbook of China, 2017
In each of the cities, two primary schools and two middle schools were randomly selected, then one class was randomly selected from the third to sixth grades of each primary school and one from the seventh to ninth grades of each middle school. All students in the sampled classes were asked to complete a self-administered questionnaire in Chinese language in the classroom. The primary caregivers of children (1288 (67·6 %) were mothers) completed the same self-administered questionnaire at home(Reference Jia, Li and Xue13,Reference Li, Xue and Jia14) . Data on child growth, health and family characteristics were collected.
In the final data analysis, we only included mother-son, mother-daughter, father-son, or father-daughter with complete data on child age, child residence in the current semester, child primary caregiver, BMI, whether children ate the same meal as their parents, and whether children had dinner with their parents, as well as data on maternal age and education level, BMI, paternal age and education level, and family homeownership. Due to missing data on some of these characteristics, the sample size varied across the four dyads: 631 for father-son, 688 for father-daughter, 627 for mother-son, and 688 for mother-daughter (Fig. 2). Only one child per family participated in this survey, and their mother and father were also included in the survey. Maternal and paternal information were reported by the primary caregiver of children (mostly mothers).
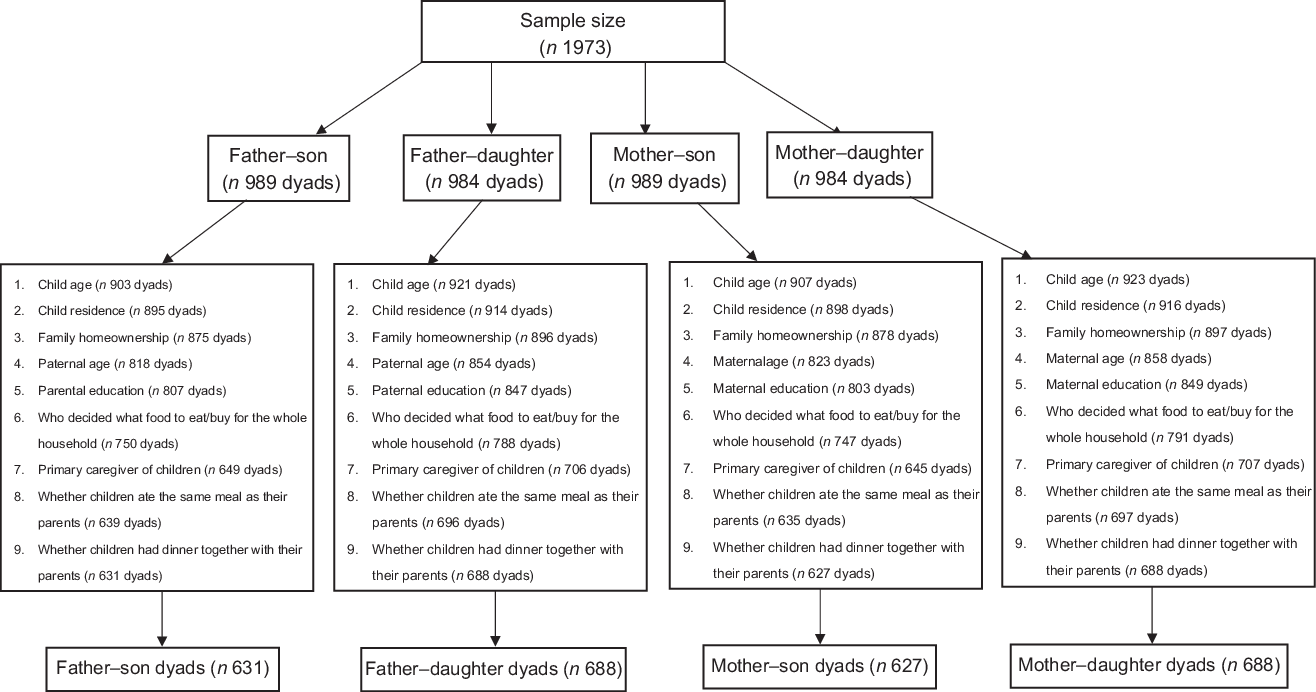
Fig. 2 The sample of child–parent pairs based on data from the five mega-cities across China (Beijing, Shanghai, Nanjing, Xi’an and Chengdu) in 2017
This study was conducted according to the guidelines laid down in the Declaration of Helsinki, and all procedures involving study participants were approved by the Ethical Committee of the State University of New York at Buffalo and related collaborative institutes in China. Written informed consent was obtained from all subjects.
Key study variables and measurements
Definition of weight status
Children’s height was measured using Seca 213 Portable Stadiometer Height-Rods (Seca China) with a precision of 0·1 cm; body weight was measured using Seca 877 electronic flat scales (Seca China) with a precision of 0·1 kg by trained health professionals. Paternal and maternal height and weight were reported by the children’s primary caregiver (mostly mothers).
BMI was calculated as weight (kg) divided by height squared (m2). Child weight status (underweight/normal weight, overweight and obesity) was defined based on the age- and gender-specific BMI cut-off points issued by the National Health Commission of the People’s Republic of China (underweight/normal weight: <85th percentile; 85th percentile ≤ overweight < 95th percentile; 95th percentile ≤ Obesity)(15). Paternal and maternal BMI Z-scores were calculated using the measured value minus the average value and divided by the sd of the sample. Paternal and maternal weight status were defined based on the Chinese standard proposed by the Working Group on Obesity in China(Reference Zhou16): normal-weight or underweight BMI ≤ 23·9 kg/m2; overweight BMI ≤24·0 kg/m2–≤27·9 kg/m2; obese BMI ≥ 28·0 kg/m2.
Socio-demographic and childcare characteristics
Socio-demographic characteristics included the children’s age (6–9, 10–14 and 15–17 years) and gender, family homeownership (rent or share residency with relatives, own an apartment and own a house), parental age (25–39, 40–44 and 45–63 years) and parental education (≤middle school, high or vocational schools and ≥college).
Childcare characteristics included people who made the decision about what food to eat/buy for the whole household (mother, father, grandparents and child), the primary caregiver of the children (mother, father, grandparents and babysitter/others), whether children ate the same meal as their parents (yes, most times; yes, sometimes; and no), whether children had dinner with their parents (yes, most times; yes, sometimes; and no) and child residence in the current semester (home, school and other places).
Statistical analysis
Analyses were conducted using Stata 14 (StataCorp). Statistical significance was set at P < 0·05. First, we conducted χ 2 tests (for categorical variables) and ANOVA (for continuous variables) to test gender differences for key variables. Then, we conducted the following analyses:
Analysis for Aim 1
We examined P–C resemblance in BMI and weight status using two statistical methods: Pearson correction and kappa. First, we calculated Pearson correlation coefficients between the standard scores of children’s BMI-for-age Z-score and parental BMI Z-score. Additionally, we calculated partial correlation coefficients by controlling for socio-demographic and childcare characteristics(Reference Brown and Hendrix17). To adjust for the multiple comparison testing effects, the Bonferroni test was used. We identified significant effect modifiers by comparing correlation coefficients across sub-samples stratified by specific effect modifiers (i.e. socio-demographic and childcare characteristics). To explore the age trends on P–C resemblance, we fit weighted least square curves of Pearson correlation coefficients against child age for each parent–child dyad.
Second, observed agreements and weighted kappa coefficients of child and parental weight status (underweight/normal weight, overweight and obesity) were calculated. Weighted kappa coefficients consider the possibility of the agreement occurring by chance(Reference Cohen18). To adjust for the multiple comparison testing effects, the Bonferroni test was used. Weighted kappa values were interpreted as follows: k < 0·20 = poor agreement, 0·20 ≤ k < 0·40 = fair agreement, 0·40 ≤ k < 0·60 = moderate agreement, 0·60 ≤ k < 0·80 = good agreement and k ≥ 0·80 = very good agreement(Reference Cameron, Crawford and Salmon6,Reference Knowlden and Sharma19) .
Analysis for Aim 2
Multinomial logistic regression models were fit to explore potential social-demographic and childcare factors that might predict the pattern of father–child and mother–child concordances. Based on the pattern of concordance in weight status, we created a nominal dependent variable: (1) reference group: both parent and child were normal weight; (2) only parent was ov/ob; (3) only child was ov/ob and (4) both parent and child were ov/ob. For example, a socio-demographic factor was associated with an increased risk of only the parent being overweight/obese, compared with both parent and child having normal weight. This may mean that the socio-demographic factor might have broken the transmission of obesity across generations and such factor should be promoted. We analysed father–child and mother–child dyads separately. Supplemental analysis was conducted to analyse the socio-demographic and childcare factors associated with parent–child concordance in weight status, ignoring the gender difference.
In addition, we conducted logistic regression analysis with the child’s ov/ob status as the outcome variable (binary: non-overweight, overweight/obesity) and parental ov/ob as the independent variable (categorical: both parents are normal weight, one parent is overweight/obese and both parents are overweight/obese). We stratified the analyses across socio-demographic and childcare characteristics and compared the OR to examine whether the risk of the children being overweight/obese among overweight/obese parents differs across these factors.
Results
Socio-demographic and childcare characteristics of father–son, father–daughter, mother–son and mother–daughter dyads
The BMI and prevalence of overweight and obesity of children in father–son and mother–son dyads were higher than that of children in father–daughter and mother–daughter dyads. No significant differences were found in the distribution of other socio-demographic and family characteristics across the four dyads (Table 1).
Table 1 Distributions of sociodemographic and family characteristics (mean/sd, %) of Chinese children and their parents across the four dyads in 2017 from the Childhood Obesity Study in China Mega-cities

* P-value was based on the χ 2 test for categorical variables and ANOVA for continuous variables across the four dyads.
† Child weight status (Underweight/normal weight, overweight and obesity) was defined based on the age- and gender-specific BMI cut-off points issued by the National Health Commission of the People’s Republic of China.
‡ Paternal and maternal weight status were defined based on the Chinese standard proposed by the Working Group on Obesity in China(Reference Knowlden and Sharma19): normal-weight or underweight BMI ≤ 23·9 kg/m2; overweight ≤24·0 kg/m2 BMI ≤27·9 kg/m2; obese BMI ≥ 28·0 kg/m2.
Pearson partial correlations between parental and child BMI
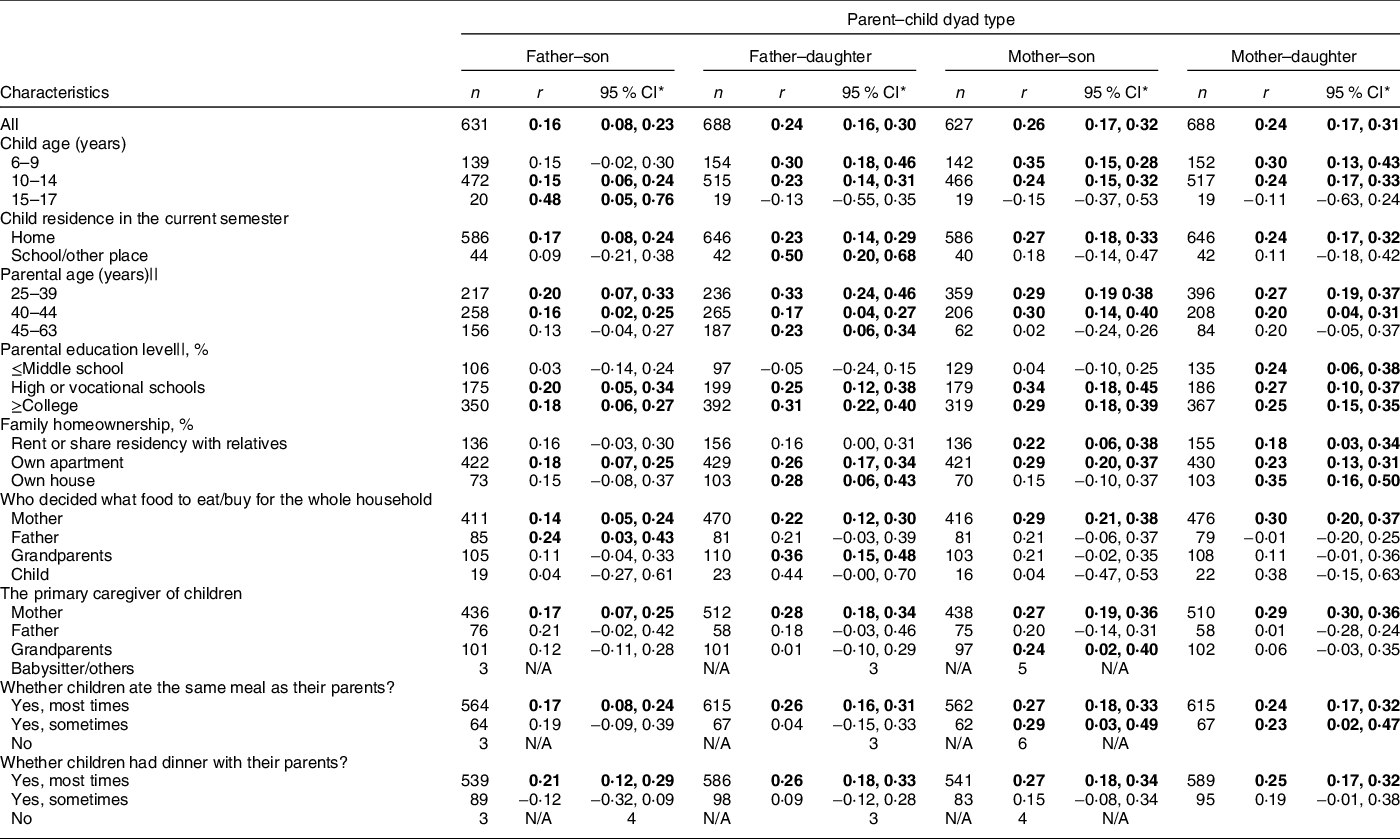
Pearson correlation coefficients (r) for BMI of father–son, father–daughter, mother–son and mother–daughter dyads were 0·16 (95 % CI 0·08, 0·23), 0·24 (95 % CI 0·16, 0·30), 0·26 (95 % CI 0·17, 0·32) and 0·24 (95 % CI 0·17, 0·31), respectively (Table 2).
Table 2 Partial Pearson correlation coefficients (r, based on Bonferroni test)* between parental and child BMI measures† by dyad type, socio-demographic and childcare characteristics in the Childhood Obesity Study in china Mega-cities‡,§
N/A, Non-applicable.
* The r was calculated controlling for child age, child residence in the current semester, parental age and education, family homeownership, who decided what food to eat/buy for the whole household, the primary caregiver of children, whether children ate the same meal as their parents and whether children had dinner with their parents, except for the characteristic that is used to stratify the sample. For example, for the father–son correlation of BMI in different family homeownership groups, we controlled for child age and paternal characteristics with the exception of family homeownership.
† The standard score of child BMI-for-age Z-score and a standard score of parental BMI was used to calculate r.
‡ The five mega-cities across China are Beijing, Shanghai, Xi’an, Nanjing and Chengdu.
§ Numbers in bold indicate statistical significance. We used the Bonferroni test to adjust for the multiple comparison testing effect, P < 0·05/n indicates statistical significance for each pair (data set) (father–son: P = 0·05/26 = 0·0019; father–daughter: P = 0·05/26 = 0·0019; mother–son: P = 0·05/26 = 0·0019 and mother–daughter: P = 0·05/26 = 0·0019).
|| For the stratification of parental age and education level, paternal age and education were used as stratified variables to calculate of BMI in father–son and father–daughter pairs; maternal age and education were used as stratified variables for the calculation of correlations of BMI in mother-son and mother-daughter pairs.
In general, children aged 6–9 years (r ranged from 0·30 to 0·35) had larger BMI correlations with their parents than their counterparts aged 10–14 years or 15–17 years (r ranged from 0·15 to 0·24). Likewise, children residing at home (r ranged from 0·17 to 0·27) had greater BMI correlations with their parents than children residing in school/other places (all r’s were non-significant). Parents aged 25–39 years (r ranged from 0·27 to 0·33) had larger BMI correlations with their children than parents aged 40–44 years or parents aged 45–63 years. Additionally, parents with ≥ high school education (r ranged from 0·18 to 0·34) had larger BMI correlations with their children than those with ≤ middle school (r = 0·24) (Table 2).
BMI correlation coefficients between children and their parents were significant if mothers decided what food to eat/buy for the whole household (r ranged from 0·22 to 0·30). BMI correlation coefficients were significant if children were mainly cared for by their mothers (r ranged from 0·17 to 0·29), but non-significant if they were mainly cared for by others. Only children who ate the same meal as their parents ‘most times’ (r ranged from 0·17 to 0·27) or had dinner with their parents ‘most times’ (r ranged from 0·21 to 0·27) had significant BMI correlation with their parents. Similarly, children who had dinner with their parents ‘most times’ but not ‘sometimes’ had significant BMI correlation coefficients (Table 2). Father–daughter BMI correlation coefficients decreased with the daughter’s age (P = 0·016); no significant trends were seen in the other dyad types (Fig. 3).

Fig. 3 Age trend in the Pearson partial correlation coefficients between parental BMI and child BMI by dyads in 5 mega-cities across China (Beijing, Shanghai, Xi’an, Nanjing and Chengdu). X-axis: child age, Y-axis: correlation coefficient r. P values for dyads: P = 0·591 for mother–girl dyad, P = 0·166 for mother–boy dyad, P = 0·016 for father–girl dyad and P = 0·117 for father–boy dyad. The r was adjusted for maternal and paternal age and education, family homeownership, child residence in the current semester, who decided what food to eat/buy for the whole household, the primary caregiver of children, whether children ate the same meal as their parents and whether children had dinner together with their parents. For father–child dyads correlation coefficients, we controlled for child age and paternal characteristics as described above; for mother–child dyads correlation coefficients, we controlled for child age and maternal characteristics as described above. Because the sample sizes for 15–17 years old for mother–son, mother–daughter, father–son and father–daughter were 20, 19, 19 and 19, respectively, so partial correlation coefficients were not estimated for this age group
Agreement between parental and child weight status (underweight/normal weight, overweight and obesity)
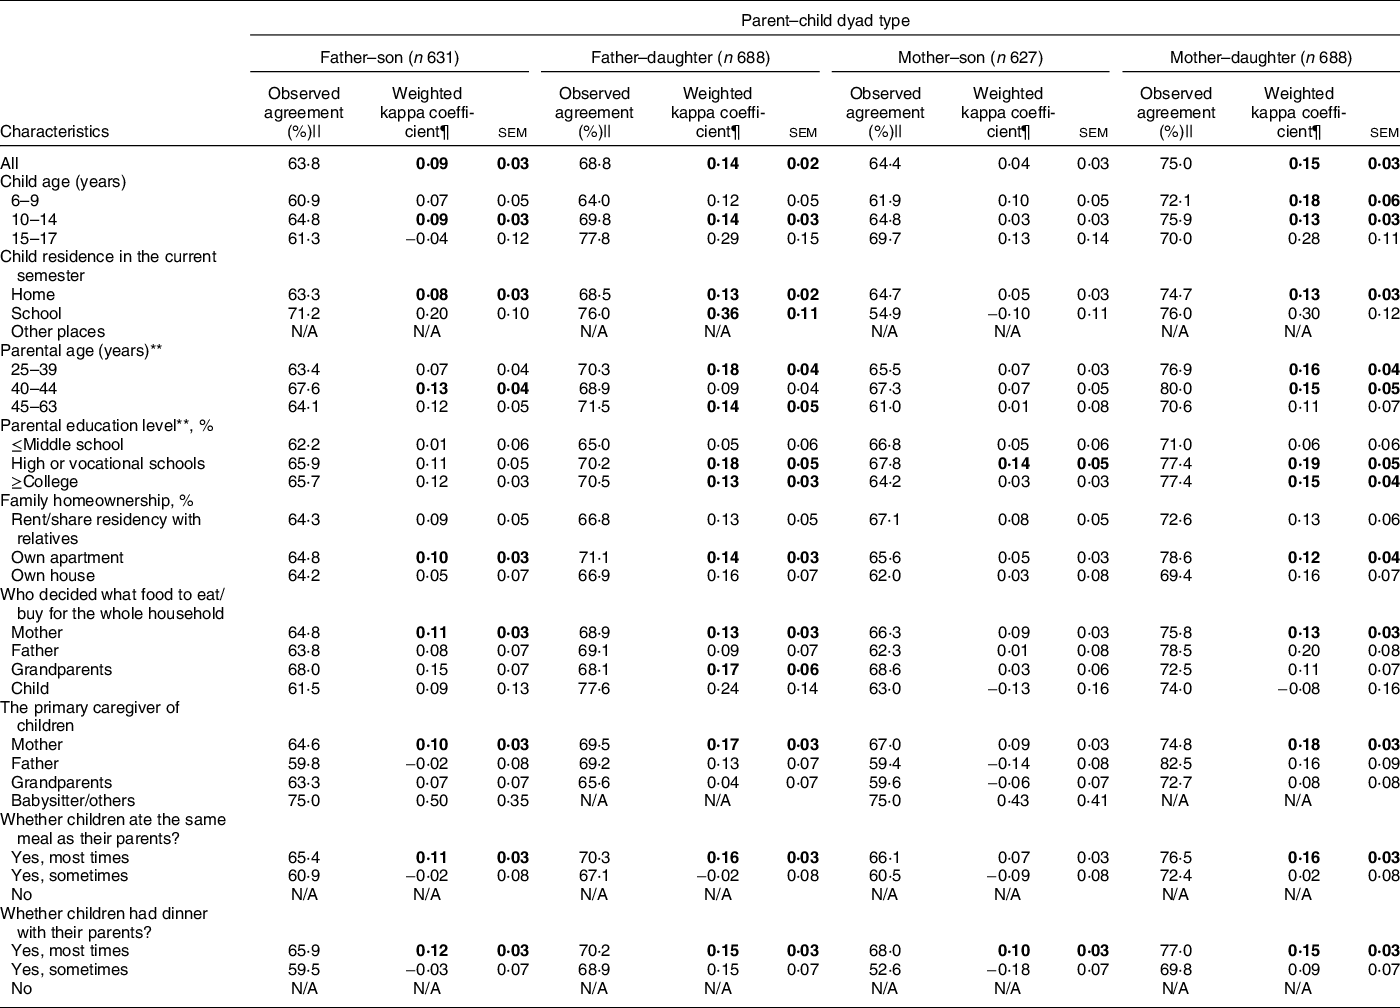
Weighted kappa coefficients (k) of father–son, father–daughter, mother–son and mother–daughter dyads were 0·09, 0·14, 0·04 and 0·15, respectively. Fair levels of agreement (k = 0·20–0·40) were observed in father–daughter dyads, in which the child resided at the school in the current semester (k = 0·36, P < 0·001). The k’s for P–C resemblance in weight status in other groups were poor (Table 3), and fair level of agreement was only observed for parent–child dyads (considering father, mother and child weight status together) in which the child resided at the school in the current semester (k = 0·20, P = 0·07) (see online supplementary material, Supplemental Table 1).
Table 3 Percentage agreement (%) and weighted kappa coefficients (based on Bonferroni test) of parent–child weight status (underweight/normal weight, overweight and obesity) by dyad type and characteristics in the Childhood Obesity Study in China Mega-cities*,†,‡,§
N/A, Non-applicable.
* For children and parents, weight status (underweight/normal weight, overweight and obesity) was used. Weighted kappa values can be interpreted as follows: k < 0·20 = poor agreement, k between 0·20 and 0·40 = fair agreement, k between 0·40 and 0·60 = moderate agreement, k between 0·60 and 0·80 = good agreement and k ≥ 0·80 = very good agreement. We used the Bonferroni test to adjust for the multiple comparison testing effect, p < 0·05/n indicates statistical significance for each pair (father–son: P = 0·05/27 = 0·0019; father–daughter: P = 0·05/26 = 0·0019; mother–son: P = 0·05/27 = 0·0019 and mother–daughter: P = 0·05/26 = 0·0019).
† The five mega-cities across China are Beijing, Shanghai, Xi’an, Nanjing and Chengdu.
‡ Child overweight and obesity were defined according to the ‘WS/T 586–2018 Screening for overweight and obesity among school-aged children and adolescents’. Parental overweight and obesity were defined as normal-weight and underweight BMI ≤ 23·9 kg/m2; overweight ≤24·0 kg/m2 BMI ≤27·9 kg/m2 obese BMI ≥ 28·0 kg/m2.
§ Numbers in bold indicate statistical significance.
|| The expected percentage of the agreement is 33·3 %.
¶ Weighted kappa coefficients were calculated using the Cicchetti–Allison weight matrix (see Methods); sem was reported in parentheses and were obtained through Fay’s balanced repeated replication (BRR) method of estimation.
** Regarding the stratification of parental age and education level, for father–son and father–daughter pairs, paternal age and education were used as stratified variables; for mother–son and mother–daughter pairs, maternal age and education were used as stratified variables·
Socio-demographic and childcare characteristics associated with the mother–child and father–child concordances in weight status
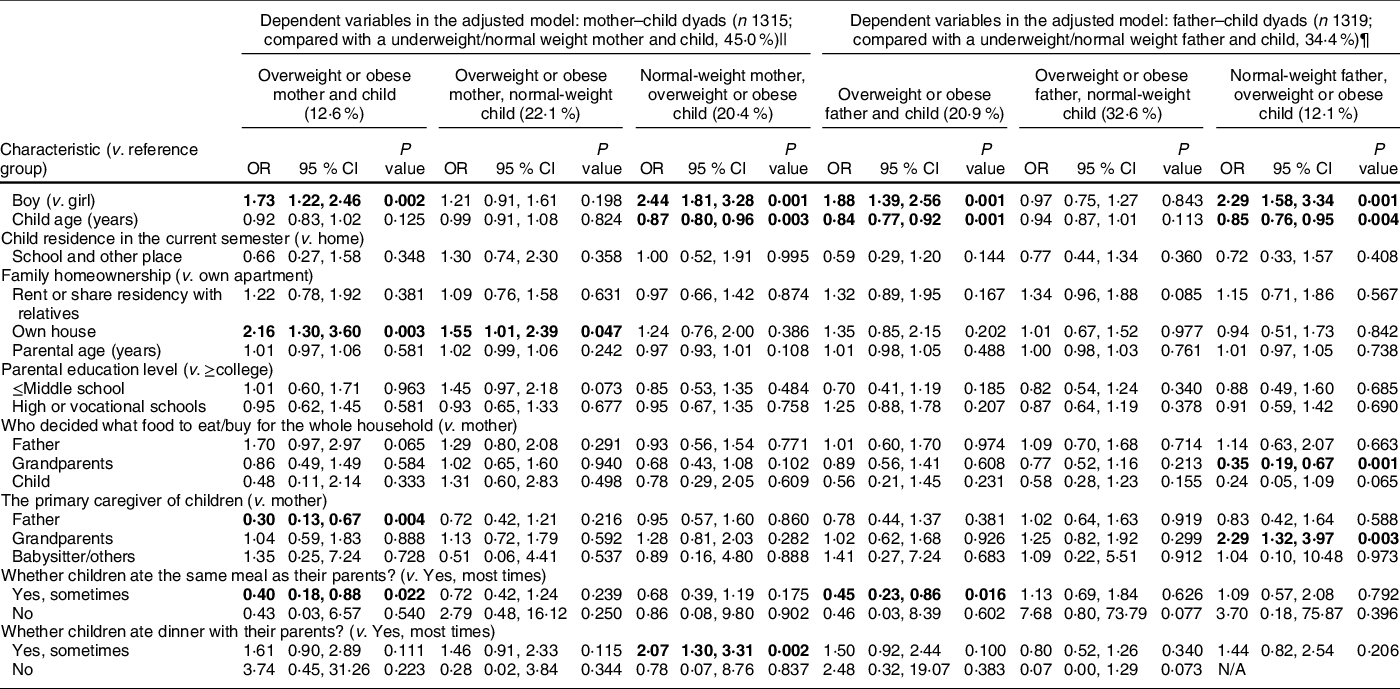
As shown in Table 4, multinomial logistic regression revealed that boys had higher risks of being in ov/ob parents and child dyads, and being in normal-weight parents and ov/ob child dyads (v. normal-weight parents and child dyads; the same reference outcome group for results below), compared with girls. Older children had reduced risks of being in normal-weight parents and ov/ob child dyads, compared with younger children (adjusted OR (AOR) = 0·87 (0·80, 0·96)), adjusting for child’s gender and other confounders in Table 4. Children mainly cared for by their fathers (v. by mothers) had reduced risks of being in ov/ob mother and child dyads (AOR = 0·30 (0·13, 0·67)). However, children mainly cared for by grandparents (v. by mothers) had increased risks of being in normal-weight fathers and ov/ob child dyads (AOR = 2·29 (1·32, 3·97)). Children who ate the same meal as their parents ‘sometimes’ (v. ‘most times’) had reduced risks of being in ov/ob mother–child (AOR = 0·40 (0·18, 0·88)) and father–child (AOR = 0·45 (0·23, 0·86)) dyads. Children who ate dinner with their parents ‘sometimes’ (v. ‘most times’) had increased risks of being in normal-weight mother and ov/ob child dyad (AOR = 2·07 (1·30, 3·31)). When we combined fathers and mothers as parents and re-ran multinomial logistic regression models, the results on significant effect modifiers for the parent–child concordance in weight status were similar to the aforementioned results stratified into father–child and mother–child dyads (see online supplementary material, Supplemental Table 2).
Table 4 Associations (OR, 95 %CI) of socio-demographic and childcare characteristics with patterns of parent-child body weight status (underweight/normal weight, overweight, obesity) concordance in the Childhood Obesity Study in China Mega-cities: multinomial logistic regression models*,†,‡,§
* The OR for specific patterns of concordance in mother–child dyad weight status was observed across sociodemographic and childcare characteristics.
† The five mega-cities across China are Beijing, Shanghai, Xi’an, Nanjing and Chengdu.
‡ Numbers in bold indicate statistical significance.
§ Overweight: ≤24·0 kg/m2 BMI ≤ 27·9 kg/m2, Obese: BMI ≥ 28·0 kg/m2 for adults, for children overweight and obesity status, was defined according to the ‘WS/T 586–2018 Screening for overweight and obesity among school-aged children and adolescents’.
|| For the adjusted model for mother–child dyads, the reference group for the dependent variable was normal-weight mother and normal-weight child dyads and independent variables were all sociodemographic and childcare characteristics, including child age, gender, child residence in the current semester, family homeownership, maternal age and education, who decides what food to eat/buy for the whole household, the primary caregiver of children, whether children ate the same meal as their parents and whether children had dinner with their parents.
¶ For the adjusted model for father–child dyads, the reference group for the dependent variable was normal-weight mother and normal-weight child dyads, and the independent variables were all the socio-demographic and childcare characteristics, including child age, gender, child residence in the current semester, family homeownership, paternal age, and education, who decides what food to eat/buy for the whole household, the primary caregiver of children, whether children ate the same meal as their parents and whether children had dinner with their parents.
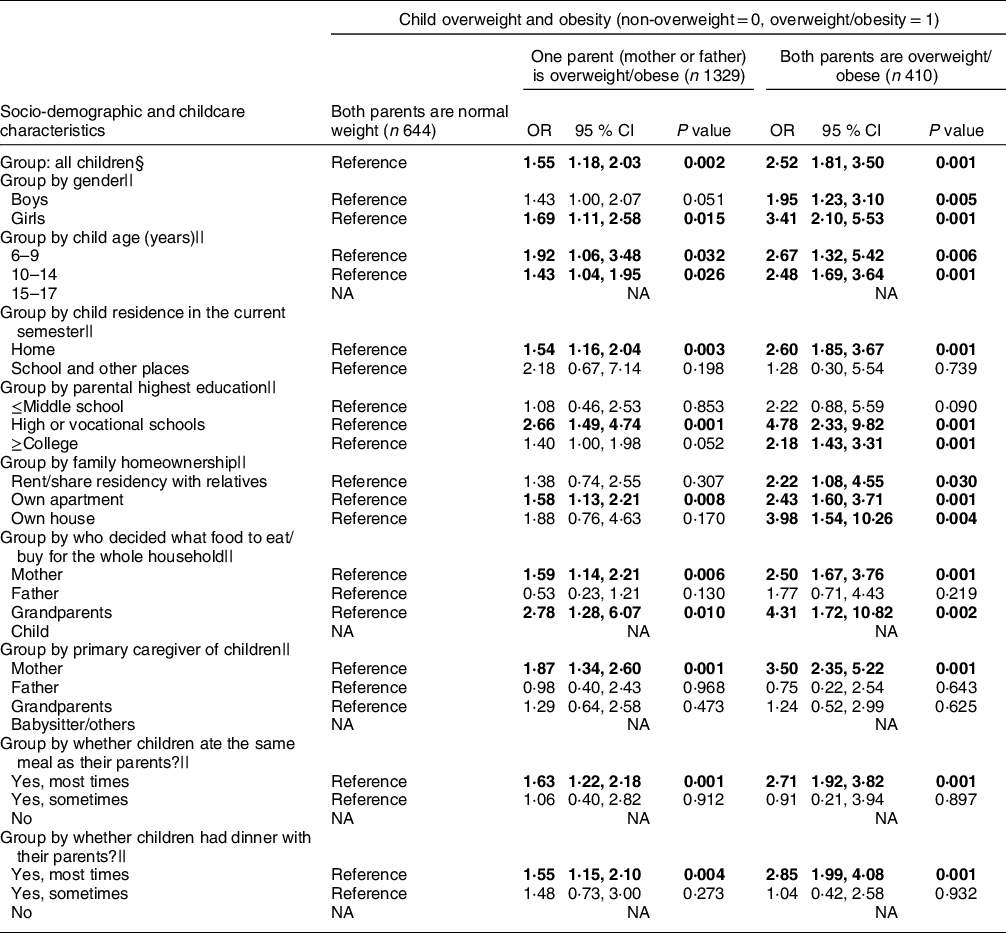
Risk of child having overweight/obesity among overweight/obese parents across socio-demographic and childcare characteristics
The different AOR in Table 5 indicate the varying risks across socio-demographic and childcare characteristics groups of overweight/obese children with overweight/obese parents. In all children and almost all subgroups, having one overweight/obese parent and having both overweight/obese parents were significant risk factors for overweight/obesity in a child. Moreover, the AOR for childhood overweight/obesity (v. normal weight) were larger among children with both overweight/obese parents than among those with only one overweight/obese parent. Larger AOR for childhood overweight/obesity were found in girls (v. boys), children aged 6–9 years (v. 10–14 years old), children residing at home in the current semester (v. at school and other places), children with high or vocational school-educated parents (v. those with ≤middle school or ≥college school educated parents), children from family owning houses (v. those from families renting/sharing residency with relatives or owning apartments), adjusting for other confounders in Table 5. The AOR for childhood overweight/obesity among overweight/obese parents also varied across childcare characteristics. Greater AOR were found for children whose grandparents (v. mother or father) decided what food to eat/buy for the whole household, children who were mainly taken care of by their mother (v. father or grandparents or babysitter/others), children who ate the same meal as their parents ‘most times’ (v. sometimes) and children who had dinner with their parents ‘most times’ (v.·sometimes).
Table 5 The OR (95 % CI) of child having overweight/obesity among overweight/obese parent from the Childhood Obesity Study in China Mega-cities*,†,‡
NA, non-applicable.
* Child overweight and obesity were defined according to the ‘WS/T 586–2018 Screening for overweight and obesity among school-aged children and adolescents’· Parental overweight and obesity were defined according to: normal-weight and underweight: BMI ≤ 23·9 kg/m2; overweight: ≤24·0 kg/m2 BMI ≤27·9 kg/m2; obesity: BMI ≥ 28·0 kg/m2.
† In the logistic regression model, child overweight and obesity (non-overweight =0, overweight/obesity = 1) was the dependent variable (binary) and parental weight status was the independent variable (categorical variable: both parents were normal weight, one parent (mother or father) was overweight/obese, and both parents were overweight/obese).
‡ Numbers in bold indicate statistical significance.
§ Among all the children, logistic regression model adjusted for child age, gender, child residence in the current semester, family homeownership, parental highest education, who decided what food to eat/buy for the whole household, the primary caregiver of children, whether children ate the same meal as their parents and whether they had dinner with their parents.
|| For logistic regression analyses for different groups, all covariates were adjusted except for the stratifying variable.
Discussion
This is the first study to investigate the resemblance in BMI and weight status of father–son, father–daughter, mother–son and mother–daughter pairs and the modifying effects of socio-demographic and childcare characteristics on resemblance in China. Overall, modest P–C resemblances in BMI and weight status were observed across the four pairs. A stronger resemblance of both BMI and weight status was observed for younger children, children residing at home, children with younger and higher-educated parents, those from a family with mother deciding what food to eat/buy for the whole household, those mainly cared for by their mothers and children having the same meal or dinner with their parents most times. Child and parental gender, parental age and some childcare characteristics were associated with the patterns of weight status concordance of the pairs. Particularly, children mainly cared for by grandparents had increased risks of being in normal-weight father and ov/ob child dyad. Our novel findings suggest that family-based childhood obesity interventions should consider the age, parental education and parenting role of both parents and grandparents.
We found modest Pearson correlation coefficients for the P–C BMI ranging from 0·16 to 0·26. This is similar to findings from studies conducted in other countries(Reference Zhang, Lamichhane and Chen12,Reference Jia, Li and Xue13) . For example, one of our studies in the USA, which included 4846 boys and 4725 girls and their parents, found that P–C resemblance in BMI appeared weak (r ranged from 0·15 to 0·23)(Reference Zhang, Lamichhane and Chen12), and weak P–C associations in diet and physical activity patterns in China(15,Reference Wang, Beydoun and Li20) may contribute to this finding. Our previous systematic review and meta-analysis of twenty-four studies found that P–C resemblance in dietary intake was weak, with a correlation coefficient of 0·17 for energy, 0·20 for total fat and 0·19 for % of energy from fat; the correlation for the % of energy from fat decreased over time (β = –0·03 per decade, P < 0·001)(Reference Wang, Beydoun and Li20).
In general, the correlation coefficients of BMI for mother–son dyad seemed to be slightly stronger than that for other pairs (mother–daughter, father–son and father–daughter). Similar findings were observed across the socio-demographic and childcare groups, and this may be because 67·6 % of the children’s primary caregivers were their mothers. Comparisons between our findings with those of other studies among children in China were impossible because no such studies were available. Mixed findings on the gender differences in BMI correlation coefficients for P–C were reported in studies in Western countries. For example, our previous study among 4846 boys and 4725 girls in the USA showed little difference in BMI correlation coefficients across the four pairs(Reference Zhang, Lamichhane and Chen12). To help children develop lifelong healthy eating habits, both mothers and fathers should be involved in parenting their children.
Our finding that P–C resemblance in BMI and weight status was weaker in older than in younger children in China was consistent with our previous study of children in the USA, which found that P–C resemblance in BMI correlation coefficients and agreement in weight status was negatively associated with child’s age(Reference Jia, Li and Xue13). Similarly, we found that the P–C resemblance for correlation coefficients in BMI and weighted kappa in weight status was stronger for younger parents, who were more likely to have younger children, and children might be less susceptible to biological heritage from their parents(Reference Backett-Milburn, Wills and Gregory21) as they grow older. Non-familial influences such as body image and peers’ lifestyle behaviours may outweigh parental influence and work together to reduce P–C resemblance in BMI and weight status(Reference Worthington-Roberts and Williams22). In addition, stronger P–C resemblance in BMI and weight status was observed in parents with higher education and they were found to be more involved in the parenting of their children(Reference Monteiro, Fernandes and Torres23,Reference Muthuri, Onywera and Tremblay24) , which may contribute to P–C resemblance in lifestyle behaviours, with a net effect of increased P–C resemblance in BMI and weight status.
Patterns of P–C concordance in ov/ob status varied by child gender and age. Boys were more likely to be in mother–child and father–child dyads, including an ov/ob child, than girls were. This may be because of weight-related parenting and feeding practices based on the view of some Chinese parents that a big body size for young boys is a symbol of good physical health(Reference Min, Yan and Wang25). Older children were less likely to be in mother–child and father–child dyads, including an ov/ob child, which may be explained by the overall decreasing prevalence of overweight and obesity in the 6–9 years (40·2 %), 10–14 years (31·5 %) and 15–17 years (22·9 %) age groups.
One of our most important contributions to this field is the novel finding that some childcare characteristics were significantly associated with mother–child and father–child concordance in weight status. Mother–child dyads were more likely to include an ov/ob mother and child if they had their own houses than if they had their apartments. We observed that 65 % of mothers who own houses had < high or vocational school education. Families with a large household income and lower-educated mothers might provide their children with excessive food and more motorised transportation(Reference Muthuri, Onywera and Tremblay24). This, coupled with poor education and understanding about healthy lifestyle behaviours and the health risks of being ov/ob, may explain such findings. Children who were mainly cared for by fathers were less likely to be in dyads with an ov/ob mother and child than children mainly cared for by their mothers. An ov/ob mother was more likely to have an unhealthy lifestyle, but if the child was cared for by the father, this maternal negative influence through unhealthy behavioural modelling might be reduced, thus breaking the transmission of obesity across generations. Similarly, compared with children who ate the same meals as their parents ‘most times,’ those who only did ‘sometimes’ were less likely to be in dyads with an ov/ob mother or father and child. We also found that the OR of childhood obesity among children with overweight/obese parents were larger for children who ate the same meal as their parents ‘most times’ than for those who only did ‘sometimes’. Among ov/ob mothers and fathers who were more likely to have unhealthy lifestyles, if their children only had the same meal ‘sometimes’ with them, the children may be less affected by their parents’ unhealthy eating habits. Interestingly, compared with children who had dinner with their parents ‘most times,’ those children who only did so ‘sometimes’ were more likely to be in dyads with a normal-weight mother and an ov/ob child· A possible reason might be that children not having dinner with their parents may have more takeaway food and could not benefit from the healthy lifestyle behaviours of their normal-weight mothers(Reference Hammons and Fiese26). These findings indicate that parental weight status has a strong influence on a child’s weight status; ov/ob parents should pay more attention to their potential negative impacts on child obesity, while normal-weight parents can improve their children’s eating behaviours through behavioural modelling.
The parenting role of grandparents also influenced P–C concordance in ov/ob status. We found if grandparents decided what food to eat/buy for the whole household, children were less likely to be in dyads with normal-weight father and ov/ob child. However, if children were mainly cared for by grandparents, they were more likely to be in dyads with a normal-weight father and an ov/ob child. These seemingly contradictory findings suggest that grandparents’ healthy eating habits are beneficial for reducing the risk of childhood obesity, but children mainly cared for by grandparents may have other specific risk factors that contribute to the increased risk of obesity. Another study also found that the involvement of grandparents in childcare was an important factor that contributed to childhood obesity in China (OR = 2·03, 95 % CI 1·19, 3·47)(Reference Li, Adab and Cheng27). Grandparents’ inappropriate perceptions (e.g. fat children are healthy and well cared for), poor knowledge (e.g. obesity-related diseases only happen in adults) and unhealthy behaviour (e.g. overfeeding) were commonly perceived contributing to grandchildren’s obesity. These findings may apply to some families in other countries who live in multi-generation households(Reference Pallan, Parry and Adab28). Future interventions targeting grandparents to reduce grandchildren’s obesity should focus on their knowledge and perceptions about childhood obesity and grandchildren’s feeding behaviour. In addition, we should take advantage of grandparents’ own healthy eating behaviour, which can be a protective factor against childhood obesity through healthy role modelling for grandchildren.
This study has some limitations. First, the use of self-reported weight and height of parents may result in weak P–C resemblance, although previous studies have reported that self-reported and measured weight and height were highly correlated in adults, even in China(Reference Xie, Ho and Liu29). Second, some childcare characteristics (e.g. whether children ate the same meal as their parents) were reported by the primary caregiver instead of children. Although studies have shown that regarding eating behaviours, such as sharing dinners, agreements between the child and parent reports were fair (Cohen’s kappa coefficients = 0·33)(Reference Poulain, Vogel and Meigen30), this measurement method may reduce the accuracy. Third, other factors associated with P–C resemblance in weight status cannot be investigated due to the lack of data. For example, it was reported that compared with children with siblings, P–C resemblance was stronger for children without siblings(15). Fourth, stratified cluster sampling was used in the survey. However, the clustering effects were not accounted for in the statistical method due to a lack of standard Pearson and weighted kappa calculation methods considering the clustering effect. Fifth, the data are from mega-cities; thus, the findings may not be generalisable to other less-developed regions in China.
In conclusion, modest resemblance in BMI and weight status for father–son, father–daughter, mother–son and mother–daughter pairs was observed in the children of China, but the strength of the resemblance varied by child age, residence, parental age and education, primary caregiver, who decides what food to eat/buy for the whole household and frequencies of having the same meal or having dinner with their parents. Future family-based childhood obesity interventions need to consider age, parental education and parenting role of both parents and grandparents.
Acknowledgements
Acknowledgements: We warmly thank all the dedicated and conscientious volunteers (primary and secondary school students) in the Childhood Obesity Study in China Mega-cities (COCM). We also thank the COCM research team for data collection and management of the COCM database. Financial support: This study was funded in part by China Medical Board (grant number: 16-262), National Institutes of Health [grant number: U54 HD070725], United Nations Children’s Fund [grant number: Unicef 2018-Nutrition-2.1.2.3] and the Chinese National Key Research and Development Program (grant number: 2017YFC0907200 & 2017YFC0907201). X.Z.W.’s time effort was supported by the Health Resources and Services Administration (HRSA) of the US Department of Health and Human Services (HHS) under R40MC31880 entitled ‘Socioeconomic disparities in early origins of childhood obesity and body mass index trajectories (PI, X.Z.W.)’. The information, content and/or conclusions are those of the author and should not be construed as the official position or policy of, nor should any endorsements be inferred by HRSA, HHS or the US Government. The funding sources had no role in the design of this study, its execution, analyses, interpretation of the data or decision to submit results. Conflict of interest: None. Authorship: The authors’ responsibilities were as follows: Y.F.W. designed the research; Y.F.W. provided essential materials; Y.X.D. performed statistical analyses; L.M. drafted the manuscript; X.Z.W. and Y.W. revised the manuscript; Y.F.W. and L.M. had primary responsibility for the final content and are the guarantors; L.W.G. and B.X. helped the data collection; all authors critically helped in the interpretation of results, revised the manuscript and provided relevant intellectual input and all authors read and approved the final manuscript. Ethics of human subject participation: This study was conducted according to the guidelines laid down in the Declaration of Helsinki, and all procedures involving study participants were approved by the Ethical Committee of the State University of New York at Buffalo and related collaborative institutes in China. Written informed consent was obtained from all subjects.
Supplementary material
For supplementary material accompanying this paper visit https://doi.org/10.1017/S1368980020005108


