


Introduction
Mendelian randomization (MR) has become an increasingly popular tool for inferring causal relationships in the health sciences, to enable the formulation of effective health-promotion and disease-prevention strategies. MR leverages genetic data to overcome the critical issue of unmeasured confounding in using observational data for causal inference (see Box 1). The proliferation of genome-wide association studies (GWAS) on a wide range of traits and health outcomes has fuelled a boom in MR studies. However, the validity of MR depends on critical assumptions which are difficult to ensure. Thus, while the testing of a wide array of exposure-outcome pairs offers an exciting opportunity for etiological discoveries, there is also a serious risk that uncritical application will generate numerous invalid causal inferences and lead to confusion rather than clarity.
Box 1. Classic MR in a nutshell

Note. MR, Mendelian randomization; RCT, randomized controlled trial; IV, instrumental variable; SNP, single nucleotide polymorphism.
In this review, we first provide a brief history of MR, followed by an overview of its principles, key assumptions, and statistical methodology, as well as its major limitations and recent methodological developments aimed at addressing these limitations. We give three examples to illustrate how MR has been used in psychiatric research, and conclude with a discussion of future research directions, including the integration of MR with multi-omics data and the use of MR in deciphering the complex causal networks of risk factors and disorders.
Causal inference and instrumental variable analysis
The randomized controlled trial (RCT) is widely regarded as the gold standard for establishing causality (Fisher, Reference Fisher1925, Reference Fisher1926) but is often expensive, impractical, or unethical in humans. Thus, in mental health and across other fields, researchers have relied heavily on observational studies for testing causal relationships. However, causal inference from observational data is subject to multiple sources of bias, including unmeasured confounders, colliders, and non-random sampling. While there were early attempts at causal inference from observational data, such as the work by John Snow and others on the link between cholera outbreaks and the water supply in mid-19th century London (Davey Smith, Reference Davey Smith2002), formal statistical methodologies were not developed until the 1920s, when Sewall Wright developed path analysis in population genetics to test alternative causal models with correlations derived from observational data (Wright, Reference Wright1921; see also Pearl, Reference Pearl2022; Stock & Trebbi, Reference Stock and Trebbi2003). Later, Bradford Hill proposed empirical criteria to evaluate putative causal relationships from observational studies (Doll & Hill, Reference Doll and Hill1950; Hill, Reference Hill1965). Over time, multiple causal inference frameworks have been developed, including the Potential Outcome (aka. Counterfactual) framework (Rubin, Reference Rubin1974; Splawa-Neyman, Dabrowska, & Speed, Reference Splawa-Neyman, Dabrowska and Speed1990), the Campbell Causal Model (Campbell, Reference Campbell1957), the Sufficient-Component Cause model (Rothman, Reference Rothman1976), and the Causal Graph (aka. Bayesian Network) framework (Pearl, Reference Pearl1995).
Derived from path analysis, instrumental variable (IV) analysis is an important tool for causal inference. Wright (Reference Wright1928, p. 312) conceived of IV when he suggested introducing additional variables ‘which (A) affect demand conditions without affecting cost conditions or which (B) affect cost conditions without affecting demand conditions’ to overcome the difficulties in estimating supply and demand elasticities. By its nature, an IV is unlikely to affect the outcome other than through its influence on the putative exposure. An example is cigarette sales tax, which is unlikely to affect health outcomes other than through its effect on smoking behavior. Identifying a valid IV is critical, as noted by Wright (Reference Wright1928, p.314): ‘Success with this method depends on success in discovering factors of type A and B’.
In IV analysis, the causal effect of an exposure on an outcome is estimated by the ratio of two regression coefficients: the outcome regressed on the IV and the exposure regressed on the IV (Durbin, Reference Durbin1954). IV estimation has evolved to incorporate information from multiple instruments (Basmann, Reference Basmann1957; James & Singh, Reference James and Singh1978; Theil, Reference Theil1953), to use data from different samples (Angrist & Krueger, Reference Angrist and Krueger1992a, Reference Angrist and Krueger1992b; Inoue & Solon, Reference Inoue and Solon2010), and for binary outcomes (Foster, Reference Foster1997; Palmer et al., Reference Palmer, Sterne, Harbord, Lawlor, Sheehan, Meng and Didelez2011). Since the 1990s IV analysis has been applied to economics, clinical trials, and public health (Angrist, Imbens, & Rubin, Reference Angrist, Imbens and Rubin1996; Imbens & Angrist, Reference Imbens and Angrist1994). A landmark study used birthdate as IV to study the impact of schooling on income in countries where students must have reached a certain age at the start of their first academic year; the rationale being that children born soon after the beginning of an academic year would start school at a later age and receive less compulsory education than children born later in the academic year (Angrist & Keueger, Reference Angrist and Keueger1991). Other notable applications used treatment assignment as IV to allow for non-compliance in estimating treatment effect in clinical trials (Greenland, Reference Greenland2000; Robins & Greenland, Reference Robins and Greenland1996), and cigarette tax as an IV for maternal smoking to investigate its effect on fetal health (Ringel & Evans, Reference Ringel and Evans2001).
Beginnings and expansion of MR
Decades before MR was introduced, Fisher (Reference Fisher1952, p.7) recognized the value of genetic information in causal inference, drawing parallels between Mendelian segregation during meiosis and randomization in RCTs:
‘The different genotypes possible from the same mating have been beautifully randomized by the meiotic process. A more perfect control of conditions is scarcely possible, than that of different genotypes appearing in the same litter.’
Katan (Reference Katan1986) was the first to propose using a genetic marker (APOE gene variants), as a proxy for a phenotype (serum cholesterol) to investigate its underlying causal relationship with another, statistically correlated, phenotype (cancer). Gray and Wheatley (Reference Gray and Wheatley1991) coined the term ‘Mendelian Randomization’ when studying sibling bone marrow transplants for the treatment of leukemia. Later, Davey Smith and Ebrahim (Reference Davey Smith and Ebrahim2003, Reference Davey Smith and Ebrahim2004) popularized the concept of MR in a causal inference context, showing how the parent–offspring design is more analog to the RCT than population-based cohort or case–control association studies, while recognizing the generally greater statistical power of the latter. Eventually, MR was recognized as being equivalent to IV analysis using genetic instruments (Didelez & Sheehan, Reference Didelez and Sheehan2007; Lawlor, Harbord, Sterne, Timpson, & Davey Smith, Reference Lawlor, Harbord, Sterne, Timpson and Davey Smith2008; Wehby, Ohsfeldt, & Murray, Reference Wehby, Ohsfeldt and Murray2008).
Early MR analyses used individual-level data on single candidate variants. Today, MR is usually applied to GWAS summary statistics, where the exposure and outcome are typically measured in different samples. The rapid growth of MR applications is spurred by three factors: widespread data sharing from published GWASs, the rise of MR methods requiring only summary statistics, and the availability of convenient software packages. A simple PubMed search using relevant keywords (Fig. 1) shows a surge in psychiatry-related MR publications since 2010. While two-sample MR takes advantage of the growth of GWASs on specific phenotypes, one-sample MR is making a resurgence with the advent of large-scale cohorts with measures on multiple phenotypes (e.g. the UK Biobank), which offer analytic possibilities not available from single-phenotype summary statistics, such as Bayesian causal network analysis (Howey, Shin, Relton, Davey Smith, & Cordell, Reference Howey, Shin, Relton, Davey Smith and Cordell2020).
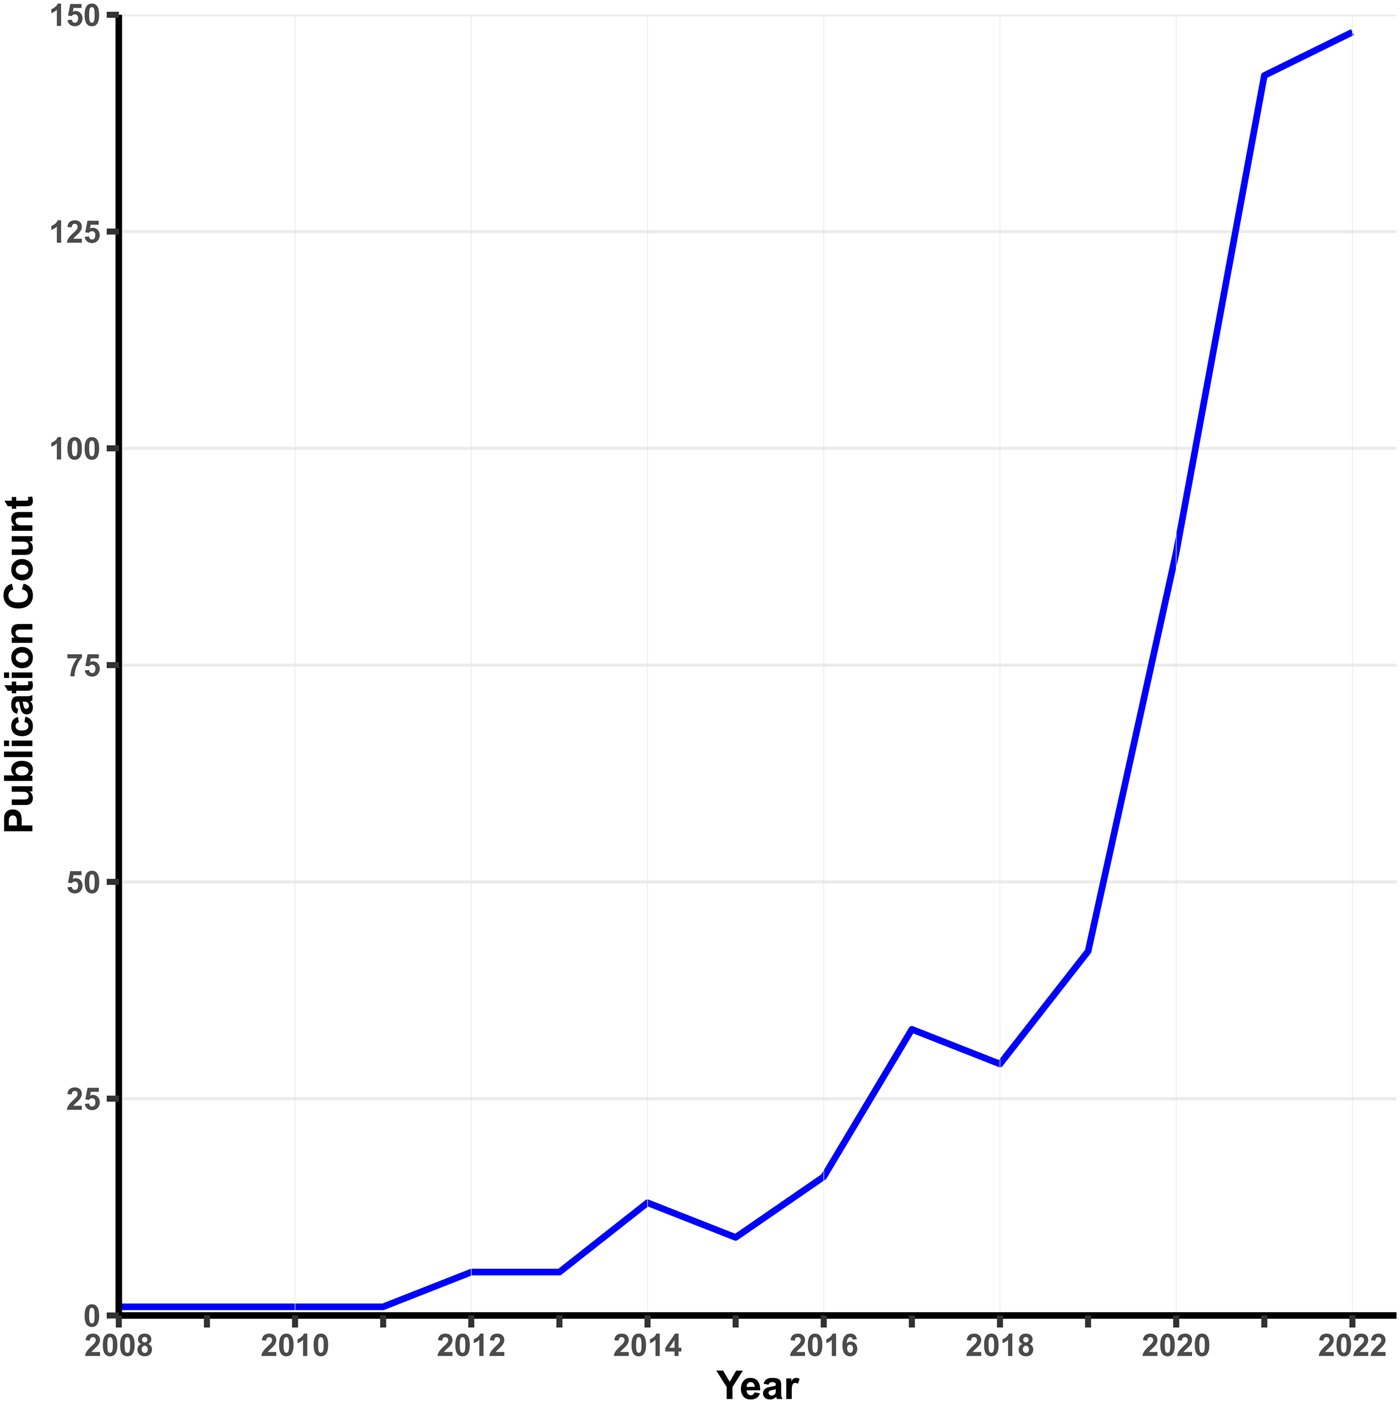
Figure 1. Growth in MR studies related to psychiatry.
Note. This figure shows the number of publications per year indexed by PubMed using the search terms ‘Mendelian randomization’ OR ‘Mendelian randomization’ AND ‘psychiatry’ as of January 2023.
Classic MR methodology
MR is often conceptualized as nature's RCT, where Mendel's laws of segregation and independent assortment provide ‘random assignment’ of alternative exposures to individual subjects. In meiosis, the two haplotypes at a locus are randomly distributed to two daughter gametes. Thus, genotypes formed by the union of parental gametes are unlikely to be associated with confounders in a randomly mating population. Reverse causation from phenotype to genotype is also unlikely since the germline genotype is fixed at conception and most genetic variation is inherited rather than acquired. Genetic variants are thus strong candidates to be used as IV (for a review, see Richmond and Smith, Reference Richmond and Smith2022).
Fundamental assumptions
MR leverages genetic instruments (GIVs) to make causal inferences. As illustrated in Fig. 2, a valid GIV needs to satisfy three assumptions (Didelez & Sheehan, Reference Didelez and Sheehan2007):
-
① Relevance assumption: GIV is associated with the exposure.
-
② Independence assumption: GIV is independent of any confounder.
-
③ Exclusion restriction: GIV is independent of the outcome except through the exposure.
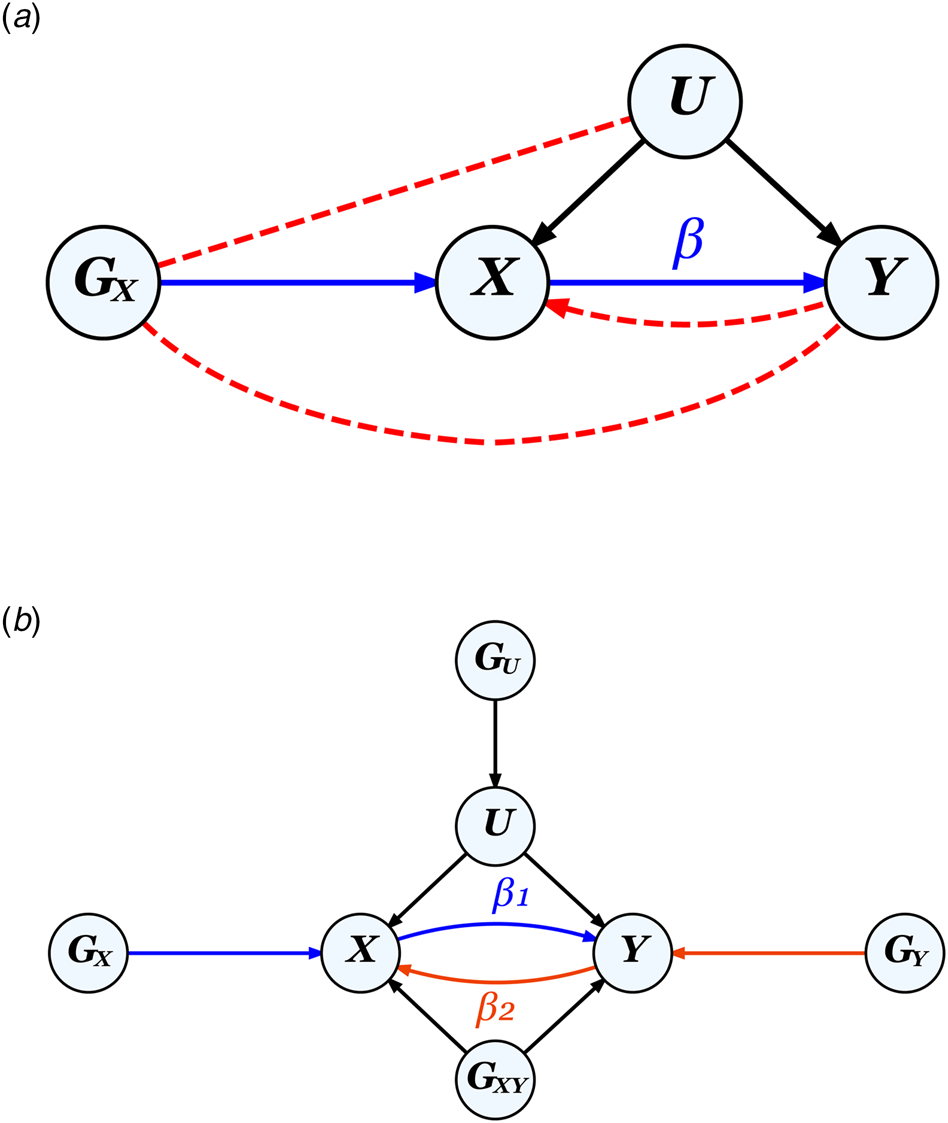
Figure 2. The MR framework and assumptions.
Note.
a. Diagram for classic MR that aims to estimate the causal effect of exposure X on outcome Y using a genetic instrument G X to control for any unmeasured confounders U, illustrating the three MR assumptions: ① relevance: G X is strongly associated with X (the blue path), ② independence: Gx is not correlated with U, and ③ exclusion restriction: G X is not correlated with Y except through X. Assumptions ② and ③ (absence of the red dotted paths) together ensure that the correlation between G X and Y can be entirely attributed to their direct relationships with X. The presence of a feedback loop, indicated by the red dotted arrow from Y to X, can bias causal effect estimates, but only when a causal effect is present.
b. Diagram for bidirectional MR on two phenotypes X and Y, where G U and G XY represent pleiotropic SNPs which would violate assumptions ② and ③ respectively, if used as genetic instruments for either X or Y. G X and G Y, when uncorrelated with both G U and G XY, represent valid instruments for X and Y, respectively.
A valid GIV is usually thought of as being causal for the exposure, but a SNP in very high linkage disequilibrium (LD) with a causal SNP could also constitute a valid instrument.
Causal effect estimation
Conceptually, the diagram in Fig. 2a implies that the effect of GIV on Y (β GY) is equal to the effect of GIV on X (β GX) multiplied by the effect of X on Y (β XY). Rearranging the equation to solve for β XY gives the simple IV ratio estimator (Durbin, Reference Durbin1954): $\hat{\beta }_{XY} = \hat{\beta }_{GY}/\hat{\beta }_{GX}$ , where the denominator and numerator are obtained from two separate regression analyses. An alternative approach is two-stage least squares (2SLS), which first regresses X on GIV, followed by a second regression of Y on the predicted X based on the first regression (Basmann, Reference Basmann1957; Theil, Reference Theil1953). In a single-GIV one-sample scenario, these two approaches are equivalent (Inoue & Solon, Reference Inoue and Solon2010).
When there are multiple independent GIVs, the ratio estimator can be applied to each GIV; the resulting multiple estimates can then be combined in various ways analogous to meta-analysis. Estimates can be combined most simply by inverse variance weighting (IVW), where each estimate is weighted by the inverse of its sampling variance divided by the sum of these inverses across GIVs (Burgess, Butterworth, & Thompson, Reference Burgess, Butterworth and Thompson2013). Instead of taking a weighted mean, some have proposed taking a weighted median (Bowden, Davey Smith, Haycock, & Burgess, Reference Bowden, Davey Smith, Haycock and Burgess2016) or weighted mode (Hartwig, Davey Smith, & Bowden, Reference Hartwig, Davey Smith and Bowden2017) of the ratio estimates to reduce the influence of outliers arising from invalid GIVs or genotyping errors. The IVW method is equivalent to a weighted meta-regression of the GIV-outcome associations on GIV-exposure associations through the origin. While these approaches only require GWAS summary statistics, 2SLS requires individual-level data but can include GIVs that are in LD (Angrist & Krueger, Reference Angrist and Krueger1992b). When applied directly to a multi-GIV two-sample setting, 2SLS tends to produce more precise estimates than the generalized ratio estimator (TSIV) (Inoue & Solon, Reference Inoue and Solon2010). An extended IVW method accounts for LD by leveraging external reference panel information, providing a summary data counterpart to 2SLS (Burgess, Davies, & Thompson, Reference Burgess, Davies and Thompson2016a). Bowden et al. (Reference Bowden, Del Greco, Minelli, Davey Smith, Sheehan and Thompson2017) have discussed the subtle differences between various approaches. Other statistical approaches have been proposed for IV and MR analyses, including limited information maximum likelihood (LIML; Anderson & Rubin, Reference Anderson and Rubin1949; Fuller, Reference Fuller1977), Bayesian models, and semi-parametric methods (see Boehm & Zhou, Reference Boehm and Zhou2022; Burgess, Small, & Thompson, Reference Burgess, Small and Thompson2017 for statistical reviews).
Limitations of MR
Invalid instruments
The inclusion of invalid GIVs violating one or more of the three assumptions illustrated in Fig. 2 can lead to biased causal estimates. The relevance assumption requires that the GIV-exposure association is genuine rather than a chance finding or spurious association. The exclusion restriction is violated when the GIV has a direct pleiotropic effect on the outcome, or when a SNP in LD with the GIV directly affects the outcome (Davey Smith & Ebrahim, Reference Davey Smith and Ebrahim2003). Finally, the independence assumption is violated when the GIV is associated with both exposure and outcome through a confounder.
In general, MR is invalidated by biased associations from either the exposure or the outcome GWAS. Despite extensive quality control and stringent statistical corrections, residual artifacts in GWAS are still present. Population stratification is a common violator of the relevance assumption by producing non-random placement of the GIVs and the outcome in the environment. Other factors, such as cryptic relatedness, familial effects, assortative mating, and subtle batch differences in genotyping calls, can also cause biased association estimates. For instance, multi-center GWAS samples might be subject to granular population differences in the distributions of exposure, outcome, and SNP allele frequency (Brumpton et al., Reference Brumpton, Sanderson, Heilbron, Hartwig, Harrison and Vie2020). Familial effects such as genetic nurture, where parents exert an effect on offspring's phenotype through the shared environment (Bates et al., Reference Bates, Maher, Medland, McAloney, Wright, Hansell and Gillespie2018; Kong et al., Reference Kong, Thorleifsson, Frigge, Vilhjalmsson, Young, Thorgeirsson and Stefansson2018; Tubbs, Porsch, Cherny, & Sham, Reference Tubbs, Porsch, Cherny and Sham2020), and assortative mating, which introduces a genetic correlation between parents (Robinson et al., Reference Robinson, Kleinman, Graff, Vinkhuyzen, Couper, Miller and Visscher2017; Young, Benonisdottir, Przeworski, & Kong, Reference Young, Benonisdottir, Przeworski and Kong2019), can also cause biased association estimates. Other potential sources of bias include genotyping errors, phenotype classification or measurement errors, gene–environment interaction (VanderWeele, Tchetgen Tchetgen, Cornelis, & Kraft, Reference VanderWeele, Tchetgen Tchetgen, Cornelis and Kraft2014), participant overlap across GWAS studies (Burgess et al., Reference Burgess, Davies and Thompson2016a), selection bias arising from unrepresentative sampling or differential participation (Gkatzionis & Burgess, Reference Gkatzionis and Burgess2019; Munafò & Smith, Reference Munafò and Smith2018; Munafò, Tilling, Taylor, Evans, & Smith, Reference Munafò, Tilling, Taylor, Evans and Smith2018; Pirastu et al., Reference Pirastu, Cordioli, Nandakumar, Mignogna, Abdellaoui, Hollis and Ganna2021), and survival bias due to competing risk before recruitment (Schooling et al., Reference Schooling, Lopez, Yang, Zhao, Au Yeung and Huang2021).
Although MR is often assumed to be immune to bias due to reverse causation, since it utilizes genetic instruments fixed at conception, several situations may still introduce bias due to reverse causation. Burgess, Swanson, & Labrecque (Reference Burgess, Swanson and Labrecque2021) discuss three such situations: when the true causal exposure is upstream to the putative exposure, the presence of feedback loops, and cross-generational effects. The biasing effect of feedback loops is not often considered when conducting MR, even though many bi-directional MR studies have identified significant effects in both directions. One proposed solution to allow for feedback loops in MR estimation procedures is to utilize structural equation modeling (Zheng et al., Reference Zheng, Baird, Borges, Bowden, Hemani, Haycock and Smith2017).
Pleiotropy
Pleiotropy refers to the situation where one SNP affects multiple traits. It is ubiquitous in human complex traits (see Solovieff, Cotsapas, Lee, Purcell, and Smoller, Reference Solovieff, Cotsapas, Lee, Purcell and Smoller2013 for a review), with over 90% of trait-associated loci, 80% of associated genes, and 60% of associated SNPs discovered by GWAS being pleiotropic across multiple traits (Watanabe et al., Reference Watanabe, Stringer, Frei, Umićević Mirkov, de Leeuw, Polderman and Posthuma2019). For psychiatric disorders, pleiotropy is pervasive, with few risk alleles that are specific to a single diagnostic category (O'Donovan & Owen, Reference O'Donovan and Owen2016), resulting in widespread genetic correlations across disorders (Cross-Disorder Group of the Psychiatric Genomics, 2019). Horizontal pleiotropy, where a SNP directly influences multiple phenotypes, gives rise to invalid GIVs (Davey Smith & Hemani, Reference Davey Smith and Hemani2014; Verbanck, Chen, Neale, & Do, Reference Verbanck, Chen, Neale and Do2018). MR Egger was introduced to allow for horizontal pleiotropy but is not valid when the pleiotropic effects on exposure and outcome are correlated due to common biological mechanisms linking the GIVs to the exposure and outcome (Morrison, Knoblauch, Marcus, Stephens, & He, Reference Morrison, Knoblauch, Marcus, Stephens and He2020). Thus, even if MR researchers have access to well-executed and adequately powered GWAS, pleiotropy remains a challenging issue.
Weak instruments
The estimation accuracy and statistical power of MR depend on the strength of the GIV-exposure association (Brion, Shakhbazov, & Visscher, Reference Brion, Shakhbazov and Visscher2013; Burgess, Reference Burgess2014; Freeman, Cowling, & Schooling, Reference Freeman, Cowling and Schooling2013). Weak GIVs can lead to significant small-sample bias and unstable estimates in MR (from having a close-to-zero denominator in the ratio), known as ‘weak instrument bias’ (Bound, Jaeger, & Baker, Reference Bound, Jaeger and Baker1995; Hahn & Hausman, Reference Hahn and Hausman2003; Staiger & Stock, Reference Staiger and Stock1997). In general, one-sample MR causal estimates are biased toward residual exposure-outcome association from unmeasured confounders (Burgess & Thompson, Reference Burgess and Thompson2011b), whereas two-sample estimates are biased toward the null (Angrist & Krueger, Reference Angrist and Krueger1995; Lawlor, Reference Lawlor2016). Having many weak GIVs increases the variation in causal effect estimates across GIVs; such heterogeneity can be tested by an adapted Cochran's Q statistic and allowed for by modifying the weights in IVW estimation (Bowden et al., Reference Bowden, Del Greco, Minelli, Zhao, Lawlor, Sheehan and Davey Smith2019).
Winner's curse
Selecting significant SNPs from an exposure GWAS as GIVs and using the same GWAS to obtain GIV-exposure association estimates can lead to an upward bias of these estimates, known as the ‘winner's curse’ (Kraft, Reference Kraft2008; Xiao & Boehnke, Reference Xiao and Boehnke2009), and result in biased MR estimates (Davey Smith & Hemani, Reference Davey Smith and Hemani2014; Lawlor, Reference Lawlor2016). Winner's curse bias is most severe in underpowered GWAS of highly polygenic phenotypes and remains non-negligible at the typical sample sizes of current GWAS. In two-sample MR without sample overlap, the GIV-outcome association estimates are not subject to the winner's curse, causing the ratio estimates to be biased toward the null (Deng, Zhang, Song, & Yu, Reference Deng, Zhang, Song and Yu2020). However, when there is sample overlap between exposure and outcome GWAS, phenotypic correlation between exposure and outcome may introduce winner's curse bias to SNP-outcome associations, possibly resulting in false-positive causal inferences (Minelli et al., Reference Minelli, Del Greco, van der Plaat, Bowden, Sheehan and Thompson2021). To avoid winner's curse, GIVs should ideally be selected a priori based on existing knowledge or a preliminary independent GWAS on the exposure (Burgess et al., Reference Burgess, Davey Smith, Davies, Dudbridge, Gill, Glymour and Theodoratou2019).
Recent methodological developments in MR
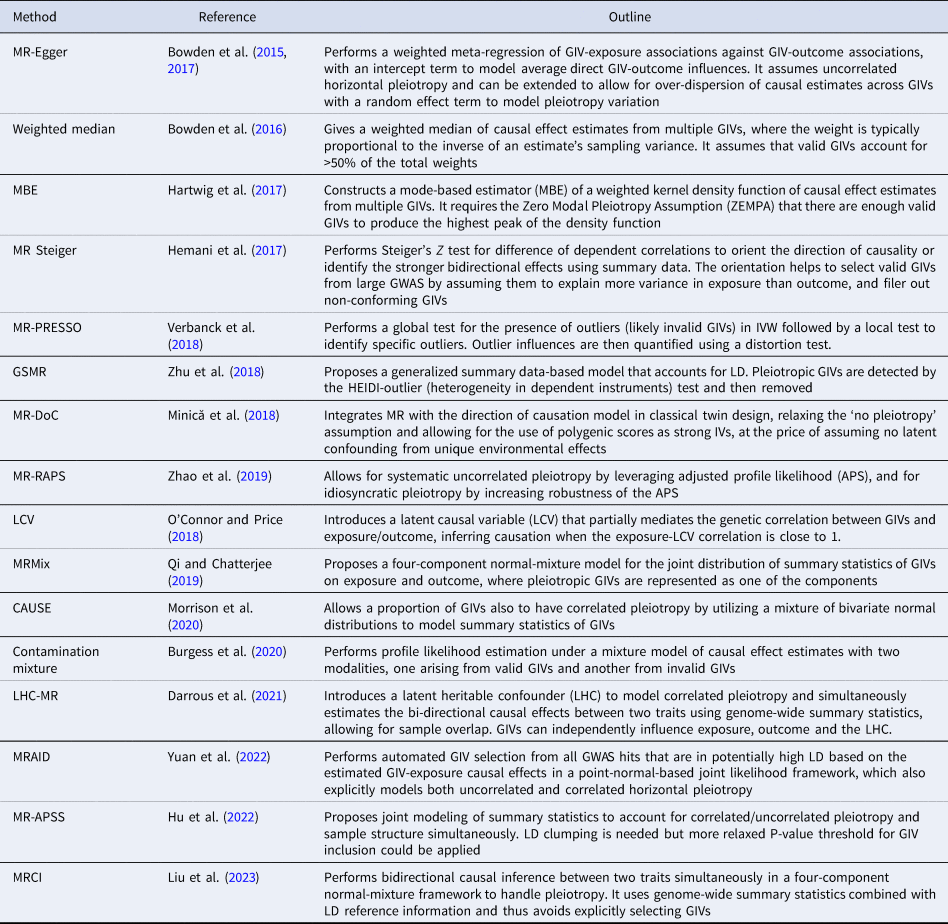
MR has traditionally been used to evaluate the causality of candidate risk factors for specific health outcomes, such as HDL for heart disease and vitamin D for type-2 diabetes. However, the recent trend of using MR more exploratively on GWAS summary statistics has increased the risk of false causal inferences due to multiple testing and the limitations mentioned above. This has motivated methodological developments which aim to improve the robustness and statistical power of MR. These methods address issues such as identifying invalid GIVs due to pleiotropy, adjusting for weak GIVs, accounting for measurement errors, and correcting for sample overlap, ‘winner's curse’, and selection bias. A selection of these methods is summarized in Table 1 (see Sanderson et al., Reference Sanderson, Glymour, Holmes, Kang, Morrison, Munafò and Davey Smith2022 for a review).
Table 1. Recent methodological developments that address the limitations of classic MR
Addressing widespread pleiotropy
Recent methodological advancements have focused on reducing biases caused by widespread pleiotropy in complex phenotypes. Common approaches include weighting schemes, identifying and then removing pleiotropic GIVs, leveraging gene-by-environment (G × E) interactions, or explicitly modeling GIV-outcome pleiotropic effects.
IVW produces consistent MR estimates only when the pleiotropic effects of invalid GIVs on the outcome are uncorrelated with their effects on exposure (the InSIDE assumption) and have an average of zero. MR-Egger adds an intercept term to the weighted meta-regression to capture non-zero average pleiotropic effects (Bowden, Davey Smith, & Burgess, Reference Bowden, Davey Smith and Burgess2015; Burgess & Thompson, Reference Burgess and Thompson2017) and can model the heterogeneity of pleiotropic effects by introducing a random effect, but still depends on the InSIDE assumption for valid causal inference (Bowden et al., Reference Bowden, Del Greco, Minelli, Davey Smith, Sheehan and Thompson2017). Methods based on the identification and exclusion of GIVs with outlying causal effect estimates include Cochran's Q statistics (Bowden et al., Reference Bowden, Del Greco, Minelli, Zhao, Lawlor, Sheehan and Davey Smith2019), MR-PRESSO (Verbanck et al., Reference Verbanck, Chen, Neale and Do2018), and GSMR (Zhu et al., Reference Zhu, Zheng, Zhang, Wu, Trzaskowski, Maier and Yang2018).
The presence of an interacting covariate that modifies the effect of GIV on exposure offers an opportunity for detecting and adjusting for pleiotropy, since there is a covariate value at which the GIV has no effect on exposure, so that the GIV-outcome association at this covariate value would estimate pleiotropy. When the interacting covariate is measured, MR-GxE estimates the causal effect by the regression coefficient of GIV-outcome associations on GIV-exposure associations, across different observed values of the covariate (Spiller, Slichter, Bowden, & Davey Smith, Reference Spiller, Slichter, Bowden and Davey Smith2019). When it is not measured, MR-GENIUS leverages the heteroscedasticity induced by the G × E to estimate the causal effect on exposure on outcome (Tchetgen, Sun, & Walter, Reference Tchetgen, Sun and Walter2021). However, MR-G × E assumes that all pleiotropic effects of GIVs on outcome are independent of the covariate, while MR-GENIUS involves even stronger assumptions (Spiller, Hartwig, Sanderson, Davey Smith, & Bowden, Reference Spiller, Hartwig, Sanderson, Davey Smith and Bowden2022).
Some recent MR methods explicitly model and control for correlated horizontal pleiotropy. LCV (O'Connor & Price, Reference O'Connor and Price2018) introduces a latent causal mediator that links GIVs to both exposure and outcome, and infers an exposure-outcome causation when the latent causal mediator is almost perfectly correlated with the exposure. MRMix (Qi & Chatterjee, Reference Qi and Chatterjee2019) and contamination mixture (Burgess, Foley, Allara, Staley, & Howson, Reference Burgess, Foley, Allara, Staley and Howson2020) assume a normal mixture model to allow for pleiotropic SNPs among selected GIVs; the latter was found to outperform other existing methods in simulations (Slob & Burgess, Reference Slob and Burgess2020). In contrast, CAUSE (Morrison et al., Reference Morrison, Knoblauch, Marcus, Stephens and He2020) models correlated pleiotropy across all SNPs after LD pruning, whilst MRAID (Yuan et al., Reference Yuan, Liu, Guo, Yan, Xue and Zhou2022) includes all GWAS hits that are in LD and enables automatic GIV selection. Three recent methods, LHC-MR (Darrous, Mounier, & Kutalik, Reference Darrous, Mounier and Kutalik2021), MR-APSS (Hu et al., Reference Hu, Zhao, Lin, Wang, Peng, Zhao and Yang2022), and MRCI (Liu et al., Reference Liu, Qin, Wu, Tubbs, Baum, Mak and Sham2023), account for sample overlap (between exposure and outcome GWAS) as well as correlated pleiotropy, by adopting an structural equation model (SEM) with a latent heritable confounder, a mixture foreground-background model, and a mixture bi-directional causation model, respectively. MR-APSS requires the selection of nearly independent GIVs, whereas LHC-MR and MRCI use all available SNPs. Since different methods have their own strengths and weaknesses, researchers often apply multiple analytic approaches to the same dataset to assess the strength of evidence for causality based on the consistency of results.
Addressing other limitations
Progress has also been made in addressing other limitations beyond horizontal pleiotropy. To reduce weak instrument bias, early approaches include selecting variants with F statistic > 10, controlling for covariates, and combining data from multiple studies (Burgess et al., Reference Burgess, Butterworth and Thompson2013; Burgess & Thompson, Reference Burgess and Thompson2011a). Another approach involves combining multiple weak GIVs into a single, stronger GIV by polygenic scoring (Burgess, Dudbridge, & Thompson, Reference Burgess, Dudbridge and Thompson2016b). However, polygenic scores are prone to include pleiotropic GIVs and violate MR assumptions. Modified weights in an IVW framework (Bowden et al., Reference Bowden, Del Greco, Minelli, Zhao, Lawlor, Sheehan and Davey Smith2019) and weighted meta-regression (Cai, Hartley, Mahmoud, Tilling, & Dudbridge, Reference Cai, Hartley, Mahmoud, Tilling and Dudbridge2022) are alternative ways for ameliorating the bias introduced by multiple weak GIVs. MR-RAPS (Zhao, Wang, Hemani, Bowden, & Small, Reference Zhao, Wang, Hemani, Bowden and Small2019) is another method for robust inference that first screens out extremely weak GIVs, and then down-weights the contributions of the remaining weak GIVs.
As GWAS sample size increases, and with some phenotypes having large measurement errors, there is increasing risk of selecting instruments that are primarily associated with outcome rather than exposure. Since a valid GIV should correlate more strongly with exposure than outcome, the Steiger Z test has been proposed to orientate causation direction between phenotypes and filter out invalid GIVs (Hemani, Tilling, & Smith, Reference Hemani, Tilling and Smith2017).
To address the winner's curse bias, prior statistical adjustment of GIV-exposure association statistics (e.g. MRlap by Mounier & Kutalik, Reference Mounier and Kutalik2023) or explicit modeling by their joint distribution with GIV-outcome association statistics (e.g. MRCI; Liu et al., Reference Liu, Qin, Wu, Tubbs, Baum, Mak and Sham2023) have been suggested.
Genetic nurture stemming from correlated offspring genotypes and family environment can be addressed by directly estimating causal maternal effects on offspring phenotypes (Evans, Moen, Hwang, Lawlor, & Warrington, Reference Evans, Moen, Hwang, Lawlor and Warrington2019). Family-based genetic association data (e.g. from parent–offspring trio or sibship designs) can be leveraged to account for assortative mating, population stratification, familial effects, and horizontal pleiotropy in MR studies (Brumpton et al., Reference Brumpton, Sanderson, Heilbron, Hartwig, Harrison and Vie2020; Davies et al., Reference Davies, Howe, Brumpton, Havdahl, Evans and Davey Smith2019). Typically, within-family association is free from many of the potential biases of association studies on unrelated individuals (Hwang, Davies, Warrington, & Evans, Reference Hwang, Davies, Warrington and Evans2021), which may explain the often reported smaller effect size estimates from family-based association studies (Howe et al., Reference Howe, Nivard, Morris, Hansen, Rasheed, Cho and Davies2022). Recent advances in integrating MR with the direction of causation modeling in the classical twin design have enabled the use of polygenic scores as strong IVs to improve causal effect estimation in a unidirectional (MR-DoC; Minică, Dolan, Boomsma, de Geus, & Neale, Reference Minică, Dolan, Boomsma, de Geus and Neale2018) and bidirectional setting (MR-DoC2; Castro-de-Araujo et al., Reference Castro-de-Araujo, Singh, Zhou, Vinh, Verhulst, Dolan and Neale2023).
Standard MR uses average causal effect estimates across population strata or interacting risk factors. Recent methods such as the residual collider-stratified approach Coscia et al. (Reference Coscia, Gill, Benítez, Pérez, Malats and Burgess2022) take account of such cross-group heterogeneity when predicting the effect of altering an exposure in an individual.
MR best practices
Clinicians and applied researchers should be aware of the benefits and limitations of MR, which deserve scrutiny given the importance of causal inference for mechanistic understanding, clinical practice, and wider policy recommendations. Davies, Holmes, and Smith (Reference Davies, Holmes and Smith2018) and Burgess et al. (Reference Burgess, Davey Smith, Davies, Dudbridge, Gill, Glymour and Theodoratou2019) provide excellent guidelines geared toward clinicians, with checklists for assessing MR studies. Researchers should follow established quality control pipelines to address metadata errors or analytical issues (Haycock et al., Reference Haycock, Borges, Burrows, Lemaitre, Harrison and Burgess2023). Agreement between multiple MR analyses using various methodologies, combined with triangulation of other relevant experimental (e.g. RCT), epidemiological, or genetic evidence (e.g. colocalization), is needed strengthen the confidence in a causal finding and avoid false discoveries (see Lawlor, Reference Lawlor2016; Sobczyk, Zheng, Smith, & Gaunt, Reference Sobczyk, Zheng, Smith and Gaunt2022; Zuber et al. Reference Zuber, Grinberg, Gill, Manipur, Slob, Patel and Burgess2022).
Recent advances have encouraged the widespread application of MR. Many classical MR methods and recent developments have been integrated into convenient packages, such as the ‘MendelianRandomization’ R package (Broadbent et al., Reference Broadbent, Foley, Grant, Mason, Staley and Burgess2020; Yavorska & Burgess, Reference Yavorska and Burgess2017). The proliferation of large biobanks and GWAS consortia has provided the genetic data needed for using MR to examine the causal relations between numerous exposure-outcome pairs. For example, MRbase (Hemani et al., Reference Hemani, Zheng, Elsworth, Wade, Haberland, Baird and Haycock2018) allows performing MR in a web browser by combining results across around 40 000 sets of summary statistics ranging from proteomics to brain region volumes, enabling ‘high-throughput’ research such as an MR screen for putative causes of Parkinson's disease using over 5000 GWAS datasets and compiling the results in an online repository (Noyce et al., Reference Noyce, Bandres-Ciga, Kim, Heilbron, Kia, Hemani and Singleton2019). Some have even adopted a hypothesis-free phenome-wide MR approach (Evans et al., Reference Evans, Brion, Paternoster, Kemp, McMahon, Munafò and Smith2013; Evans & Davey Smith, Reference Evans and Davey Smith2015), searching for causal effects of BMI on a wide range of phenotypes (Millard et al., Reference Millard, Davies, Timpson, Tilling, Flach and Smith2015; Millard, Davies, Gaunt, Smith, & Tilling, Reference Millard, Davies, Gaunt, Smith and Tilling2018). However, studies examining many exposure-outcome pairs are susceptible to p-hacking and publication bias. Therefore, researchers need to employ rigorous control for multiple testing (e.g. by Bonferroni or false discovery rate adjustment) and report all results of MR tests performed regardless of significance, while journals should consider publishing null findings from rigorous studies.
The concept of gene–environment (G–E) equivalence adds complexity to interpreting positive MR results, which states that ‘changes in an exposure by either a hypothetical change in genotype or by a change in the environment should produce the same downstream effect on an outcome’ (Sanderson et al., Reference Sanderson, Glymour, Holmes, Kang, Morrison, Munafò and Davey Smith2022, p. 26). It is suggested that this criterion needs to be fulfilled to assert causality, in addition to the three MR assumptions. Indeed, violation of G–E equivalence suggests that the exposure is not truly causal despite significant MR evidence, but represents a closely correlated proxy of a true cause. However, under this scenario, the GIVs are correlated with the true cause, which acts as a confounder for exposure-outcome association, violating the second MR assumption. Thus, the caveat of G–E equivalence reflects the inherent difficulties in ensuring that a significant MR result is not due to the violation of MR assumptions by a confounder that has a strong genetic correlation with the exposure. For example, while MR may support a causal effect of BMI on diabetes risk (Corbin et al., Reference Corbin, Richmond, Wade, Burgess, Bowden, Davey Smith and Timpson2016), the true cause could be some trait with a strong genetic correlation with BMI, such as body fat (Jo & Mainous, Reference Jo and Mainous2018).
A closely related issue arises when the exposure is categorical or binary; the question being whether we should infer the exposure itself, or the genetic liability to the exposure, to be causal. Considering the genetic liability to be causal allows for the possibility that the true cause may be some unmeasured variable that has a strong genetic correlation with the exposure, rather than the exposure itself. For instance, a recent study found evidence for causal links between educational attainment (EA) and health outcomes using a within-sibship MR design, but interpreted these results with caution, citing the possible involvement of EA-correlated cognitive and non-cognitive pathways (Howe et al., Reference Howe, Rasheed, Jones, Boomsma, Evans, Giannelis and Davies2023).
MR applications in psychiatry
The application of MR in psychiatry has become increasingly common (Pingault, Cecil, Murray, Munafò, & Viding, Reference Pingault, Cecil, Murray, Munafò and Viding2017). Saccaro, Gasparini, and Rutigliano (Reference Saccaro, Gasparini and Rutigliano2022) systematically reviewed published MR studies on schizophrenia, major depression, bipolar disorder, autism spectrum disorders, and ADHD, demonstrating the methodology, findings, and flaws in existing literature of over 50 articles. Here, we will highlight three examples: (1) using MR to examine the contentious causal relationship between cannabis use and psychosis, (2) using MR to clarify the potentially bi-directional relationship between intelligence and schizophrenia, (3) using MR to screen candidate modifiable risk factors for a causal effect on depression. These examples demonstrate the usefulness of MR in following up on myriad association findings and providing initial evidence for plausible causal risk factors that are often not conducive to a RCT.
Cannabis use and psychosis
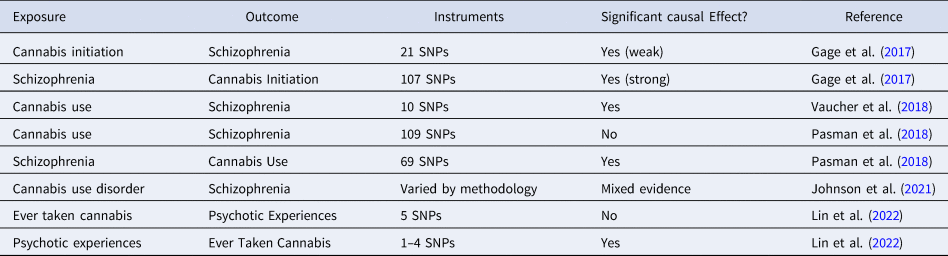
Several MR studies have been conducted to examine the controversial association between cannabis use and psychosis. Using two-sample IVW MR, Gage et al. (Reference Gage, Jones, Burgess, Bowden, Davey Smith, Zammit and Munafò2017) found evidence of a weak but significant causal effect of cannabis initiation on schizophrenia risk and a strong effect in the opposite direction. Vaucher et al. (Reference Vaucher, Keating, Lasserre, Gan, Lyall, Ward and Holmes2018) also found significant evidence for a causal effect of ever-use of cannabis on schizophrenia risk. In contrast, Pasman et al. (Reference Pasman, Verweij, Gerring, Stringer, Sanchez-Roige, Treur and Vink2018) found no support for a causal effect of lifetime cannabis use on schizophrenia risk but reported a strong effect in the opposite direction. Johnson et al. (Reference Johnson, Hatoum, Deak, Polimanti, Murray, Edenberg and Agrawal2021) used the LCV method and found no evidence of causal effect of cannabis use disorder on schizophrenia, but reached the opposite conclusion when they used multivariate MR to control for pleiotropic effects through cigarette smoking phenotypes. Using one-sample MR in the UK Biobank, B. D. Lin et al. (Lin et al. Reference Lin, Pries, Sarac, van Os, Rutten, Luykx and Guloksuz2022) found evidence to support a causal effect of risk for psychosis on cannabis use, but no causal effect in the reverse direction. Together, these studies provide strong evidence of a causal link between schizophrenia and cannabis use behaviors, but only mixed evidence for a causal effect in the opposite direction. Gillespie and Kendler (Reference Gillespie and Kendler2021), reviewing the earliest three studies along with evidence from other study designs, concluded that while there is evidence for true causality, non-causal factors such as shared genetic and familial influences and other environmental confounders also contribute to the association between cannabis use and schizophrenia. Such complexities increase the likelihood of pleiotropy and other violations of MR assumptions. In addition, the effect of cannabis use may vary depending on the pattern of use and the potency of the cannabis. Thus, future MR studies should use more nuanced definitions of cannabis use, as well as more robust study designs and analytic strategies (Table 2).
Table 2. MR studies examining the causal effects of cannabis use on psychosis risk
Intelligence and schizophrenia
Cognitive impairment is a core feature of schizophrenia (McCutcheon, Keefe, & McGuire, Reference McCutcheon, Keefe and McGuire2023), with premorbid intelligence consistently shown to be a strong predictor of future risk (Khandaker, Barnett, White, & Jones, Reference Khandaker, Barnett, White and Jones2011). Furthermore, schizophrenia and intelligence show strong evidence for shared genetic effects (Savage et al., Reference Savage, Jansen, Stringer, Watanabe, Bryois, De Leeuw and Posthuma2018; Smeland et al., Reference Smeland, Bahrami, Frei, Shadrin, O'Connell, Savage and Andreassen2019). Three MR studies have been conducted to test for their causal links. The first used GSMR, finding statistically significant bi-directional causal relationships such that higher intelligence was protective against schizophrenia and schizophrenia leads to decreased intelligence (Savage et al., Reference Savage, Jansen, Stringer, Watanabe, Bryois, De Leeuw and Posthuma2018). A subsequent study using different summary statistics for intelligence also found evidence from IVW and MR-Egger for a causal effect of higher intelligence on reduced risk for schizophrenia but did not examine the reverse causal direction (Adams, Reference Adams2020). The most recent MR study (Ohi et al., Reference Ohi, Takai, Kuramitsu, Sugiyama, Soda, Kitaichi and Shioiri2021), which applied GSMR, found evidence that low intelligence was causally associated with schizophrenia-specific risk as well as shared schizophrenia and bipolar risk. Evidence in the reverse direction indicated that only the shared risk component is causally linked to decreasing intelligence. As opposed to the MR-based findings on cannabis use and schizophrenia, the MR evidence for a causal effect of intelligence on schizophrenia is strong and consistent. Indeed, other study designs have also supported a causal link between pre-morbid intelligence and schizophrenia (Kendler, Ohlsson, Sundquist, & Sundquist, Reference Kendler, Ohlsson, Sundquist and Sundquist2015; Toulopoulou et al., Reference Toulopoulou, van Haren, Zhang, Sham, Cherny, Campbell and Kahn2015).
Modifiable causal risk factors for depression
MR was recently used to identify modifiable causal risk factors for depression from UK Biobank data. Out of 26 candidate risk factors, the study reported significant risk-increasing causal effects of TV use and multivitamin use, a bidirectional causal relationship between depression and daytime napping, and a protective effect of confiding in others. However, only a small number of GIVs were used in analyzing the effect of multivitamin use, and it is also unclear whether the effect of TV use is specific or related generally to media consumption/sedentary behavior. The results support the strong existing literature linking sleep dysregulation to depression (Fang, Tu, Sheng, & Shao, Reference Fang, Tu, Sheng and Shao2019; Riemann, Krone, Wulff, & Nissen, Reference Riemann, Krone, Wulff and Nissen2020), as well as the protective effects of social support shown by previous prospective studies (Santini, Koyanagi, Tyrovolas, Mason, & Haro, Reference Santini, Koyanagi, Tyrovolas, Mason and Haro2015). However, these risk factors are themselves determined by a multitude of biopsychosocial influences, and there is likely widespread pleiotropy between them and with depression, undermining the confidence in MR results. Nevertheless, if replicated by further studies employing independent samples and complementary methodologies, these findings would provide valuable insights with potential implications for the prevention and treatment of mood disorders.
Future prospects
MR is now firmly established as a powerful and rapidly advancing tool for etiological research. Two promising directions for its future development are: (1) integrating multi-omics data to elucidate the intricate biological mechanisms driving disease and disorder, and (2) generalizing its use to construct complex causal networks connecting multiple phenotypes. These developments could enable researchers to dissect mechanistic relationships, identify novel etiological pathways, and inform disease prevention and intervention efforts. Yazdani et al. (Reference Yazdani, Yazdani, Mendez-Giraldez, Samiei, Kosorok and Schaid2022) reviewed the extension from classical MR to causal networks capable of integrating large-scale omics data and provided a detailed discussion of the assumptions, identification, evaluation, and utility of causal networks.
MR with multi-omics data
Advances in multi-omic technologies have empowered the utilization of MR in exploring the causal links between molecular pathways and disease development. The possibility of mining the ‘phenome’ for disease associations was suggested by Evans et al. (Reference Evans, Brion, Paternoster, Kemp, McMahon, Munafò and Smith2013), who proposed the use of GWAS to construct genome-wide allelic scores as composite proxies for numerous biological intermediate variables and to screen these scores for association with health outcomes. However, as genome-wide allelic scores are likely to have widespread effects on multiple phenotypes, they may not be ideal GIVs for MR studies (Evans et al., Reference Evans, Brion, Paternoster, Kemp, McMahon, Munafò and Smith2013; Evans & Davey Smith, Reference Evans and Davey Smith2015). Subsequently, transcriptome-wide association studies (TWAS) emerged, which use a regression model developed from expression quantitative trait loci (eQTL) data to impute gene expression levels from multiple SNP genotypes; the imputed expression levels of numerous genes are then analyzed for association with the phenotype (Gamazon et al., Reference Gamazon, Wheeler, Shah, Mozaffari, Aquino-Michaels, Carroll and Im2015). SMR subsequently adapted this approach into a summary statistics-based MR framework (Zhu et al., Reference Zhu, Zhang, Hu, Bakshi, Robinson, Powell and Yang2016), which was used to prioritize 55 genes whose expression levels may be causally linked to schizophrenia risk (Trubetskoy et al., Reference Trubetskoy, Pardiñas, Qi, Panagiotaropoulou, Awasthi, Bigdeli and O'Donovan2022). MR-JTI (Zhou et al., Reference Zhou, Jiang, Zhong, Cox, Liu and Gamazon2020) improved upon this by incorporating multiple-tissue expression data to increase statistical power, while others have leveraged prior fine mapping to enhance MR accuracy (Zhu et al., Reference Zhu, Matoba, Wilson, Tapia, Li, Ibrahim and Love2021). Furthermore, MR is increasingly being applied to a wide range of multi-omics data, including metabolomics (Liu et al., Reference Liu, van Klinken, Semiz, van Dijk, Verhoeven, Hankemeier and Demirkan2017; Richardson et al., Reference Richardson, Leyden, Wang, Bell, Elsworth, Smith and Holmes2022), epigenetic markers (Alameda et al., Reference Alameda, Trotta, Quigley, Rodriguez, Gadelrab, Dwir and Forti2022; Jamieson et al., Reference Jamieson, Korologou-Linden, Wootton, Guyatt, Battram, Burrows and Richmond2020; Richardson et al., Reference Richardson, Richmond, North, Hemani, Davey Smith, Sharp and Relton2019), single-cell transcriptomics (Haglund et al., Reference Haglund, Zuber, Yang, Abouzeid, Feleke, Ko and Johnson2022), and the brain connectome (Shen et al., Reference Shen, Howard, Adams, Hill, Clarke, Adams and McIntosh2020; Song, Qian, Wang, Yu, & Lin, Reference Song, Qian, Wang, Yu and Lin2021), as exposures and/or outcomes. Omics-driven MR has the potential to provide insights into the complex biological mechanisms underlying disease occurrence.
MR and causal networks
Ultimately, MR could be used to construct causal networks of numerous environmental and biological risk factors for complex diseases across multiple inter-related phenotypes. Such a network would be extremely informative for drug repositioning and target screening, the identification of actionable clinical intervention points, and the prediction of the multiple direct and indirect consequences of any intervention.
An important development toward causal network modeling is multivariable MR (MVMR; Burgess & Thompson, Reference Burgess and Thompson2015; Sanderson, Davey Smith, Windmeijer, & Bowden, Reference Sanderson, Davey Smith, Windmeijer and Bowden2019b), which allows the joint estimation of the causal effects of multiple exposures on an outcome, accounting for correlated pleiotropic effects through the included exposures. MVMR was used to test the association between educational attainment and smoking after adjustment for general cognitive ability (Sanderson, Davey Smith, Bowden, & Munafò, Reference Sanderson, Davey Smith, Bowden and Munafò2019a), and its adaptation MVMR-cML was used to assess the causal relationships between eight common cardiometabolic risk factors and coronary artery disease (Lin et al., Reference Lin, Xue and Pan2023). However, correct causal inference in MVMR requires the selected covariates to include confounders of the exposure–outcome relationship but exclude mediators of the relationship and consequences of the outcome.
Another important development was the incorporating MR into mediation analysis (Burgess, Daniel, Butterworth, & Thompson, Reference Burgess, Daniel, Butterworth and Thompson2015; Carter et al., Reference Carter, Sanderson, Hammerton, Richmond, Davey Smith, Heron and Howe2021; Relton & Davey Smith, Reference Relton and Davey Smith2012) to partition the overall causal effect of exposure X on outcome Y into direct and indirect (via measured mediator Z) components, by using GIVs for X and GIVs for Z to estimate the effects of X (on Z and Y) and the effects of Z (on Y), respectively. The data can be fitted to a pre-specified SEM of all the variables, as suggested by Sanderson (Reference Sanderson2021). In principle, MR-based mediation analysis can be extended to a general framework for estimating causal relationships among multiple traits, where a trait can be influenced by some variables and at the time exert influence on other variables, blurring the distinction between exposure and outcome.
An important strength of SEM methodology is its ability to include latent variables to explain phenotypic correlations among measured variables. With the development of methods such as GCTA (Lee, Yang, Goddard, Visscher, & Wray, Reference Lee, Yang, Goddard, Visscher and Wray2012) and LDSC (Bulik-Sullivan et al., Reference Bulik-Sullivan, Loh, Finucane, Ripke, Yang and Neale2015) to estimate the genetic correlations (as against phenotypic correlations) of phenotype pairs using GWAS data, SEM has been extended to include latent genetic factors to explain the pattern of genetic correlations among multiple phenotypes (Genomic SEM: Grotzinger et al., Reference Grotzinger, Rhemtulla, de Vlaming, Ritchie, Mallard, Hill and Tucker-Drob2019). The incorporation of latent variables into MR-based causal inference could eventually lead to a general approach for constructing and testing complex causal networks of multiple latent and measured phenotypes. In such a framework, SNP genotypes represent ‘external’ variables that help to clarify and estimate the causal relationships among the multiple phenotypes.
SEM is powerful and rigorous for comparing alternative causal models but can be unwieldy for constructing data-driven models with many measured variables. Directed acyclic graph (DAG) models, rooted in Bayesian principles, are more scalable. Typical DAG algorithms start by linking variables via their pairwise correlations, followed by eliminating non-causal links through conditional independence, and then orientate causal directions of the remaining edges using the collider and other principles. However, Bayesian causal networks have their own limitations, prompting recent efforts to integrate MR and DAG for more robust causal inference. Howey et al. (Reference Howey, Shin, Relton, Davey Smith and Cordell2020) used MR-determined ‘genetic anchors’ to resolve the directionality of edges in DAGs with greater confidence. Amar, Sinnott-Armstrong, Ashley, and Rivas (Reference Amar, Sinnott-Armstrong, Ashley and Rivas2021) proposed a method, cGAUGE, where DAG is employed to identify valid GIVs for MR, to determine causal connections in phenotype networks. DAG-based methods are better suited for large biobanks than for single-phenotype GWAS, given their requirements for raw data on both genotypes and (multiple) phenotypes from the same individuals. As standard DAGs do not permit causal loops, they fall short in capturing feedback mechanisms in real-world causal networks, which can result in symptom escalation as well as stabilization (e.g. the escalation of obesity and lack of exercise due to a vicious cycle of mutually reinforcing effects).
Conclusion
Mendelian randomization leverages genetic data to overcome the problem of unmeasured confounders in detecting and quantifying causal relationships. With easily accessible GWAS summary statistics on an ever-increasing number of diseases and traits, as well as user-friendly analytic tools, MR studies have become increasingly easy to perform. Many published studies have already applied MR to study the causes and consequences of psychiatric disorders. However, there are important limitations to consider when planning, implementing, and evaluating MR studies, to counter possible violation of assumptions which can lead to false positive causal inferences. Substantial methodological advances have been made in addressing the widespread pleiotropy observed across complex traits, but additional challenges remain. Nevertheless, MR in the multi-omics era holds great promise for elucidating some of the most pressing questions in psychiatry, and ultimately in constructing evidence-based causal networks that link biological and environmental risk factors to multiple intermediate phenotypes and psychiatric disorders. Such causal networks can generate detailed predictions of the consequences of different interventions, potentially guiding the identification of new treatment targets and the formulation of public health policies.
Acknowledgement
Funding from State Key Laboratory of Brain and Cognitive sciences, The University of Hong Kong.


 Open access