


Type 2 diabetes is increasing to epidemic proportions in the USA( 1 ); diabetes accounted for approximately $US 245 billion in spending( 2 ) and caused over 75 000 deaths in 2013( 3 ). Among Latinos, the largest minority group in the USA( 4 ), the prevalence of type 2 diabetes( 5 ) and related complications is higher compared with non-Hispanic White populations( 5 , 6 ). The literature also suggests significant disparity in health-care access among Latinos( 7 ).
Traditional medical care that focuses on medication may not be sufficient for proper diabetes management( Reference Lipton, Losey and Giachello 8 ). Dietary modifications may play an important role among Latinos with self-management of nutrition-related chronic conditions such as type 2 diabetes( Reference Lipton, Losey and Giachello 8 , Reference Norris, Engelgau and Narayan 9 ). Use of the Nutrition Facts Panel (NFP; which contains food-specific information such as serving size, nutrient content per serving and percentage daily values( 10 )) on food labels may play an important role in making and sustaining recommended dietary modifications( Reference Roy, Kelly and Rangan 11 ). Indeed, a previous randomized controlled trial among Latinos with type 2 diabetes suggested a role for improved NFP use in better blood glucose control( Reference Kollannoor-Samuel 12 ). However, NFP use is significantly lower among ethnic/racial minority populations, including Latinos, than among their non-Hispanic White peers( Reference Ollberding, Wolf and Contento 13 ). In addition, a study in a Latino population also reported poor understanding of NFP( Reference Sharif, Rizzo and Prelip 14 ). Factors associated with low NFP use or low understanding of NFP are not well understood. As such, understanding determinants of food label use in this subgroup is a priority. Factors such as acculturation (defined as ‘the process by which immigrants adopt the attitudes, values, customs, beliefs and behaviors of a new culture’( Reference Abraido-Lanza, Chao and Florez 15 )) may have an important role in determining NFP use among the Latino population. For example, a previous study suggested that NFP use increases with length of stay in the USA( Reference Roy, Kelly and Rangan 11 ), a commonly used proxy for acculturation( Reference Marin, Sabogal and Marin 16 ). Furthermore, evidence suggests that among Latinos, length of stay is highly correlated with Anglo-oriented acculturation( Reference Marin, Sabogal and Marin 16 ).
Beyond understanding the determinants of NFP use, there is currently limited empirical evidence describing associations between NFP use and ‘overall diet quality’ (diet quality) among Latino individuals with type 2 diabetes. Previous studies that have examined such an association with diet quality or patterns were conducted primarily among the general population( Reference Bonanni, Bonaccio and di Castelnuovo 17 , Reference Perez-Escamilla and Haldeman 18 ). Two studies have examined the association between NFP use and selected dietary components among minority groups. The study among Latinos with type 2 diabetes found better dietary habits among NFP users compared with NFP non-users when specific food items were measured, such as lower intakes of sweets, salty snacks and sugar-sweetened soda, and higher fruit and vegetable consumption( Reference Fitzgerald, Damio and Segura-Perez 19 ). The study conducted among African Americans reported that NFP users were likely to consume lower amounts of fat, and higher amounts of fruits and vegetables, compared with NFP non-users( Reference Satia, Galanko and Neuhouser 20 ). However, to the authors’ knowledge, no studies have examined the association between food label/NFP use and ‘diet quality’ or ‘dietary patterns’ among individuals with type 2 diabetes.
To address gaps in existing knowledge about NFP use among Latinos with type 2 diabetes and the association of NFP use with dietary intake, the first objective of the present study was to identify characteristics (sociodemographic, cultural, behavioural, biomedical and diabetes-related knowledge) associated with NFP use among Latinos with type 2 diabetes. The second study objective was to determine whether NFP use was associated with diet quality and patterns of dietary intake. The a priori study hypotheses were that NFP users were more likely than NFP non-users to (i) be younger, (ii) female, (iii) employed, (iv) more educated, (v) have higher monthly gross household income, (vi) be food secure (v. food insecure), (vii) speak English and/or (viii) have higher acculturation. Based on literature on food label/NFP use and diet among the general population, it was hypothesized that NFP users would be more likely to have a higher diet quality (measured from 24 h recall) and to consume ‘healthy’ dietary pattern(s), and less likely to consume ‘unhealthy’ dietary pattern(s), compared with NFP non-users (measured from an FFQ). An important innovation of the present study is that it is testing the association between NFP and dietary intake using two different dietary intake assessment tools. While dietary data from 24 h recall were used to test the association between NFP and overall dietary quality using the Healthy Eating Index-2010 (HEI-2010)( Reference Guenther, Casavale and Reedy 21 ), data from the FFQ were used to test the association between NFP and dietary patterns. If convergence in findings can be demonstrated, then this will increase the confidence in the associations being documented.
Methods
Secondary data analyses were conducted using cross-sectional baseline data from 203 individuals enrolled in the community-based Diabetes among Latinos Best Practices Trial (DIALBEST)( Reference Perez-Escamilla, Damio and Chhabra 22 ). DIALBEST was a randomized controlled trial testing a community health worker-led intervention to improve diabetes self-management among Latinos with poor blood glucose control. The primary outcome of the trial was the change in glycosylated Hb (HbA1c) concentration of the participants.
Study participants
DIALBEST’s design is detailed elsewhere( Reference Perez-Escamilla, Damio and Chhabra 22 ). Briefly, participants were 211 Latinos who attended a community-based, ambulatory, primary-care clinic at Hartford Hospital, Connecticut, USA, which targets low-income individuals. To be included in the study, DIALBEST participants had to meet the following criteria: (i) Latinos aged ≥21 years; (ii) living in Hartford County, Connecticut; (iii) having physician-diagnosed type 2 diabetes; and (iv) HbA1c≥7 %. Patients were excluded if they had medical conditions limiting their mobility or ability to participate in the study (such as significant diabetes complications, mental disorders or cancer, as assessed by their physicians). Eligible participants were invited to enrol in the study, and those who volunteered to participate were randomized to receive either standard of care only or standard of care plus the community health worker-led intervention. For the present secondary analysis, eight individuals who did not provide responses to the DIALBEST food label questionnaire module were excluded, leading to a sample size of 203 participants in the current study.
DIALBEST data collection
All participants were enrolled between December 2006 and February 2010, and data entry and biomarker analyses were completed by November 2011. A questionnaire was administered at each participant’s home by a trained bicultural/bilingual (Spanish and English speaking) interviewer before randomization. The DIALBEST questionnaire was pre-tested by five bilingual Hispanic Health Council (Hartford, Connecticut) staff and five Latinos with type 2 diabetes from Hartford County, Connecticut.
Nutrition Facts Panel use
Participants were shown a sample NFP and were asked if they had seen this portion of the food label. Participants who reported not having seen the NFP were considered NFP non-users. All other participants were asked to report whether they used the NFP for food selections always, sometimes, almost never or never. All participants who responded ‘never’ were asked to report reasons(s) for not using the NFP (open-ended question). A participant with ‘always or sometimes’ or ‘almost never/never’ was classified as ‘NFP user’ or ‘NFP non-user’, respectively.
Sociodemographic and economic data
Data on age (years), sex, gross monthly household income (dichotomized as ≤$US 1000 or ≥$US 1001; data-driven cut-offs), education (attended college/trade training; attended high school/GED equivalent (where GED=General Educational Development); ≤8th grade), employment status (yes or no), marital status (married or living together; single; separated/divorced; widowed), history of diabetes in a first-degree relative (yes or no) and household food security (assessed using a short form of the US Household Food Security Survey Module (HFSSM)( Reference Blumberg, Bialostosky and Hamilton 23 )) were collected. The household food security score ranged from 0 to 5, with 5 indicating the most severe level of food insecurity( Reference Blumberg, Bialostosky and Hamilton 23 ). Participants who scored 0 were classified as ‘food secure’, the rest were classified as ‘food insecure’.
Behavioural variables
Questions related to participant’s grocery shopping habits assessed whether a participant was the primary cook (yes or no) and/or was the primary grocery shopper (yes or no) for the household.
Cultural data
The Acculturation Rating Scale for Mexican Americans II (ARSMA) was used to calculate a continuous acculturation score( Reference Cuellar, Arnold and Maldonado 24 ). Although this scale was originally developed for Mexican Americans, Cuellar et al.’s( Reference Cuellar, Arnold and Maldonado 24 ) suggestion that it could be used among other Latino groups, including Puerto Ricans, has been previously confirmed( Reference Garcia, Hurwitz and Kraus 25 , Reference Teichman and Contreras-Grau 26 ). As recommended, acculturation scores were categorized into the following five categories: (i) very Hispanic; (ii) Hispanic-oriented; (iii) bicultural; (iv) Anglo-oriented bicultural; and (v) very Anglicized( Reference Cuellar, Arnold and Maldonado 24 ). In addition, participants were asked about their English-speaking status (yes or no).
Biomedical data
BMI (kg/m2) was calculated from body weight (in kilograms) and height (in centimetres) measured by trained personnel using standardized protocols( Reference Lohman, Roche and Martorell 27 ). Blood HbA1c was measured from capillary blood using a point-of-care kit certified by the National Glycohemoglobin Standardization Program (Metrika A1c Now; Metrika Inc. Sunnyvale, CA, USA) following manufacturer’s instructions.
Diabetes-related knowledge
Diabetes-related knowledge was assessed using a modified ‘brief diabetes knowledge test’( Reference Fitzgerald, Funnell and Hess 28 ). Original questions from this test that targeted patients with type 1 diabetes were excluded in DIALBEST. Therefore the DIALBEST knowledge survey scale was comprised of twelve items of the ‘brief diabetes knowledge test’( Reference Fitzgerald, Funnell and Hess 28 ). These items assessed participants’ knowledge regarding diabetes-related complications (three questions), HbA1c (one question regarding participants’ knowledge on approximate duration of glycaemia measured by HbA1c), nutrition (three questions), management of hypoglycaemia (two questions) and blood glucose change under particular circumstances (exercise, infection or flu; three questions). Each participant was assigned a score based on the percentage of correct responses (range: 0 to 100 %).
Dietary data
In the present study, participants’ food consumption was assessed using both an established index score and data-driven indicators (dietary patterns from factor analyses), which represent the two accepted analytical approaches for defining dietary patterns( Reference Ballard-Barbash, Krebs-Smith and Neuhouser 29 ).
Diet quality
The HEI-2010, a diet scoring metric that describes how close the dietary intake of an individual is to the federal dietary guidelines, was used to measure diet quality( Reference Guenther, Casavale and Reedy 21 ). Diet data for calculating HEI-2010 score were obtained from a single, five-step multiple-pass 24 h recall conducted in person( Reference Raper, Perloff and Ingwersen 30 ). To reduce participant burden, only a single 24 h recall was used. Data were entered into the Nutrition Data System for Research (NDSR) software version 2006 (Nutrition Coordinating Center, University of Minnesota, Minneapolis, MN, USA) by trained Nutritional Science graduate students. Energy-adjusted intake of twelve predefined food groups was calculated from the NDSR output in SAS software version 9.4 (2014). The recommended scoring technique( Reference Guenther, Casavale and Reedy 21 , 31 ) was used to calculate the total HEI-2010 score. Briefly, scores assigned for nine ‘adequacy’ (total fruit; whole fruit; total vegetables; greens and beans; whole grains; dairy; total protein foods; seafood and plant proteins; fatty acid ratio) and three ‘moderation’ (refined grains; sodium; empty calories) items were summed. Reverse scoring was adopted for the moderation items. Higher scores indicated higher diet quality and greater adherence to the US dietary guidelines (maximum score of 100). As the HEI-2010 authors did not recommend a predefined cut-off score to define high or low diet quality, the current study used the continuous HEI-2010 score.
Dietary pattern
Dietary intake patterns were generated from FFQ data that assessed participants’ usual habits of food intake in the past 12 months. This questionnaire was previously tested( Reference Perez-Escamilla, Ferris and Drake 32 ) and validated( Reference Fitzgerald 33 ) among Puerto Rican-dominant Latino communities. Average daily intakes were computed from participants’ reported frequency of food intake per day/month/year. Food intake was grouped into the following thirty-five food groups based on previous research( Reference Schoenaker, Dobson and Soedamah-Muthu 34 – Reference Nettleton, Steffen and Mayer-Davis 36 ) and a preliminary exploratory factor analyses (EFA): (i) fruits; (ii) cabbages; (iii) leafy vegetables; (iv) avocado; (v) tomato; (vi) potato (including French fries); (vii) plantains; (viii) root vegetables; (ix) other vegetables; (x) legumes; (xi) fruit juice; (xii) low-calorie drinks; (xiii) high-calorie drinks; (xiv) alcohol; (xv) water; (xvi) coffee with sugar; (xvii) coffee without sugar; (xviii) tea with sugar; (xix) tea without sugar; (xx) whole-grain products; (xxi) refined-grain products; (xxii) breakfast cereals; (xxiii) crackers; (xxiv) sweets and desserts with regular sugar; (xxv) sweets and desserts with artificial sweeteners; (xxvi) chips; (xxvii) nuts and seeds; (xxviii) high-fat dairy; (xxix) medium-fat dairy; (xxx) low-fat dairy; (xxxi) red and processed meat; (xxxii) poultry with skin; (xxxiii) poultry without skin; (xxxiv) fish; and (xxxv) eggs (see online supplementary material, Supplemental Table 1).
It is important to note that any food items regardless of the presence or absence of an NFP on the label were included in the dietary intake data, as we were testing the association of NFP use with the individual’s dietary habits, rather than with specific food items.
Statistical analyses
All analyses were conducted in the statistical software package SAS version 9.4 (2014). Bivariate analyses testing the association between continuous independent variables and NFP use were conducted using non-parametric Kruskal–Wallis tests, and median values with interquartile range are presented. Bivariate associations between NFP use and independent categorical variables were tested using either χ 2 tests or Fisher’s exact tests, and numbers and column percentages are reported. Independent variables that were found to be associated with NFP use at a P value of ≤0·20( Reference Widyahening, van der Graaf and Soewondo 37 ) in the bivariate analyses were then included in an initial multivariable logistic regression model. Backward stepwise elimination was conducted using the Akaike’s information criterion( Reference Agresti 38 ) to identify those variables associated with NFP use.
In the present study, thirty-five food groups were identified from 121 items of the FFQ using both previous research( Reference Schoenaker, Dobson and Soedamah-Muthu 34 – Reference Nettleton, Steffen and Mayer-Davis 36 ) and EFA( Reference O’Rourke and Hatcher 39 , Reference DiStefano, Zhu and Mîndrilă 40 ) (data not shown). Further EFA were conducted on the thirty-five food groups from the FFQ data to identify the food groups that clustered together. The maximum likelihood method with oblique rotation was employed in SAS software. Bartlett’s test of sphericity suggested that it was appropriate to conduct EFA with the study data (P<0·001). A ‘food group’ was considered as part of a ‘factor’ if it had a loading >|0·30| on that factor. Scree plots, the proportion of variance accounted by factors, and interpretability criteria were used to determine the number of factors( Reference O’Rourke and Hatcher 39 , Reference DiStefano, Zhu and Mîndrilă 40 ). SAS software-generated ‘regression-based factor scores’ were used to describe each individual’s dietary pattern. These factor scores are a numerical representation of a participant’s ranking or position on a latent factor( Reference DiStefano, Zhu and Mîndrilă 40 ). Thus, an individual with a certain score for a dietary pattern followed that pattern over the past year more often than another individual with a lower score.
All dietary variables were skewed visually and via formal testing (Kolmogorov–Smirnov test, P≤0·01). Therefore, quantile regression modelling (QRM), a non-parametric regression method that compares dietary intakes of NFP users with those of NFP non-users, was employed (PROC QUANTREG). Additionally, this method was chosen since it allowed simultaneous adjustment for multiple covariates. QRM was performed at nine percentiles (10th, 20th, 30th, 40th, 50th, 60th, 70th, 80th and 90th percentiles). Parameters were estimated using the interior point algorithm and 95 % CI were estimated using the resampling method( 41 ). Additionally, Wald’s test of heteroscedasticity was conducted to decide whether the effect of NFP use on diet was similar across all nine percentiles.
The initial multivariable QRM included all covariates that were associated with both NFP use and diet variables at P<0·20 in the bivariate analyses. A backward stepwise elimination procedure was conducted. A covariate (which could be a potential confounder) was considered a confounder and retained in the final model if it resulted in >10 % change in the β coefficient of NFP use. In addition, Akaike’s information criterion and Schwarz Bayesian information criterion (PROC QUANTSELECT) were examined to determine the fit of the model( 42 ).
Results are presented as OR or β coefficients with 95 % CI. The β coefficients represent the difference between diet measures of NFP users and NFP non-users at a specified percentile of the same diet measure. An association was considered significant at a P value of <0·05.
Additional analyses
Further analyses were conducted to explain the major findings of the study. The χ 2 or Fisher’s exact test was conducted to test the bivariate associations of acculturation, education, monthly gross household income and employment status with speaking English.
Results
Most of the study participants were middle-aged females. Over half had ≤8th grade education and only 16 % were employed. Approximately two-thirds lived in households with a gross monthly household income ≤$US 1000, and ~59 % reported living in a food-insecure household. The vast majority of participants reported having a first-degree relative diagnosed with diabetes. Only about one-third of the participants spoke English. The median BMI of the participants was 32·8 kg/m2 (Table 1) and about 70 % of the participants had BMI≥30·0 kg/m2 (obesity). The most commonly reported reasons for never using NFP (n 84) were ‘never seen it’ (64·3 %) and ‘lack of understanding about information given in the NFP’ (16·7 %; data not shown). Per study selection criteria, the participants had poor glycaemic control reflected in a median HbA1c of 9·3 (interquartile range 8·2–11·0) %. The median HEI-2010 score was 45·2 (interquartile range 37·4–54·0).
Table 1 Characteristics of 203 Latinos with type 2 diabetes, the Diabetes Among Latinos Best Practices Trial (DIALBEST), December 2006–November 2011
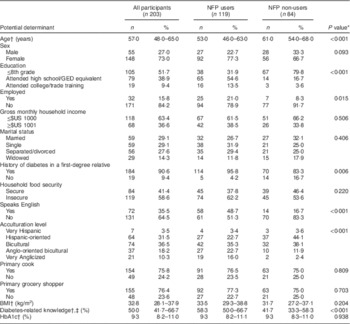
NFP, Nutrition Facts Panel; GED, General Educational Development; HbA1c, glycosylated Hb.
* Bivariate analyses for continuous variables were conducted using the Kruskal–Wallis test, and median and interquartile range are presented. Bivariate analyses for categorical variables were conducted using either the χ 2 or Fisher’s exact test, and number and column percentage are presented. Numbers may not sum to total due to missing values and percentages may not sum to 100 % because of rounding.
† Median with interquartile range.
‡ Diabetes-related knowledge indicates a percentage score that participants received for a modified brief diabetes knowledge test( Reference Fitzgerald, Funnell and Hess 28 ) that assessed participants’ knowledge on diabetes. Higher scores suggested better diabetes-related knowledge.
Determinants of Nutrition Facts Panel use
Bivariate analysis
Compared with individuals who did not use NFP (n 84), those who used NFP (n 119) were younger, had attended high school/GED equivalent or attended college/technical training, were employed, had a history of diabetes in a first-degree relative, spoke English, had higher acculturation levels (were Anglo-oriented bicultural and were very Anglicized) and had a better diabetes-related knowledge score (Table 1).
Multivariable logistic regression
Based on the final multivariable logistic regression model, participants who had attended high school/GED equivalent (OR=4·97; 95 % CI 2·35, 10·47; P<0·001) had higher odds of using NFP compared with participants with ≤8th grade education independent of other determinants. Similarly, English-speaking participants had higher odds of NFP use compared with those who did not speak English (OR=2·82; 95 % CI 1·29, 6·13; P=0·009) after adjusting for education and diabetes-related knowledge. In addition, odds of NFP use were higher with higher diabetes-related knowledge score, independent of education or speaking English (OR=1·04; 95 % CI 1·01, 1·06; P=0·001).
Dietary patterns
The scree plot from the initial EFA using thirty-five food groups suggested retaining six factors, each of which explained ≥6 % of the total variance. Together, these six factors explained about 86 % of the food items’ variance. Out of these six factors, two factors had only a single food group (‘fruits’ or ‘low-calorie drinks’) loading on them. Therefore, a six-factor solution was deemed not reasonable. Next, an EFA was run specifying five or four factors, in which ‘fruits’ was loaded with a ‘healthier dietary pattern’ consisting of vegetables, cereals and fish. ‘Low-calorie drinks’ did not cluster with any other food items in any of the EFA. Therefore, this food item was removed from further EFA and was analysed separately for its association with NFP use.
Another EFA was conducted with the remaining thirty-four food groups and without specifying the number of factors in the solution. Although the scree plot from these analyses suggested retaining six factors, this solution did not satisfy interpretability criteria. Further EFA were run after specifying a six-, five- or four-factor solution. In the six-factor solution, ‘fruits’ was loaded under more than one factor, violating the ‘simple structure’ principle. In both the six- and five-factor EFA, ‘avocado’ was showing its own distinct pattern and did not load with other variables. In the five- or four-factor solution, the food group ‘fruits’ was clustered together with healthy dietary pattern. The four-factor solution satisfied more EFA criteria than the five- or six-factor solution. It explained 74 % of the total variance in the food consumption pattern and satisfied the interpretability criteria. Food groups in each of the four factors had a similar conceptual meaning and demonstrated a simple structure. Therefore, the four-factor solution was deemed to be the best model.
Factors 1, 2, 3 and 4 explained 38, 17, 11 and 8 % of the total variance, respectively. The first factor, or ‘healthy’ pattern, consisted of fruits, cabbages, leafy vegetables, tomato, root vegetables, other vegetables, breakfast cereals, poultry without skin and fish. The second pattern, or ‘high carbohydrate and protein’ pattern, consisted of avocado, legumes, refined-grain products, crackers, and red and processed meat. The third pattern, the ‘high sugar and whole-fat dairy’ pattern, included tea with sugar and whole-fat dairy. The fourth pattern, namely the ‘fried snack’ pattern, included potato and French fries, chips and poultry with skin (Table 2).
Table 2 Factor loadings matrix for diet patterns obtained from FFQ data among 203 Latinos with type 2 diabetes, the Diabetes Among Latinos Best Practices Trial (DIALBEST), December 2006–November 2011Footnote *,Footnote †
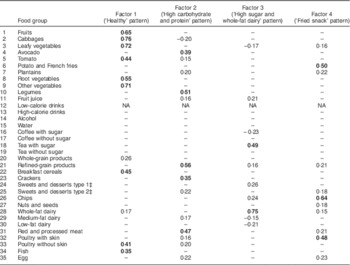
NA, not applicable.
* Results of factor analyses. Significant factor loadings (>|0·30|) are indicated in bold font. For simplicity of presentation, factor loadings that are <|0·15| are not presented in the table.
† Please refer to online supplementary material, Supplemental Table 1, for food items in each food group.
‡ Type 1 and type 2 are sweets and desserts with regular and artificial sweeteners, respectively.
Association between Nutrition Facts Panel use and diet quality
The associations between NFP use and diet quality at one or more percentiles of the HEI-2010 score were significantly different from that at another percentile (the test of heteroscedasticity, Wald χ 2=22·7, df=8, P=0·004). Therefore, simple and multivariable QRM was conducted within all nine percentiles of the HEI-2010 score. The simple QRM documented a significant association between NFP use and diet quality at the 70th and 80th percentiles of HEI-2010 scores. After adjusting for age, education, diabetes-related knowledge and acculturation level, NFP users had a significantly higher diet quality scores at the 80th and 90th percentiles compared with NFP non-users (Table 3; Fig. 1).
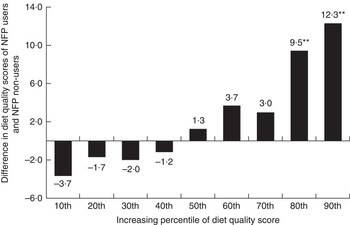
Fig. 1 Differences in the diet quality (Heathy Eating Index-2010) scores of Nutrition Facts Panel (NFP) users v. NFP non-users at the 10th, 20th, 30th, 40th, 50th, 60th, 70th, 80th and 90th percentiles of diet quality after adjusting for age, gender, education, diabetes-related knowledge and acculturation levels; results of multivariable quantile regression among 203 Latinos with type 2 diabetes, the Diabetes Among Latinos Best Practices Trial (DIALBEST), December 2006–November 2011. **P<0·01
Table 3 Association between Nutrition Facts Panel use and diet measures among 203 Latinos with type 2 diabetes, the Diabetes Among Latinos Best Practices Trial (DIALBEST), December 2006–November 2011
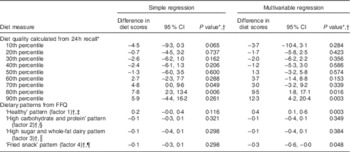
* Differences in diet quality scores measured using Healthy Eating Index-2010 between Nutrition Facts Panel (NFP) users and NFP non-users at each percentile: results of quantile regressions at nine percentiles of diet quality scores. Multivariable model was adjusted for age, education, diabetes-related knowledge and acculturation level.
† Differences in factor scores (derived from factor analyses on thirty-four food groups obtained from FFQ) between NFP users and NFP non-users at medians of factor scores: results of median quantile regression. Multivariable model was adjusted for age, sex, education and acculturation level.
‡ The ‘healthy’ pattern consisted of fruits, cabbages, leafy vegetables, tomato, root vegetables, other vegetables, breakfast cereals, poultry without skin and fish.
§ The ‘high carbohydrate and protein’ pattern consisted of avocado, legume, refined grain, crackers, and red and processed meat.
║ The ‘high sugar and whole-fat dairy’ pattern included tea with sugar and high-fat dairy.
¶ The ‘fried snack’ pattern included potato and French fries, chips and poultry with skin.
Association between Nutrition Facts Panel use and dietary patterns
The test of heteroscedasticity was not significant for factor 1 (χ 2=6·7, df=8, P=0·57), factor 2 (χ 2=3·7, df=8, P=0·88), factor 3 (χ 2=4·2, df=8, P=0·84) or factor 4 (χ 2=8·5, df=8, P=0·38). Therefore, only simple and multivariable median (at 50th percentile) QRM regressions were conducted. Factor-1, factor-2, factor-3 and factor-4 scores of NFP users were not significantly different from those of NFP non-users in the simple median regressions. After adjusting for age, sex, education and acculturation levels, factor-1 (β=0·4; 95 % CI 0·1, 0·6; P=0·003) and factor-4 (β=−0·3; 95 % CI −0·6, −0·0; P=0·048) scores of NFP users were significantly different from those of NFP non-users, indicating greater consumption of the ‘healthy’ and lesser consumption of the ‘fried snack’ dietary patterns over the past year, respectively. The multivariable median regression did not suggest significant associations between NFP use and factor-2 or factor-3 scores (Table 3).
Consumption patterns of the food group ‘low-calorie drinks’ were not different between NFP users and NFP non-users (simple QRM: β=−0·0; 95 % CI −0·1, 0·0; P=0·38 and multivariable QRM: β=0·0; 95 % CI −0·1, 0·0; P=0·16).
Additional analyses
In the present study, English-speaking participants were more likely to have higher acculturation levels (Anglo-oriented bicultural (34·7 v. 9·2 %) or very Anglicized acculturation (29·2 v. 0·0 %); P<0·001), have attended college/trade training (19·4 v. 3·8 %; P<0·001) and be employed (23·6 v. 11·5 %; P=0·023) compared with non-English speaking participants.
Discussion
The current study identified three potentially modifiable determinants of food label use. It also suggests that NFP use was associated with dietary intake (measured using 24 h recall or FFQ) among Latinos with type 2 diabetes. NFP use was associated with a greater likelihood of consuming a ‘healthier’ dietary pattern and a lesser likelihood of consuming a ‘fried snack’ dietary pattern. Also, at various levels of diet quality, associations between diet quality and NFP use were different.
Although other potential determinants were considered, only three variables (English-speaking ability, level of education and diabetes-related knowledge) independently predicted NFP use in the study participants. To the authors’ knowledge, these determinants of NFP use are reported for the first time among Latino adults with type 2 diabetes. The association between speaking English and higher NFP use could be attributed to better educational and employment status of English-speaking participants compared with non-English speaking participants. Better socio-economic status was previously reported to be associated with higher NFP use( Reference Ollberding, Wolf and Contento 13 , Reference Satia, Galanko and Neuhouser 20 ).
In our study, NFP users were more likely to be Anglo-oriented. Similarly, higher NFP use was reported in a multi-ethnic group of immigrants who lived in the USA for a longer period( Reference Ollberding, Wolf and Contento 13 ). As suggested previously, when immigrants live longer in the USA, they are likely to be more assimilated into mainstream US culture( Reference Marin, Sabogal and Marin 16 ). In our study, participants’ Anglo orientation was associated with speaking English. Better English-language skills might have helped our participants with Anglo orientation to become familiar with the NFP.
Although nutrition knowledge was identified previously as a significant positive predictor of NFP use in another group of Latinos with type 2 diabetes( Reference Fitzgerald, Damio and Segura-Perez 19 ), a probable role of diabetes-related knowledge at improving NFP use is reported for the first time in the current study. It is possible that participants with better understanding of various aspects of the disease’s self-management are more motivated to use NFP for food selection.
The current study identified a group of high-risk Latinos with type 2 diabetes who are less likely to use NFP than the general population. As our other results suggest, promoting NFP use in this population may be beneficial and any future NFP-based education among Latinos with type 2 diabetes might consider adopting culturally appropriate methods such as Spanish-based educational sessions from educators who are familiar with cultural beliefs and practices, and targeting individuals with poor socio-economic status and low diabetes-related knowledge.
As per the study hypothesis, NFP use was associated with higher diet quality, although a variable association was observed according to participants’ HEI-2010 score. As the HEI-2010 score of a participant increased, the likelihood of having better diet quality also increased for NFP users compared with NFP non-users. Among study participants with a HEI-2010 score of 58·3 or 66·8 (80th or 90th percentile, respectively), NFP use was associated with significantly higher diet quality. Nevertheless, among study participants with lower HEI-2010 scores (a score between 32·8 and 53·4), no such association was present. The observed differential associations between NFP use and diet quality at different levels of diet quality may suggest that participants need to already have a higher diet quality before a significant positive association between NFP use and diet quality can be expected. If a causal link is established by future studies, these findings may have some policy implications. NFP use could be used as an important tool to improve diet quality of individuals who already consume a healthier diet. However, among those with a low-quality diet, strategies such as NFP, nutrition and/or diabetes care-related education, or improving food access, might be more effective. Further research is needed to understand why NFP use appears to be ineffective at lower levels of diet quality and to confirm the study findings.
As hypothesized, NFP users (v. non-users) were more likely to consume a healthy dietary pattern and less likely to consume an unhealthy dietary pattern. The ‘healthy’ diet pattern identified in our study has a very similar composition to the patterns described as ‘prudent’( Reference Hu, Rimm and Stampfer 43 ) or ‘Mediterranean’( Reference Timmermans, Steegers-Theunissen and Vujkovic 44 ) by other authors. For example, a prospective cohort study among male health professionals previously identified a similar pattern consisting of green leafy vegetables, dark-yellow vegetables, cruciferous vegetables, tomatoes, other vegetables, garlic, legumes, fruits, fish, poultry and whole grains( Reference Hu, Rimm and Stampfer 43 ). Likewise, a study among Blacks and Latinos with type 2 diabetes identified a similar dietary pattern( Reference Davis, Schechter and Ortega 45 ). Thus, the key dietary pattern identified in the current study is highly consistent with previous published literature. The current study also identified a unique pattern consisting mostly of fried food items. In the literature, this pattern is usually grouped together with other ‘less healthy’ food choices such as refined grains or high-fat foods (commonly referred to as ‘western’ dietary pattern)( Reference Davis, Schechter and Ortega 45 ).
Although a causal conclusion is not possible given the cross-sectional nature of the data, it is possible that knowledge gained from reading NFP may have helped study participants distinguish healthy and unhealthy versions of a food item, particularly in the context of comparable findings from other studies( Reference Fitzgerald, Damio and Segura-Perez 19 , Reference Satia, Galanko and Neuhouser 20 , Reference Post, Mainous and Diaz 46 ). Previously published results from the same study population demonstrated the role of NFP use in long-term glucose control via improved diet quality( Reference Kollannoor-Samuel 12 ). Current literature reports positive associations between NFP use and a healthier diet, weight loss or glucose control( Reference Kollannoor-Samuel 12 , Reference Nikolaou, Hankey and Lean 47 , Reference Mandal 48 ). Although the majority of these studies were similarly cross-sectional in nature, some prospective studies were also conducted. For example, a link between energy label use and lower weight gain was demonstrated among young adults who participated in a prospective time-series intervention trial (non-randomized)( Reference Nikolaou, Hankey and Lean 47 ). Similarly, in another prospective study among multi-ethnic participants who were trying to lose weight, baseline food label use was associated with greater weight loss at 2-year follow-up( Reference Mandal 48 ). Further prospective cohort studies or controlled trials such as DIALBEST are needed to determine if the healthy dietary pattern identified leads to better metabolic and health outcomes among Latinos with type 2 diabetes specifically.
Limitations
The primary limitation of the present is the cross-sectional nature of the data, meaning that the causal nature of the associations between NFP use and diet cannot be determined. It is possible that NFP use is merely a marker of healthier dietary habits. The ability of NFP use to promote healthy dietary intake in this population will need to be confirmed. Further limitations include the fact that diet quality was measured using single 24 h recall which precluded measurement of day-to-day variability in dietary intake, and therefore the study might not have captured usual intake of episodically consumed( Reference Freedman, Guenther and Krebs-Smith 49 ) food items. Also, a lack of portion size data precluded us from calculating FFQ-associated energy intake. However, a unique strength of our study is that the association between NFP use and diet was identified using two distinct dietary assessment methods: 24 h recall and an FFQ; the fact that similar conclusions may be made across methods suggests the validity of our findings. Finally, DIALBEST targeted Latinos with low income, poorly controlled type 2 diabetes and who did not have impediments to perform leisure physical activities, thus limiting the external validity of the study. Also, as the study sample included were also participating in an intervention study, results may be biased from self-selection into study and study inclusion criteria as it is possible that those who participated in the study may be different from the target population of low-income Latinos with type 2 diabetes. Despite these limitations, the study generated several further research questions, the answers to which may have important implications for health promotion among this population group and others.
Conclusion
Findings from the present study indicate that higher levels of formal education, diabetes-related knowledge and speaking English are independent factors associated with higher likelihood of NFP use in a low-income Latino population with poorly controlled type 2 diabetes and that NFP use is associated with healthier dietary choices. While the prospective association between NFP use and positive dietary behaviours is yet to be confirmed in this specific population, there is evidence from other settings that NFP use is associated with greater nutrition knowledge and a healthier dietary intake, both of which may improve diabetes self-management. The current study may have important policy implications, as it provides preliminary evidence regarding the potential role of NFP use in improving dietary intake among Latinos with type 2 diabetes. Targeted interventions, taking account of culture and health literacy, may be warranted to improve NFP use in this population.
Acknowledgements
Financial support: This study was funded and supported by the Connecticut NIH Export Center for Eliminating Health Disparities among Latinos (National Institutes of Health/National Institute on Minority Health and Health Disparities grant number P20MD001765). The funders had no role in the design, analysis or writing of this article. Conflict of interest: Authors do not have any conflict of interest to declare. Authorship: G.K.-S. managed the clinical trial database, designed the current secondary data analyses, had full access to study data, conducted statistical analysis, wrote the first draft of the manuscript and had primary responsibility for the final content. S.S.-P. conceived part of the current study hypotheses and, as the Hispanic Health Council’s senior study coordinator, contributed significantly to the concept, conduct and coordination of the trial, data quality control and reviewed drafts of the article. F.M.S. contributed significantly to the statistical analyses framework, study hypotheses and reviewed drafts of the article. N.L.H. contributed significantly to the current study’s design and hypotheses and reviewed drafts of the article. G.D. co-conceived the idea for the original study, contributed significantly to the design and conduct of the trial, and reviewed drafts of the article. J.C. contributed significantly to the design and conduct of the study, was Hartford Hospital’s senior study coordinator, and reviewed drafts of the article. S.V.-L. was a senior study coordinator responsible for oversight of fieldwork and intervention fidelity and data quality checks, and reviewed drafts of the article. M.L.F. contributed significantly to the design and reviewed drafts of the article. R.P.-E. was the principal investigator for the study who co-conceived the idea for the study, had major input in study design, wrote the first draft of the manuscript and subsequent revisions, supervised the trial and conducted a major portion of the data analyses. All authors have read and approved the final manuscript. Ethics of human subject participation: This study was conducted according to the guidelines laid down in the Declaration of Helsinki and all procedures involving human subjects were approved by the Institutional Review of the University of Connecticut, the Hartford Hospital and the Hispanic Health Council before the start of the trial. Informed written consent was obtained from all individuals prior to their participation.
Supplementary material
To view supplementary material for this article, please visit https://doi.org/10.1017/S1368980017001860


