


Calcitriol (1α,25(OH)2D3) is an active form of vitamin D (25-hydroxyvitamin D; 25(OH)D) that plays a major role in numerous physiological processes, including regulation of Ca–P metabolism, bone turnover and muscle contraction. It is also a significant regulator of immune system activity, modulating the production of pro-inflammatory cytokines (like IL-6 and TNF-α) in monocytes through inhibition of p38 MAP kinase( Reference Zhang, Leung and Richers 1 ). Vitamin D deficiency may not only cause bone mineralization disturbances, but also is associated with increased prevalence of CVD, cancers, type 2 diabetes and depression( Reference Holick and Chen 2 ).
The concentration of 25(OH)D is accepted as equivalent to the total concentration of both 25(OH)D3 and 25(OH)D2 forms of vitamin D and is the major circulating metabolite of vitamin D as well as the best indicator of vitamin D status( Reference Bikle 3 ). Decreased skin synthesis related to reduced content of 7-dehydrocholesterol (a precursor in vitamin D synthesis), low sun exposure and low vitamin D content in the diet (mainly due to insufficient consumption of sea fish) are the major risk factors of vitamin D deficiency in the older population( Reference Holick and Chen 2 ). The lowest 25(OH)D concentrations are observed during winter and spring seasons as the consequence of low sun exposure( Reference Hirani, Cumming and Blyth 4 ).
Vitamin D deficiency is frequently observed in older populations, especially those living in moderate-climate countries and in nursing homes( Reference Lips, van Ginkel and Jongen 5 , Reference McKenna 6 ). Use of dietary supplements or drugs containing vitamin D are factors that could prevent its deficiency( Reference Hill, Granic and Davies 7 ).
Serum concentrations of 25(OH)D in older people vary between countries. The highest levels have been found in Australian and US populations (between 21·9 and 22·5 ng/ml for men in Australia; 28·4 ng/ml for women and 32·8 ng/ml for men in the USA)( Reference Hirani, Cumming and Blyth 4 , Reference Jacques, Felson and Tucker 8 ). Within Europe the highest mean 25(OH)D concentrations were found in older populations of Finland (between 19·2 and 19·9 ng/ml) and Spain (20·3 ng/ml)( Reference Jääskeläinen, Knekt and Marniemi 9 , Reference Mateo-Pascual, Julián-Viñals and Alarcón-Alarcón 10 ) and the lowest in Germany (between 13·5 and 15·8 nmol/l (5·4 and 6·3 ng/ml, respectively))( Reference Richter, Breitner and Webb 11 ). These discrepancies may be partially explained by evidence suggesting that latitude can influence cutaneous vitamin D synthesis, especially in winter season, sun avoidance due to health campaigns against skin cancer and low dietary vitamin D intake. Taking the vitamin D levels of the population of Finland into account, it can be assumed that food fortification and a high habitual intake of oil-rich fish can endure or exceed other factors affecting vitamin D levels.
Most of the epidemiological studies conducted in older populations have revealed no association between age and serum 25(OH)D concentration. However, Mateo-Pascual et al. documented a weak positive correlation between age and vitamin D deficiency( Reference Mateo-Pascual, Julián-Viñals and Alarcón-Alarcón 10 ). Also, a study including 759 older Americans showed that 25(OH)D concentration in women decreased by 0·7 nmol/l (0·3 ng/ml) for each additional year of age( Reference Jacques, Felson and Tucker 8 ). Two other studies indicated lower 25(OH)D concentration in older women compared with men( Reference Mateo-Pascual, Julián-Viñals and Alarcón-Alarcón 10 , Reference Hirani and Primatesta 12 ).
Chronic diseases and overall poor health are associated with low vitamin D status( Reference Hirani and Primatesta 12 ). Furthermore, various studies have reported associations between lower 25(OH)D concentration and poor environmental conditions, low economic status, lower educational level, drugs exposure, smoking and low physical activity( Reference Hirani, Cumming and Blyth 4 , Reference Mateo-Pascual, Julián-Viñals and Alarcón-Alarcón 10 , Reference Hirani and Primatesta 12 ).
It should be emphasized that beyond the known effect of vitamin D deficiency on osteoporosis development, new evidence suggests the role of insufficient concentration of this molecule in the increased incidence of cancer, CVD, type 2 diabetes and mortality( Reference Wyskida, Wieczorowska-Tobis and Chudek 13 ).
To sum up, there are only a few European studies performed in older populations assessing a broad range of sociodemographic factors which may influence vitamin D levels( Reference Hirani, Cumming and Blyth 4 , Reference Jacques, Felson and Tucker 8 – Reference Hirani and Primatesta 12 ). However, none of them concerned the older Polish population. Therefore, the aim of our study was to analyse the associations between sociodemographic factors and serum vitamin D concentration in the older Polish population.
Materials and methods
Study population
The PolSenior project, conducted between 2007 and 2011, was a large national, multicentre, interdisciplinary study that assessed the social and health situation of old people in Poland. The study subjects (n 4979) were divided into similar sized age cohorts (65–69 years, 70–74 years, 75–79 years, 80–84 years, 85–89 years, 90 years or older) created from a population representative of the Polish older population( Reference Błedowski, Mossakowska and Chudek 14 ). The study protocol included a questionnaire survey with comprehensive (including functional status) geriatric assessment, anthropometric and blood pressure measurements, as well as blood and urine collection (83·2 % of all eligible subjects). A detailed description of the PolSenior study design has been presented previously( Reference Błedowski, Mossakowska and Chudek 14 ). All methods were carried out according to relevant guidelines and regulations. The experimental protocol was approved by the Bioethics Committee of the Medical University of Silesia (KNW/0022/KB1/38/II/08/10; KNW-6501-38/I/08). Informed consent was obtained from all subjects.
For the current sub-analysis that aimed to check associations between sociodemographic factors and vitamin D levels, all 3472 individuals with measured 25(OH)D (1658 women and 1814 men) were included.
Biochemical measurements
All biochemical assessments were based on banked serum samples stored at −70°C. Serum 25(OH)D levels were assessed using a commercially available test and a HYBRID XL analyser (DRG Instruments GmbH, Marburg, Germany) according to the manufacturer’s protocol.
The limit of detection and limit of quantification of this method were 4·6 and 7·3 ng/ml, respectively. The range of the assay was 4·6–130 ng/ml (defined by values between the limit of detection and the maximal value on the master curve). The inter-assay precision value was 14·2 %, with the highest value for lower 25(OH)D concentrations.
Data analysis
Vitamin D status was categorized using commonly applied cut-offs and definitions of serum 25(OH)D: values below 10 ng/ml were categorized as severely deficient, between 10 and 30 ng/ml as deficient/insufficient and those equal to 30 ng/ml or above as sufficient 25(OH)D concentrations( Reference Buczkowski, Chlabicz and Dytfeld 15 ).
To present an analysis of the association between vitamin D concentration and age, a logarithmic transformation of 25(OH)D was performed.
Sociodemographic variables
The concentration of 25(OH)D in serum might be related to average exposure to UV radiation in the previous quarter( Reference Tuchendler and Bolanowski 16 ). For determination of seasonality’s influence on 25(OH)D concentration, a monthly distribution of concentrations was assessed. Further analysis, including quarter distribution of concentrations (with winter season defined as January through March, spring as April through June, summer as July through September and autumn as October through December), was performed.
The demographic and socio-economic status was assessed by data derived from the questionnaire (age, sex, educational level, economic status). Economic status of the respondents was determined by questions on how well the participants could manage their expenses. Those who could afford only the cheapest foods or clothes were considered the group of self-reported poverty. The other two groups included people with enough money for all needs and with enough money but not for all requirements. Additionally, data on alcohol consumption and cigarette smoking were also obtained from the questionnaire. Respondents were classified into not drinking or drinking two to three times per month, drinking at least once per week, and drinking every day or several times per week, as well as into those who never smoked cigarettes, past smokers and current smokers.
Functional status
The activities of daily living (ADL) were obtained by the Katz scale (maximal score: 6 points)( Reference Katz, Downs and Cash 17 ) and the instrumental activities of daily living (IADL) by the Lawton scale( Reference Lawton and Brody 18 ). For ADL, functional impairment was recognized at ≤5 points and disability at ≤2 points. For IADL, functional impairment was recognized at ≤23 points and disability at ≤18 points.
Current physical activity was assessed by an identification of exercise types undertaken by participants, such as cycling, working in the garden, walking short distances close to home, walking long distances for several hours or further from home, and the need for help during daily routine activities. All activities were analysed separately.
Statistical analysis
Statistical analysis was performed using STATISTICA version 10.0 PL (StatSoft Polska) and Stata SE version 12.0 statistical software packages and R version 3.4.2 (2017; The R Foundation for Statistical Computing). Statistical significance was set at a P value below 0·05. All tests were two-tailed. Imputations were not done for missing data. Nominal and ordinal data were expressed as percentages, while interval data were expressed as mean and standard deviation in the case of a normal distribution or as median and interquartile range in the case of data with skewed or non-normal distribution. Distribution of variables was evaluated by the Shapiro–Wilk test and homogeneity of variances was assessed by the Levene test. For comparison of data, one-way ANOVA analysis was used with RIR Tukey post hoc test and contrast analysis. Categorical variables were compared using χ 2 tests. To assess risk factors of 25(OH)D insufficiency, stepwise backwards multivariable logistic and ordered logistic regressions were used. Results were presented as odds ratio with 95 % confidence interval.
Results
Mean serum 25(OH)D concentration in the study group was 20·5 (sd 9·6) ng/ml (range: 2·3–125·0 ng/ml). Lower serum 25(OH)D concentrations were observed in women than in men (mean difference=−2·77 (95 % CI −3·41, −2·12) ng/ml; P<0·001). Values below the recommended value (≥30 ng/ml) were observed in 3002 (86·5 %) study subjects (1502 (82·8 %) men and 1500 (90·4 %) women; P<0·001). Detailed analysis revealed that 211 (12·7 %) women over 65 years of age had severe vitamin D deficiency (25(OH)D<10 ng/ml), 1289 (77·7 %) had vitamin D deficiency/insufficiency (25(OH)D=10–30 ng/ml) and only 158 (9·5 %) of them reached sufficiency (25(OH)D≥30 ng/ml). Similar data were found for men; 144 (7·9 %) of men over 65 years of age were severely vitamin D deficient, 1358 (74·9 %) had deficiency/insufficiency and 312 (17·2 %) of them were vitamin D sufficient (Table 1). Detailed information about socio-economic factors and vitamin D status in the PolSenior population, including among others educational level, place of living, income data, habits and nutritional status (BMI categories), are presented in Table 1.
Table 1 Socio-economic factors and vitamin D statusFootnote * in community-dwelling Polish men and women aged 65 years or older (n 3472), PolSenior study, 2007–2011

ADL, activities of daily living; IADL, instrumental activities of daily living; 25(OH)D, 25-hydroxyvitamin D.
* Severe deficiency, serum 25(OH)D<10 ng/ml; deficiency/insufficiency, serum 25(OH)D=10–30 ng/ml; sufficiency, serum 25(OH)D≥30 ng/ml.
Vitamin D supplements were taken by only thirty-nine (2·4 %) women and nine (0·5 %) men. Detailed analysis of the correlation between log10(25(OH)D) concentration and age revealed that for each additional 10 years of life there was, on average, a decrease of 0·058 ng/ml (0·060 ng/ml in women and 0·057 ng/ml in men) in mean serum 25(OH)D concentration (Fig. 1).
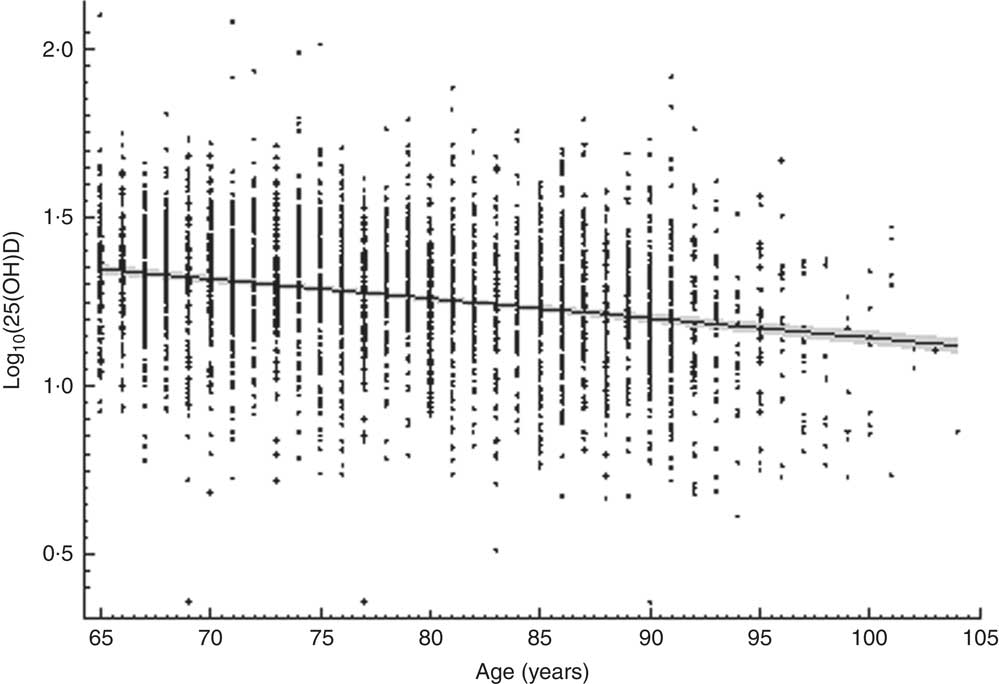
Fig. 1 The relationship between serum vitamin D concentration (measured as 25-hydroxyvitamin D in ng/ml and log-transformed; log10(25(OH)D)) and age among community-dwelling Polish men and women aged 65 years or older (n 3472), PolSenior study, 2007–2011. ––– is the regression line and the grey zone is the 95% CI for the regression line
Seasonal changes in vitamin D level
Most of the serum samples were taken during months with low exposure to sunlight (i.e. 26·3 % of all respondents donated blood between February and March, and 36·6 % between September and November). Only forty-eight (1·4 %) participants were receiving vitamin D supplementation. There were no data concerning the period of supplementation.
The highest 25(OH)D concentration was observed in August, while the lowest was observed in March, regardless of age (Fig. 2). The difference in serum 25(OH)D concentration between March and August was 5·4 (95 % CI −6·9, −3·9) ng/ml.
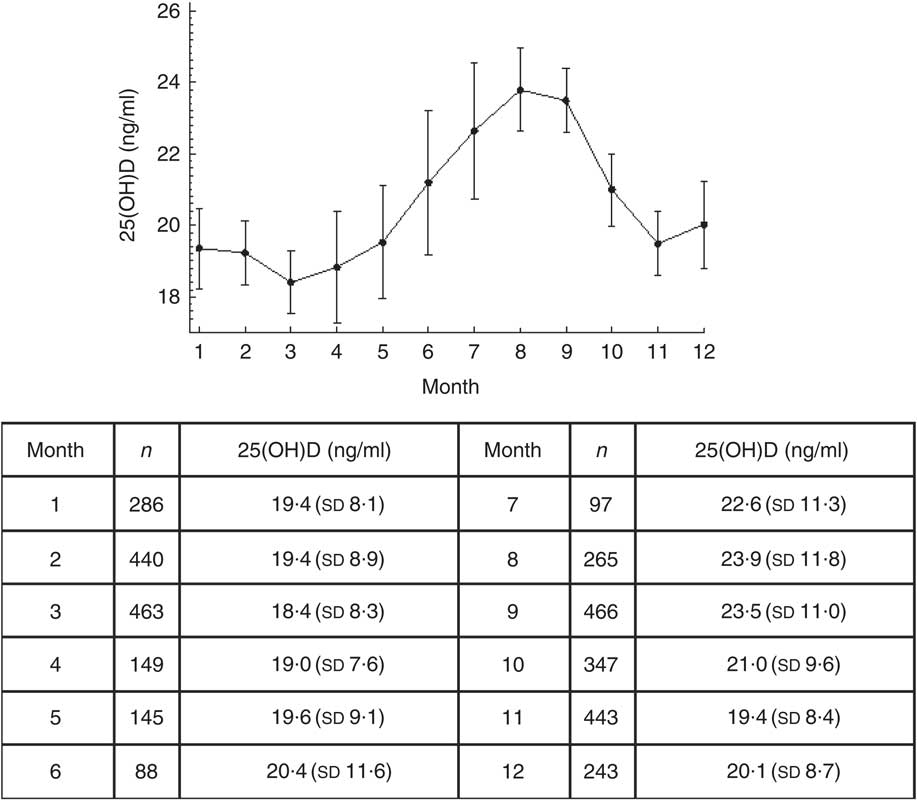
Fig. 2 Monthly serum vitamin D concentration (measured as 25-hydroxyvitamin D; 25(OH)D) of community-dwelling Polish men and women aged 65 years or older (n 3472), PolSenior study, 2007–2011. Values are means, with their 95 % confidence intervals depicted by vertical rules
The most frequently sufficient serum levels of vitamin D were detected in August both in women and men (20·3 and 28 %, respectively), whereas the lowest percentage of adequate vitamin D concentrations was found in January (5·3 %) among women and in March (8·8 %) among men.
Serum vitamin D concentration and sociodemographic factors
Greater differences in serum 25(OH)D concentrations were observed in women, in whom a low concentration of 25(OH)D was more frequently detected in the poorly educated subgroup (P<0·001), in those with low personal incomes (P<0·01) and in those working previously as blue-collar workers (P<0·001). Vitamin D concentration below optimal level was observed more frequently in men and women declaring abstinence from alcohol consumption. Subjects not taking both short- and long-distance walks were less likely to drink alcohol (OR=0·37; 95 % CI 0·31, 0·44 and OR=0·39; 95 % CI 0·32, 0·47, respectively; P<0·001).
Functional impairment in ADL was found in 29·4 % of women and 18·7 % of men, and was associated with severe 25(OH)D deficiency. On the other hand, in subjects with full function in IADL, severe deficiency was observed only in 5·9 % of women and 4·3 % of men.
There was no association between 25(OH)D concentration and nutritional (BMI categories) and smoking status and place of residence in both sexes, as well as between 25(OH)D concentration and educational and economic status in men (Table 1).
Multiple regression models
To analyse risk factors for severe deficiency and deficiency/insufficiency by taking 25(OH)D level in groups as below 10 ng/ml, between 10 and 30 ng/ml and the optimal level equal to 30 ng/ml or above, multivariable, stepwise, backwards ordered logistic regression was done. The following factors were included into the model: third quarter (summer) v. other quarters of the year, female sex, age ≥80 years, none/primary education, low income, any ADL disability, alcohol abstinence and short- and long-distance walks, cycling and gardening. Regression analysis revealed that in the third quarter in comparison to other quarters there was a low risk of severe deficiency or deficiency/insufficiency. Moreover, subjects who were long-distance walkers had decreased risk of severe deficiency or deficiency/insufficiency. Any disability was associated with any deficiency or insufficiency. The sex-adjusted analysis revealed that four other factors, namely older age, alcohol abstinence and the lack of long-distance walking and cycling, were associated with any 25(OH)D deficiency or insufficiency. Apart from the factors discussed above, low income, as well as the lack of short-distance walking, were additional risk factors of any deficiency or insufficiency. Detailed results are presented in Table 2.
Table 2 Results of stepwise backwards multivariable logistic and ordered logistic regression, crude and sex-adjusted analyses, for any vitamin D deficiency/insufficiencyFootnote * among community-dwelling Polish men and women aged 65 years or older (n 3472), PolSenior study, 2007–2011
ADL, activities of daily living; 25(OH)D, 25-hydroxyvitamin D.
* Severe deficiency, serum 25(OH)D <10 ng/ml; deficiency/insufficiency, serum 25(OH)D=10–30 ng/ml.
Discussion
Our study is the first presenting epidemiological data concerning vitamin D status in older Polish adults. According to the International Osteoporosis Foundation, the optimal 25(OH)D concentration for the overall adult population in Europe ranges between 30 and 80 ng/ml( Reference Płudowski, Karczmarewicz and Bayer 19 ). This concentration is considered the most efficient regarding intestinal Ca absorption and maximal prevention of secondary hyperparathyroidism( Reference Durazo-Arvizu, Dawson-Hughes and Sempos 20 ). Mean concentration of 25(OH)D in our study was 20·5 (sd 9·6) ng/ml and was lower by 9·5 ng/ml compared with the recommendation. This value is one of the lowest among those found in older populations worldwide( Reference Hill, Granic and Davies 7 – Reference Hirani and Primatesta 12 , Reference Kudlacek, Schneider and Peterlik 21 – Reference Rabenberg, Scheid-Nave and Busch 25 ) and is similar to the 25(OH)D concentration observed in Germany (mean 39·5 (sd 7·5) nmol/l (15·8 (sd 3·0) ng/ml) in the population aged 65–74 years; mean 33·8 (sd 4·8) nmol/l (13·5 (sd 1·9) ng/ml) in the population aged 75–81 years)( Reference Richter, Breitner and Webb 11 ). This similarity might be explained by geographical location (both countries are located at the same latitude with the same exposure to sunlight) and by similar low fish consumption( Reference Richter, Breitner and Webb 11 , Reference Failler 26 ).
It is well established that vitamin D concentration decreases with age. In the Framingham Heart Study population of 290 men and 469 women aged 67–95 years, mean decrease of serum vitamin D concentration per each following decade of life was 2·8 ng/ml for women, with no significant decrease among men( Reference Jacques, Felson and Tucker 8 ). Based on our much larger study, the rate of serum 25(OH)D concentration decline was 0·058 ng/ml per decade of life, similarly in men and women. This discrepancy may result from lower sun exposure (related to higher latitude) in Poland than in Framingham (MA, USA) and different eating habits.
According to the literature, older women are more prone to develop vitamin D deficiency( Reference Hill, Granic and Davies 7 ). Only a few studies have aimed to explain these discrepancies between sexes. One of the possible explanations is the more common use of sunscreen cosmetics among women. Interestingly, some data suggest that artificial supplementation and foods rich in vitamin D have a greater impact on the increase of serum 25(OH)D concentration in women, which may suggest the largest rate of cholecalciferol skin synthesis among men( Reference Jacques, Felson and Tucker 8 ). It is estimated that after 70 years of age 7-dehydrocholesterol concentration in the skin is diminished by 75 % compared with values observed in young adults. In our study, women had a lower concentration of 25(OH)D than men. Regression analysis revealed that the difference between sexes is associated with less walking in women, probably resulting in less sunlight exposure. One of the most important factors affecting serum vitamin D levels is the content of its precursors in food. Therefore, one of the major limitations of our study is the lack of complete data concerning natural vitamin D intake. However, collection of reliable data on dietary intake, performed during such a large epidemiological study, is difficult. The most important 25(OH)D dietary sources are sea fish, fish oils and, to a lesser extent, meat and dairy products. Based on data on average fish consumption in Europe, in Poland it was estimated at 13 kg/capita per year, which places our country among countries with the lowest consumption( Reference Failler 26 ). The main group of fish species consumed in Poland are pollock and herring (25 and 21 % of all consumed species, respectively)( Reference Kołodziejczyk 27 ). The amount of vitamin D in pollock and herring is 0·07 and 12 µg/100 g, respectively( Reference Kunachowicz 28 ). A study which assessed the content of vitamin D in adults’ daily food rations in Poland revealed very low vitamin D levels. Vitamin D intake varied between 1·1 and 22·1 µg/d in women and between 1·0 and 11·2 µg/d in men >65 years old. Moreover, content of vitamin D was independent of dietary energy intake( Reference Lebiedzinsk, Rypina and Czaja 29 ).
It was demonstrated that daily supplementation with 2·5 µg 25(OH)D is related to an increase of its serum level by about 1·0 ng/ml (range: 0·7–1·1 ng/ml)( Reference Heaney, Davies and Chen 30 ). In Poland, only margarine and butter are fortified with vitamin D. The rate of vitamin D supplementation in our study was low (2·4 % of women and 0·5 % of men), with the highest prevalence (4·4 %) in women with vitamin D sufficiency. Moreover, we noticed that vitamin D supplementation was frequently too low to obtain an optimal serum 25(OH)D level. The intake of vitamin D supplements in Europe is low and amounts to about 2–3 µg/d (except for populations of Norway and Sweden, where a high consumption of sea fish and food rich in vitamin D is observed)( Reference Oversen, Andersen and Jakobsen 31 ). The Institute of Food and Nutrition in Poland recommends for age between 51 and 70 years dietary or pharmaceutical supplementation of vitamin D to be 15 µg/d, while in individuals above 70 years of age, 20 µg/d( Reference Jarosz 32 ).
Contrary to other studies( Reference Hill, Granic and Davies 7 , Reference Brouwer-Brolsma, Vaes and van der Zwaluw 22 ), we found no association between overweight as well as obesity and serum 25(OH)D levels. In old age, rather BMI below 25 kg/m2 is considered a risk factor for vitamin D deficiency( Reference Hirani and Primatesta 12 ). In our study the lack of this association could be explained by the low number of underweight subjects (Table 1). Underweight even more than normal weight can stem from inadequate nutrition and low consumption of foods rich in vitamin D.
Low educational level is one of the factors affecting serum 25(OH)D concentrations( Reference Hirani and Primatesta 12 ). However, in our study, this factor was associated with serum vitamin D concentration only in women. It should be emphasized that only 7·3 % of women and 15·7 % of men with none or only primary education had a sufficient vitamin D concentration. A higher percentage of well-educated people had a sufficient vitamin D concentration. It is well known that level of education is related to the type of work. Also, another study, performed on the older population, has shown an association between physical work and low serum 25(OH)D concentration( Reference Hirani and Primatesta 12 ). In our study profession (physical or intellectual) in the past was associated with serum vitamin D level only among women and severe vitamin D deficiency was more frequent in former ‘blue-collar workers’.
We found an association between personal income and serum 25(OH)D concentration in women but not in men. Our findings contrast with Jungert and Neuhäuser-Berthold’s study which described the positive association between economic status in men and 25(OH)D levels; however, in that study household income was calculated( Reference Jungert and Neuhäuser-Berthold 24 ), while in our study income was self-reported. It should be emphasized that in our study the percentage of women with low personal income was much higher compared with men (48·2 % of women v. 22·7 % of men), corresponding to more frequently severe vitamin D deficiency (14·4 v. 8·9 %, respectively). This phenomenon can be also explained by the higher percentage of women living alone (27·5 % of women v. 13·9 % of men) and living without a spouse (never married, widowed and divorced; 69·6 % of women v. 29·2 % of men), compared with men, in the population of the PolSenior study( Reference Błedowski, Mossakowska and Chudek 14 ). The low income of those living alone probably limits the possibility of buying more expensive and vitamin D-rich food products (e.g. sea fish, fish oils, fortified foods, eggs).
Smoking impairs vitamin D hepatic metabolism and the 1α-hydroxylation process thereby interferes with Ca absorption, exacerbating the loss of bone mineral density. Contrary to Hirani et al., our study failed to confirm the association between smoking and serum 25(OH)D levels( Reference Hirani, Cumming and Blyth 4 ). The smaller proportion of smokers in our study may have caused the missing impact of smoking on serum 25(OH)D concentration (4·6 % current smokers in women and 14·4 % in men). In our study, we have shown a hardly explainable association between alcohol abstinence and low vitamin D level. In contrast, several studies did not confirm the relationship between alcohol consumption and vitamin D status in older people( Reference Hirani, Cumming and Blyth 4 , Reference Hill, Granic and Davies 7 , Reference Jääskeläinen, Knekt and Marniemi 9 , Reference Jungert and Neuhäuser-Berthold 24 ). The association between alcohol intake and better vitamin D status is indirect, and stronger in men( Reference Lee 33 ). Also in Poland, drinking of alcohol is habitually associated with getting together and eating outside. This statement is supported by the strong association between alcohol abstinence and not taking short- and long-distance walks.
Sufficient sun exposure is defined as spending 10–15 min outdoors daily between 11.00 and 15.00 hours from March to November with head and hands exposed to the sun. It is estimated that this amount of sun exposure determines the synthesis of 6–7 µg/d throughout the year. Participants with blood samples collected during winter and spring had lower serum 25(OH)D levels than those with blood samples collected in the summer and autumn. It is noteworthy that mean serum 25(OH)D concentration did not exceed 24 ng/ml throughout the year. Distribution of insolation (the average number of hours of sunshine during the year) on the whole surface in our country is very equal. In 2010 there was on average 1600 h of sunshine in Poland( 34 ). Regardless of the lack of data on time spent outside, and precise estimation of individual UVB exposure, a positive association between physical activity and 25(OH)D was observed. No data on the use of sunscreen protection and clothing habits were collected.
Both types of activity (gardening, cycling) had a similar impact on 25(OH)D concentration. In our study, there are no data about estimated time of those activities. Brock et al. suggested that increased physical activity may be a factor associated with 25(OH)D status regardless of the effect of sun exposure( Reference Brock, Huang and Fraser 35 ).
In our study there was an association between severe functional impairment in ADL and the presence of severe 25(OH)D deficiency. Older people with reduced mobility have lower serum 25(OH)D concentrations due to limited outdoor activity and less sun exposure. Kojima et al. observed that more disabilities in ADL and disability in feeding were independently associated with a higher risk of 25(OH)D deficiency( Reference Kojima, Tamai and Masaki 36 ). Similarly, an inverse relationship between 25(OH)D deficiency and functional status was described by Gloth et al. Also, functional improvement was observed after vitamin D and Ca supplementation( Reference Gloth, Smith and Hollis 37 ), suggesting the necessity of routine vitamin supplementation in older with severe functional impairment.
The major limitation of our study, as well as of previous studies, is the fact that some samples were collected during the summer, which is not recommended; however, as shown, the summer–winter difference in serum 25(OH)D was relatively small.
The adequacy of vitamin D status, measured by the circulating levels of 25(OH)D, reflects not only the cutaneous synthesis from solar exposure but also dietary sources. Several recent cross-sectional studies demonstrate the importance of vitamin D intake in the prevention of chronic disease. As summarized by Calvo et al.( Reference Calvo, Whiting and Barton 38 ), such associations are shown between estimated vitamin D intake and the reduction in risk of osteoporosis, diabetes, cancer, multiple sclerosis and rheumatoid arthritis development. Although our study provides information about the percentage of supplementation, the limitations include the assessment of diet only in a subgroup of participants (not shown herein) and the lack of information about doses of vitamin D supplementation and individual sunlight exposure. The strength of our study is that the study group was large and ethnically homogeneous.
Conclusion
Vitamin D deficiency/insufficiency is a highly prevalent condition: based on our study, it is present in 86·5 % of the older Polish population. It is associated with functional disability and impaired mobility of old people. In this population, vitamin D supplementation should be routinely considered.
Acknowledgements
Financial support: The PolSenior study was implemented under publicly funded Project No. PBZ-MEIN-9/2/2006, by the Polish Ministry of Science and Higher Education. The vitamin D assessments were partially covered by grants from the Medical University of Silesia (KNW-2-K-30/D/7/N) and partially by DRG MedTek sp. z.o.o. (Warsaw, Poland). The funders had no role in the design, analysis or writing of this article. Conflict of interest: All authors declare that they have no conflict of interest. Authorship: M.W. drafted the manuscript; A.O. performed the statistical analysis and revised the manuscript; A.S. participated in data collection; A.B. performed laboratory analyses; I.S. performed laboratory analyses; K.W.-T. critically revised the manuscript; M.P.-K. critically revised and edited the manuscript; E.F. participated in the study design and revised the manuscript; M.M. participated in the study design and edited the manuscript; T.G. participated in the study design and revised the manuscript; A.W. participated in the study design and revised the manuscript; M.O.-G. participated in the manuscript drafting; J.C. participated in the design of the study, co-drafted the manuscript and collected funds. All authors read and approved the final manuscript. Ethics of human subject participation: All methods were carried out according to relevant guidelines and regulations. The experimental protocol was approved by the Bioethics Committee of the Medical University of Silesia (KNW/0022/KB1/38/II/08/10; KNW-6501-38/I/08). Informed consent was obtained from all subjects.


