


1. Introduction
Laser-induced damage is a major factor limiting the lifetime of optical components that can increase transmission losses and generate additional damage to optics downstream as a result of beam modulation[Reference Huang, Han, Wang, Xiang, Li, Feng, Jing, Wei, Zheng and Zhang1–Reference Hunt, Manes and Renard5]. The initial damage threshold and damage growth are typically used to estimate the properties of optical damage[Reference Deng and Jin6–Reference Liao, Abdulla, Negres, Cross and Carr9]. The morphology of damage sites is of great importance in investigating damage mechanisms[Reference Yoshiyama, Genin, Salleo, Thomas, Kozlowski, Sheehan, Hutcheion and Camp10, Reference Han, Li, Duan, He, Feng and Yang11]. The lifetime of optics is mainly determined by the damage growth resulting from repeated pulses, including the growth in lateral size and number of damage sites[Reference Rubenchik and Feit12]. The performance of the optics after subsequent shots might be considered acceptable in many applications if an initiated damage site with a typical diameter of tens of microns is very stable. However, if the laser-initiated site is not stable and increases in size then the performance of the optics will be degraded with further laser shots until it can no longer be used[Reference Norton, Donohue, Hollingsworth, Feit, Rubenchik and Hackel13]. On the other hand, the modulation effects induced by multiple damage sites on the transmitted beam quality are more serious than those from a single site[Reference Zhang, Lu, Cao, Yin, Lv, Zhang, Li, Wang, Ma and Zhu14].
Damage detection is one of the main methods to directly evaluate the damage properties of optical components. In 1997, Lawrence Livermore National Laboratory (LLNL)[Reference Rainer15] began research on damage detection in optics and further applied it to the National Ignition Facility (NIF). They adopted dark-field imaging technology to detect the damage as the damage image captured had a high contrast, which was beneficial to distinguish damage sites from the background. However, damage sites in the damage image have blurry edges and require an effective edge extraction method. Considering the significance of damage site information in the evaluation of damage properties, a method of information extraction with sufficient accuracy to determine the number and dimensions of damage sites is required. Typically, a binarization threshold technique is widely used to extract and measure damage areas in damage images. However, the extraction of information on damage sites by binarization depends greatly on the threshold selection, which is sensitive to the uniformity of illumination and the gray contrast between the object and the background. Furthermore, the binarization threshold extraction method focuses on the gray information and ignores the spatial information[Reference He, Ge and Wang16]. Han et al. [Reference Han, Li, Duan, He, Feng and Yang11] used a marker-controlling watershed algorithm to investigate the fine morphology of damage sites, which can segment adjacent objects with blurry edges. Limited by the object distance and the field of view of the microscope, the damage images captured by the CCD have disadvantages such as shadowing, non-uniform illumination and image contrast, burst noise and background gray variation, which can lead to over-segmentation in the marker-controlling watershed algorithm.

Figure 1. Flow chart of the imaging process using the MWGC.
Table 1. Comparison of Damage Site Sizes Obtained by Different Measurement Methods.

In this paper, gray control is included in the watershed algorithm to accurately extract information on damage in fused silica samples induced by large-aperture laser irradiation. Fused silica samples including Corning-7980 and Heraeus-Suprasil 312 were tested experimentally and the damage images were processed by the marker-based watershed algorithm with gray control (MWGC). The results show that the growth of damage on the exit surface is exponential and the number of damage sites decreased sharply with damage site size. The average damage growth coefficients at 351 nm are fitted to be  $1.10 \pm 0.31$ and
  $0.60 \pm 0.09$ for Corning-7980 and Heraeus-Suprasil 312 samples, respectively.
2. Marker-based watershed algorithm with gray control
When considering multiple damage sites in one damage image, damage site extraction requires a clear edge contour to calculate the damage site area. To obtain the dimensions of damage sites and their distribution, the MWGC is applied to segment the damaged regions and accurately extract the lateral size information. Vincent et al. [Reference Vincent and Soille17] proposed a immersion simulation-based watershed segmentation algorithm, which used regions growing from local minima in nature. Benefiting from the advantage of fast computation speed, closed contours, and accurate positioning, the watershed algorithm is applied in many fields. Moreover, this algorithm has a sensitive response to weak edges. Because of the non-uniform illumination field in dark-field imaging systems[Reference Rainer15] and the presence of optical aberrations, both noise and dark textures appear in the damage image and give rise to fake local minima. If the watershed algorithm is applied to these fake minima then image over-segmentation will possibly occur. To overcome the problem of over-segmentation of the image, gray control is implemented before the watershed calculation to remove noise and gradient non-uniformity.
The gray control is realized by setting a threshold that directly affects the image processing results. The threshold is determined by the gray level histogram of pixels in the damage image. For a damage image obtained by dark-field imaging technology, the image background has a low pixel gray value and maximum probability in the pixel gray histogram statistic. When the probability drops to the minimum from the peak, the gray value corresponding to the minimum probability is defined as the threshold of gray control. Figure 1 shows the flow chart of the improved algorithm.
Figure 2 shows the damage images extracted by different segmentation techniques. Figure 2(a) is the original damage image obtained by a microscope with CCD. The image binarization (Figure 2(b)) is merely an image denoising process for the gray information and cannot divide the damage sites. Since the selected threshold values in the threshold segmentation algorithm are generally determined by the gray scale for different regions, region segmentation based on this will be over-sensitive, which makes the damage pits inside one site divided into multiple sites unfavorably. This can be seen from damage regions with low gray contrast between the object and background in Figure 2(c). Over-segmentation can be observed in Figure 2(d) using marker-based watershed algorithms without gray control. In contrast, the MWGC clearly marks the different damage sites, which facilitates obtaining the damage growth and damage site size distribution. The different colors in Figures 2(c)–(e) represent different segmented damaged regions.
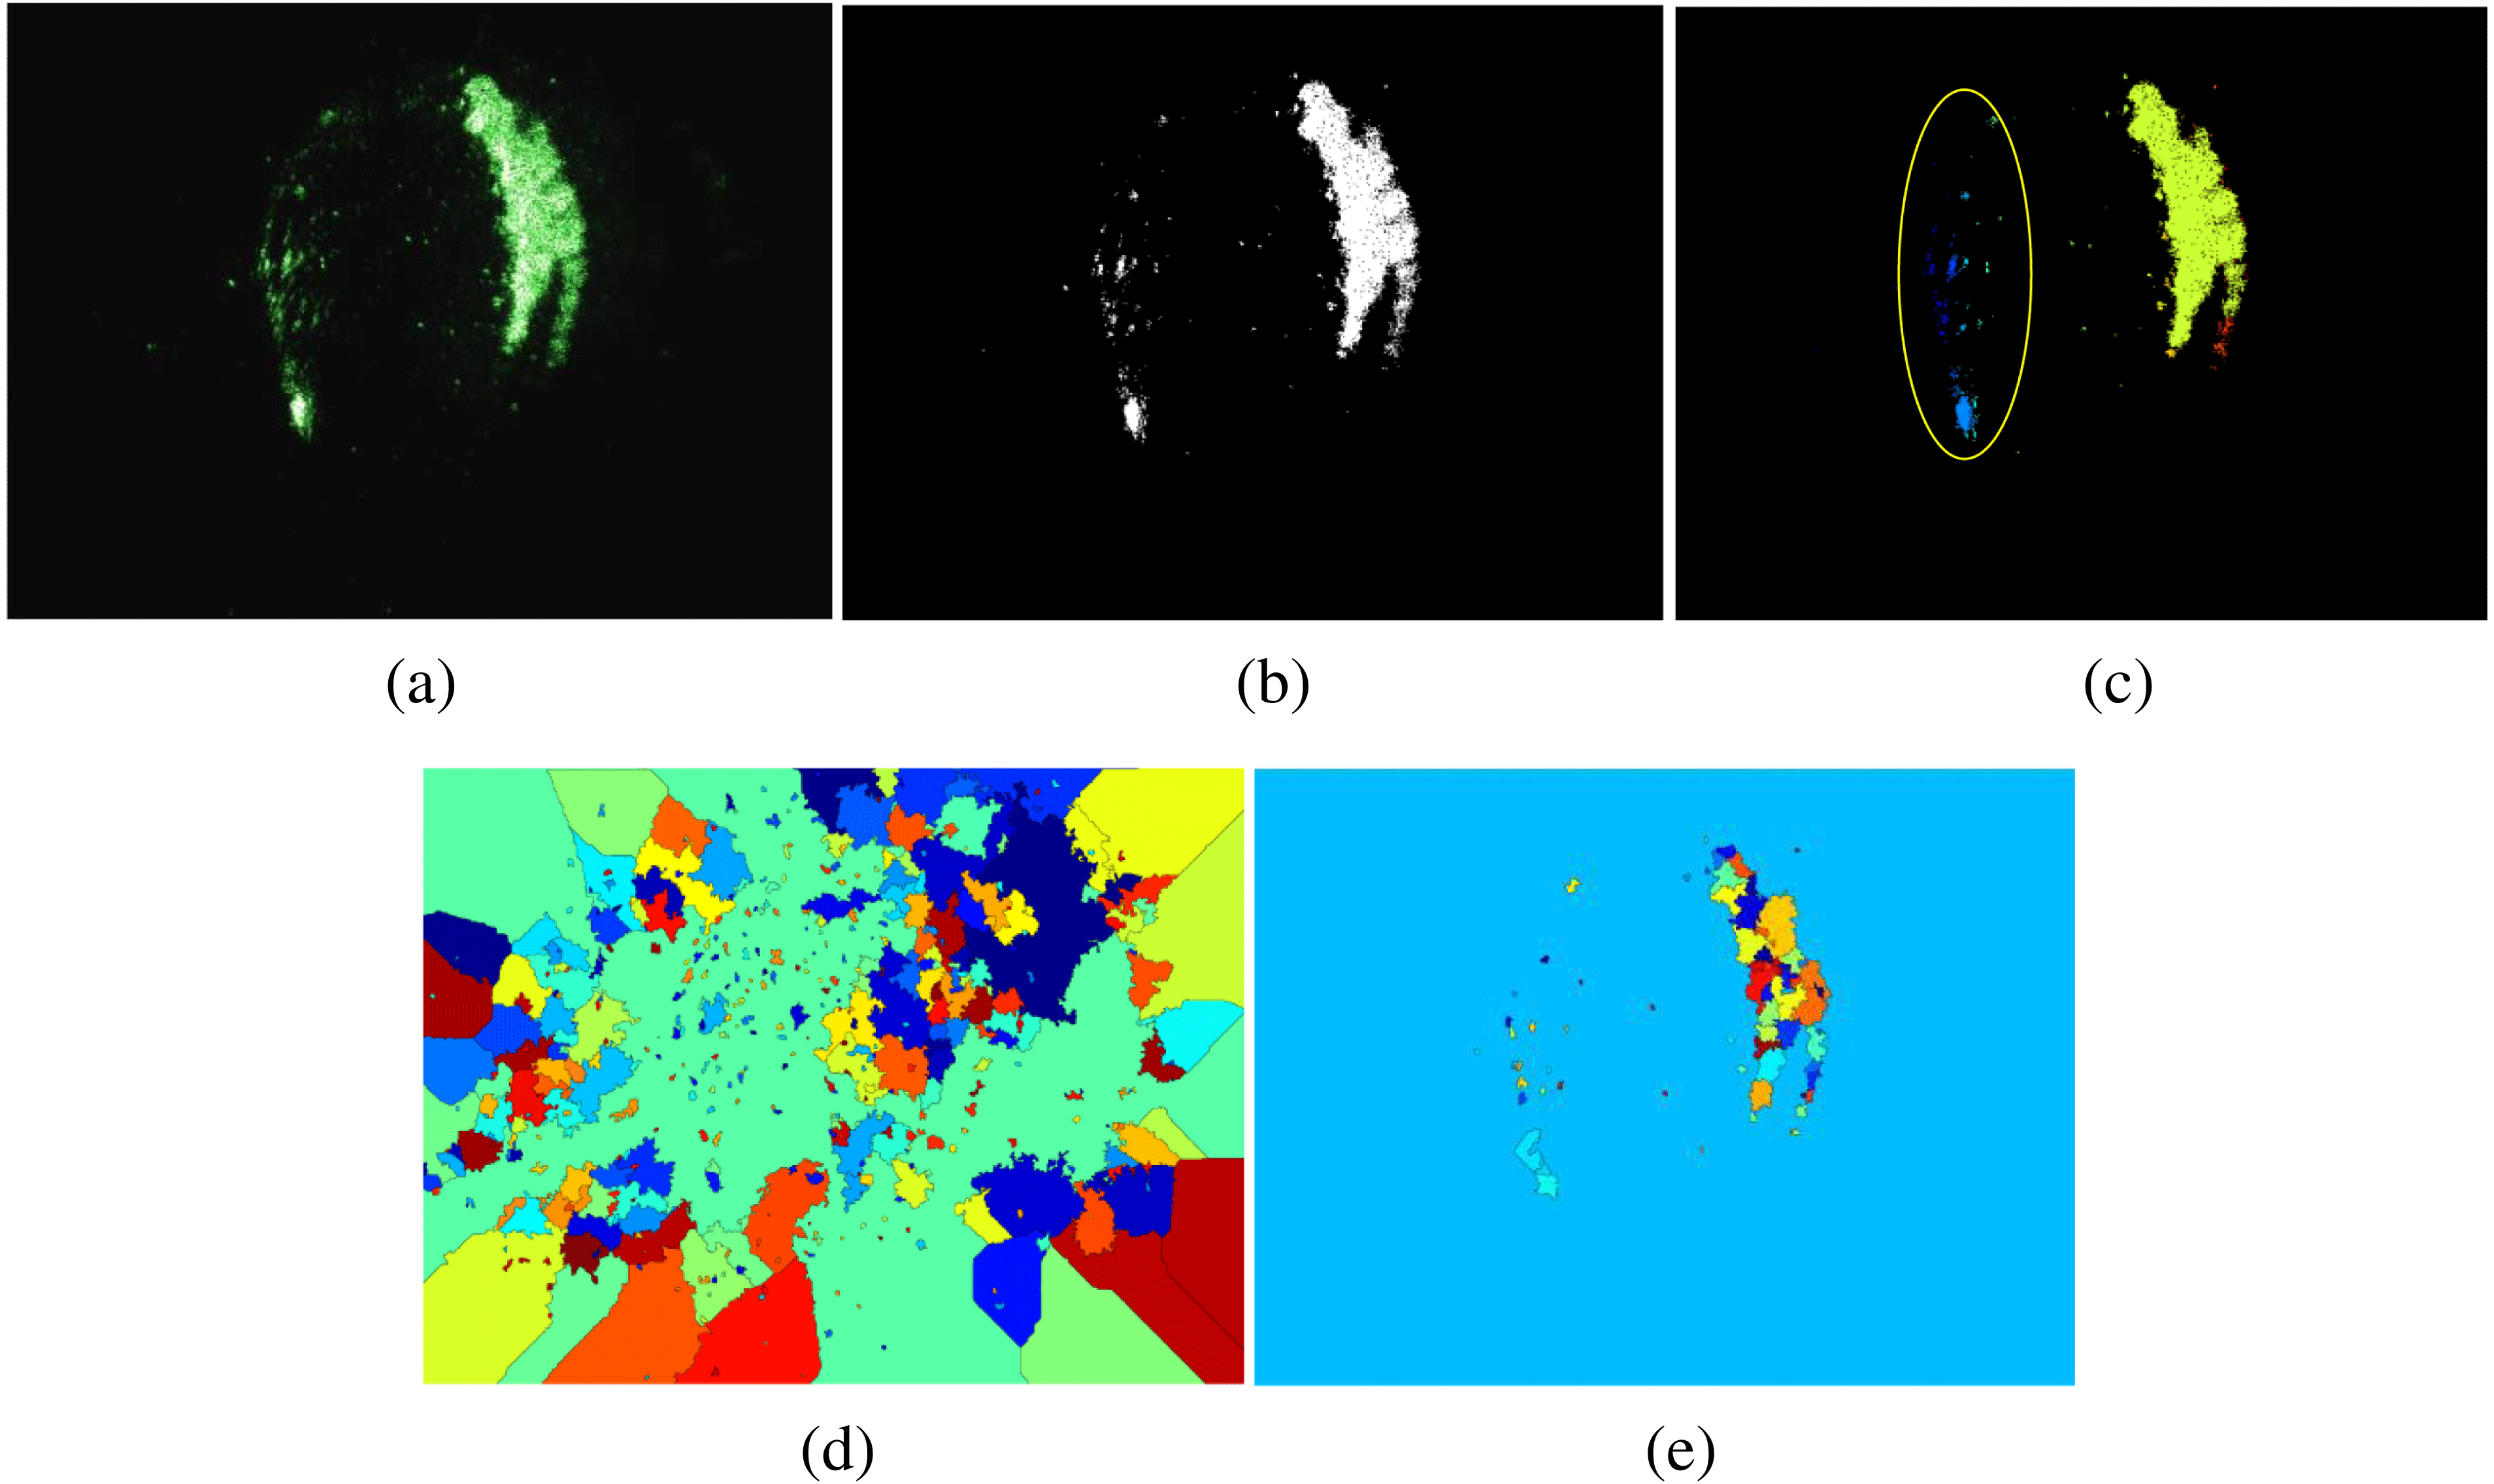
Figure 2. Results of image segmentation. (a) Original damage image; (b) by image binarization; (c) by threshold segmentation; (d) by marker-based watershed algorithm without gray control; (e) by MWGC.
Table 1 shows a comparison between the diameters  $d_{1}$ of damage site areas extracted using the MWGC and the diameters
  $d_{2}$ measured using an optical microscope (OM) with
  $200\times $ magnification. The morphology of damage sites obtained by the OM is shown in Figure 3. The average absolute error
  $\langle d_{1}-d_{2}\rangle $ is 0.93
  $ \mu \mathrm{m}$, which is much less than the pixel size (as shown in Table 2). Also, the average relative error
  $\bigl \langle \frac {d_{1}}{d_{2}}-1\bigr \rangle $ is 2.8%, indicating that the sizes of damage sites extracted by the MWGC are believable. It is clear that the segmentation algorithm incorporating gray control is effective in processing the damage image produced by a large-aperture laser.
Table 2. Pixel Size Calibration for Different Damage Images.


Figure 3. Damage site morphology captured by OM.
3. Experimental set-up
The experimental set-up is shown schematically in Figure 4, and consists of modules for third-harmonic generation, laser parameter measurements, damage initiation, and image capture. A 1053 nm laser with a beam aperture of  $1.8 \times 1.8\, \mathrm{cm}^{2}$ exits from a four-pass amplifier, the pulse width of which is 3 ns, as shown in Figure 5. The 351 nm laser is generated through frequency conversion of 1053 nm laser using two KDP crystals. By sampling the laser output from KDP crystals, the laser parameters are measured. Next, fused silica samples are exposed to the laser transmitted through a focusing lens. The beam sizes on the damage samples are 0.56–0.86 cm and are achieved by adjusting the distance between the samples and the lens (1 and 1.5 m in focal lengths for Corning-7980 and Heraeus-Suprasil 312 samples, respectively). The laser energies and near-field energy density distribution are measured by the measurement set of laser parameters. Figure 6 shows the near-field energy density distribution at 351 nm with a beam contrast (peak to average) of 1.75. The damage images after each shot are observed by a microscope with a CCD. The microscope magnification is calibrated using Group 0-4 of a 1951USAF resolution test chart with 1.41 line pairs per millimeter. Subsequently, the pixel size of the damage image is calibrated as shown in Table 2.

Figure 4. Experimental set-up for laser-induced damage testing.

Figure 5. Temporal profile of a 3 ns pulse at 1053 nm.

Figure 6. (a) Near-field energy density distribution at 351 nm. (b) Profile along the line in (a).
In our experiments, Corning-7980 and Heraeus-Suprasil 312 (secondary cleanliness) samples with a size of  $50 \times 50 \times 8\, \mathrm{mm}^{3}$ were prepared to test the damage behavior and the average damage growth and damage site distribution were calculated to illustrate the damage properties of the optical surface.
4. Results and discussion
4.1. Damage growth coefficients
Damage tests at 351 nm are carried out to analyze the damage growth and damage site distributions on Corning-7980 and Heraeus-Suprasil 312 (secondary cleanliness) samples. For successive laser shots, five damage sites are selected to calculate the damage growth coefficients for the two samples. The damage growths for different damage sites are exponential, as shown in Figure 7, which is in good agreement with the reported results[Reference Norton, Hrubesh, Wu, Donohue, Feit, Kozlowski, Milan, Neeb, Molander, Rubenchik, Sell and Wegner8, Reference Rubenchik and Feit12]. Table 3 shows the damage growths for the two samples. The damage growth coefficients  $\alpha $ are
  $1.10 \pm 0.31$ with an average fitting goodness
  $R^{2}$ of 98.8% and
  $0.60\pm 0.09$ with an average fitting goodness
  $R^{2}$ of 97.3%, respectively.
Table 3. Damage growth for Corning-7980 and Heraeus-Suprasil 312 samples.
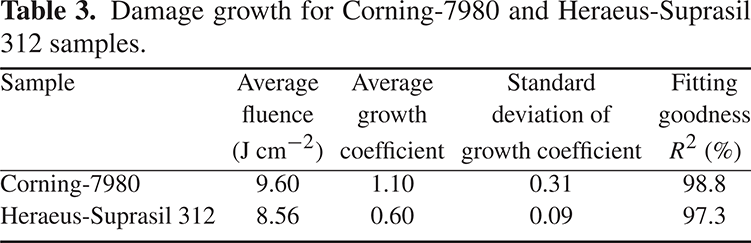

Figure 7. Damage growth of (a) Corning-7980 and (b) Heraeus-Suprasil 312 samples at 351 nm.

Figure 8. Damage site size distribution for the Corning-7980 sample at 351 nm.
As seen from Figure 7, the damage growth coefficients are distinctly different for the five tested sites in the same sample. The difference possibly results from the site morphologies tested and the local fluence. Numerous researchers[Reference Liao, Abdulla, Negres, Cross and Carr9, Reference Norton, Donohue, Hollingsworth, Feit, Rubenchik and Hackel13, Reference Demos, Staggs and Kozlowski18, Reference Negres, Cross and Carr19] have demonstrated that the complex damage growth process is affected not only by the various laser parameters but also the intrinsic structural features of the optical components. In general, there are various precursors on the optical surface that induce damage sites with different morphologies. Damage sites with different morphologies grow differently. Therefore, damage sites grow with different coefficients after subsequent laser shots.
Note that the standard deviation of the growth coefficient for the Heraeus-Suprasil 312 sample is smaller than that for the Corning-7980 sample. This can be explained by the cleanliness of the optical surface. Most fragile precursors are removed from the Heraeus-Suprasil 312 sample surface with secondary cleanliness treatment. The damage sites induced by residual precursors are possibly similar. It can be inferred that the error bar of the growth coefficient ( $\pm 0.09$) of Heraeus-Suprasil 312 is less than that of Corning-7980 (
 $\pm 0.31$).
4.2. Damage site distribution
Next, the damage site distributions are obtained after one laser shot, as shown in Figures 8 and 9. The number of damage sites decreased sharply with lateral damage site size. The average fluence of the 351 nm laser on Heraeus-Suprasil 312 sample is 22.60 J cm $^{-2}$, larger than that for the Corning-7980 sample (
 ${\sim } 11$ J cm
 $^{-2})$. Therefore, the number of large-size damage sites (area
  $ > 0.1\, \mathrm{mm}^{2})$ for Corning-7980 sample is less than that for the Heraeus-Suprasil 312 sample.

Figure 9. Damage site size distribution for the Heraeus-Suprasil 312 sample at 351 nm.
5. Conclusions
Based on a near-field laser beam combined with the MWGC, the damage behaviors of Corning-7980 and Heraeus-Suprasil 312 samples are investigated in terms of the damage growth and damage site size distribution. The near-field laser provides the required beam size and fluence necessary to create damage. The damage image processing algorithm can effectively suppress the over-segmentation of the damage image and obtain accurate size information for the damage sites. Using the damage test method described, the average damage growth coefficients and damage site size distribution for fused silica samples are obtained to illustrate the damage behavior of optical component surfaces. It indicates the damage test method is effective and beneficial for further studies into large-aperture laser-induced damage characteristics, which play a key role in the assessment of the damage resistance of optical components.


 Open access