


Introduction
Quality of life (QoL) has become an important health outcome measurement concept for understanding the effectiveness of treatment, evaluating service provision and informing resource allocation (Torrance, Reference Torrance1987; Aaronson, Reference Aaronson1988; Higginson and Carr, Reference Higginson and Carr2001). The World Health Organization (WHO) defines QoL as ‘individuals' perception of their position in life in the context of the culture and value systems in which they live and in relation to their goals, expectations, standards and concerns’ (Whoqol Group, 1995). Because of the subjective nature of QoL, it is generally assessed using self-report measures. Examples of well-known QoL measures include the World Health Organisation Quality of Life Scale (WHOQoL; Whoqol Group, 1995), the Medical Outcomes Study 36-item Short Form Survey (SF-36; Ware et al., Reference Ware, Kosinski and Keller1996), the EuroQoL (EQ-5D; EuroQol group, 1990) and the Assessment of Quality of Life (AQoL; Hawthorne et al., Reference Hawthorne, Richardson and Osborne1999). Unlike disease-specific scales, these generic QoL measures have the advantage of allowing comparisons between individuals with different health conditions.
As a framework that reflects individuals' satisfactions and preferences, QoL is well aligned with the holistic, client-centred principles that have guided international efforts to reform mental health care for young people. We know that young people with mental ill-health, especially internalising disorders such as mood disorders, have lower QoL than their peers (Weitkamp et al., Reference Weitkamp, Daniels, Romer and Wiegand-Grefe2013) and those with physical disorders (Sawyer et al., Reference Sawyer, Whaites, Rey, Hazell, Graetz and Baghurst2002). We also know that there is much heterogeneity in presentation, illness course, degree of complexity and outcome of youth mental illness (Hansell et al., Reference Hansell, Wright, Medland, Davenport, Wray, Martin and Hickie2012; Scott et al., Reference Scott, Leboyer, Hickie, Berk, Kapczinski, Frank, Kupfer and McGorry2013, Reference Scott, Davenport, Parker, Hermens, Lind, Medland, Wright, Martin, Gillespie and Hickie2018; Hickie et al., Reference Hickie, Scott, Cross, Iorfino, Davenport, Guastella, Naismith, Carpenter, Rohleder, Crouse, Hermens, Koethe, Markus Leweke, Tickell, Sawrikar and Scott2019). Symptom measures alone (e.g., measures of psychological distress) are non-specific and may not provide the clinician with meaningful information on how to improve holistic care for the young person. Subjective perception of health status across multiple domains as assessed by QoL measures, can be used to optimise an individual's treatment (Ravens-Sieberer et al., Reference Ravens-Sieberer, Karow, Barthel and Klasen2014). Clinicians can then work to address domains of concern for the individual, providing more targeted or personalised approaches to care (e.g., improving housing where the person has indicated dissatisfaction). However, the extent to which QoL data can be used to better understand complexity in youth mental illness and tailor appropriate treatments and allocation of clinical resources is underexplored.
QoL has long been recognised as a multidimensional construct (Aaronson, Reference Aaronson1988), falling into four major categories of physical, social, functional and mental health (Aaronson, Reference Aaronson1988; Bullinger and Quitmann, Reference Bullinger and Quitmann2014). However, in most contexts, a single number has been used to denote a person's QoL on the questionnaire. This could be a simple addition of a person's answers on the scale (e.g., an overall global score) or for some generic QoL measures, a preference-weighted utility score. The problem with single number scores is that meaningful information pertaining to individuals' QoL is lost and inter-individual variability is ignored (Kelly et al., Reference Kelly, Robinson, Baker, Deane, Osborne, Hudson and Hides2018). Single number scores only provide information on whether overall QoL is compromised, but will not yield information regarding which dimension(s) of QoL are impacted and where an individual may need extra support.
Traditional statistical models, such as linear regression, using global or utility scores as the outcome, often fail to reveal underlying heterogeneity in the population. Latent class analysis (LCA), on the other hand, is an unsupervised machine learning analytical technique that uses a top-down approach to capture inter-individual variability to identify latent groups based on observed data (Berlin et al., Reference Berlin, Williams and Parra2014). In psychiatric research, LCA has frequently been applied to determine clinical (Ulbricht et al., Reference Ulbricht, Chrysanthopoulou, Levin and Lapane2018) and behavioural (Klonsky and Olino, Reference Klonsky and Olino2008; Foerster and Röösli, Reference Foerster and Röösli2017) groups, and more recently to understand heterogeneity in QoL among cohorts of people with substance use disorders (De Maeyer et al., Reference De Maeyer, van Nieuwenhuizen, Bongers, Broekaert and Vanderplasschen2013; Kelly et al., Reference Kelly, Robinson, Baker, Deane, Osborne, Hudson and Hides2018). Using these models, it is possible to capture heterogeneity not only in QoL, but to also identify new treatment targets for specific clinical subgroups (e.g., those with low QoL); this moves beyond the notion that the ‘one size fits all’ approach to treatment (Kelly et al., Reference Kelly, Robinson, Baker, Deane, Osborne, Hudson and Hides2018).
Although LCA and other clustering analyses have been widely used to understand the heterogeneity of specific disorders (Liao et al., Reference Liao, Allott, Anderson, Killackey and Cotton2022), they have rarely been used in general help-seeking clinical populations. Exploring the heterogeneity using QoL in a general help-seeking population, can offer substantial insight into the overall complexity of their social, mental and well-being profiles. This additional information can assist with better funding and resourcing allocation that extend beyond the severity of clinical symptoms. To our knowledge, LCA models have never been applied to understand heterogeneity and complexity in young people seeking help for more common mental health disorders such as depression and anxiety. In general, research is scant on QoL in this population, and hence, we will extend the research in this area.
The overall purpose of this study is to better understand heterogeneity in the QoL of young people at their first presentation to a primary mental health service. Specifically, we aimed to determine: (i) whether distinct and clinically meaningful subgroups of help-seeking young people can be identified based on responses to individual items on the adolescent version of the AQoL-6D using LCA; and (ii) whether and how these groups could be meaningfully discriminated based on demographic and clinical characteristics.
Method
Study design
This study was part of a larger study aiming to develop better patient-reported outcome measurement for young people seeking early intervention and treatments for mental ill-health (Filia et al., Reference Filia, Rickwood, Menssink, Gao, Hetrick, Parker, Hamilton, Hickie, Herrman, Telford, Sharmin, McGorry and Cotton2021). Institutional ethics approval was obtained from the University of Melbourne Human Research Ethics Committee (1645367.1). Written informed consent was obtained from each young person, and if they were under 18 years, parental/guardian consent was obtained.
Sample and setting
Young people (aged 12–25 years) were recruited at their first appointment for mental health or substance use related issues in five headspace centres across Australia (three metropolitan and two regional). headspace is a non-profit organisation established by the Australian Government in 2006, providing accessible, youth-friendly and client-centred primary mental health care to young people aged 12–25 years (McGorry et al., Reference McGorry, Trethowan and Rickwood2019; Rickwood et al., Reference Rickwood, Paraskakis, Quin, Hobbs, Ryall, Trethowan and McGorry2019). Recruitment occurred from September 2016 to April 2018. Data were collected at service entry as well as three-month follow-up.
Measures
The larger study comprised a total of 18 measures (Filia et al., Reference Filia, Rickwood, Menssink, Gao, Hetrick, Parker, Hamilton, Hickie, Herrman, Telford, Sharmin, McGorry and Cotton2021); here we highlight the measures that were pertinent to the current study.
Self-report measures
Quality of life
QoL was assessed using the adolescent version of Assessment of Quality of Life – 6 dimensions, AQoL-6D (Richardson et al., Reference Richardson, Peacock, Hawthorne, Iezzi, Elsworth and Day2012). This measure contains 20 items (measured on variable scales with different anchors) in six dimensions, including independent living (4-items; household tasks, mobility outside the home, walking, self-care), social and family relationships (3-items; friendships, family and community role), mental health (4-items; feelings of despair, worry, sadness, tranquillity/agitation), coping (3-items; covering enough energy, being in control, coping with problems), pain (3-items; frequency of pain, severity of pain, degree pain interferes with normal activities) and senses (3-items; seeing, hearing and communication). An example item is ‘How happy are you with your close and intimate relationships?’. This item has five possible response choices ranging from 1 ‘very happy’ to 5 ‘very unhappy’ (unweighted rating). For each dimension, an unweighted total score can be derived by summing individual items, with higher scores depicting poorer QoL. The standardised dimension score for each dimension was calculated as the reverse min and max scaled unweighted total score with 0 being the ‘worst health state’ and 100 the ‘best health state’ on each dimension. Total utility scores were estimated using the published algorithm which comprised individual item weightings for adolescents and ranged from 0 ‘poor QoL’ to 1 ‘good QoL’(Centre for Health Economics, 2014). In Australian adults, the AQoL-6D has been found to have appropriate levels of construct, concurrent and convergent validity (Allen et al., Reference Allen, Inder, Lewin, Attia and Kelly2013). Internal consistency as measured by Cronbach's α for most dimensions ranges from 0.73 (coping) to 0.86 (independent living), with lower values for relationships (α = 0.63) and senses (α = 0.50) dimensions (Allen et al., Reference Allen, Inder, Lewin, Attia and Kelly2013). In our study, the Cronbach's α values were comparable with the range of 0.73 (independent living) to 0.93 (pain); relationships and sense dimensions had Cronbach's α of 0.64 and 0.54, respectively.
Demographic variables
Demographic factors captured included age, sex (at birth), gender, sexual orientation, education and employment status. Lesbian, gay, bisexual, transgender, intersex and queer/questioning (LGBTIQ) status was derived from sex, gender identity and sexual orientation variables. Not in Education, Employment or Training (NEET) status was derived from items pertaining to current education and employment.
Clinical symptoms
Clinical symptomatology measurements included the: Patient Health Questionnaire for depression (PHQ-9, scores range from 0 to 27, with higher scores depicting greater symptoms severity) (Kroenke et al., Reference Kroenke, Spitzer and Williams2001; Kroenke and Spitzer, Reference Kroenke and Spitzer2002); Generalised Anxiety Disorder-7 item (GAD-7, scores range from 0 to 21, with higher scores indicating greater symptom severity) (Spitzer et al., Reference Spitzer, Kroenke, Williams and Lowe2006). Although the PHQ-9 and GAD-7 were developed for adults, they have been found to be psychometrically valid in young people (Richardson et al., Reference Richardson, McCauley, Grossman, McCarty, Richards, Russo, Rockhill and Katon2010; Mossman et al., Reference Mossman, Luft, Schroeder, Varney, Fleck, Barzman, Gilman, DelBello and Strawn2017). Other measures used in this study included the Suicidal Ideation Questionnaire – Junior (SIQ-JR, scores range from 0 to 90 with higher scores indicating worse ideation) for suicidal ideation (Reynolds, Reference Reynolds1987) and the Pittsburgh Sleep Quality Index (only self-rated questions scored with scores ranging from 0 to 21, higher scores indicate more problematic sleep) (Buysse et al., Reference Buysse, Reynold, Monk, Berman and Kupfer1989).
Clinician and interviewer ratings
Diagnoses were formulated by clinicians based on the Diagnostic and Statistical Manual of Mental Disorders – Fifth Edition (DSM5) (American Psychiatric Association, 2013). Research assistants extracted these diagnoses from medical files. The clinical staging model developed by McGorry et al. (Reference McGorry, Hickie, Yung, Pantelis and Jackson2006), was used to assess the severity and progression of participants' psychiatric symptoms. Research assistants rated the clinical stage on a scale from 0 to 4: increased risk without symptoms (stage 0); mild or non-specific symptoms (stage 1a); ultra-high risk (stage 1b); and full threshold or above (stages 2–4).
Statistical analyses
All statistical analyses were conducted in R version 4.0.3 (R Core Team, 2020). Detailed statistical methods and justifications are provided in the Supplementary Material and a summary is included below.
Distribution and structure of AQoL-6D items
Bar plots and histogram plots were used to visualise the distributions of unweighted individual items as well as standardised dimension scores. A multidimensional scaling (MDS) network plot (Jones et al., Reference Jones, Mair and McNally2018) was used to understand whether the individual items within a dimension were measuring the same latent construct depicted by that dimension. Based on polychoric correlation coefficients (rpc), this plot indicates that the closer the nodes (items), then the greater the degree of association between items.
Latent class analysis
LCA based on unweighted individual items (modelled with multinomial distribution) was used to empirically evaluate the possible heterogeneous groups. To improve model stability, 10-fold cross-validation (CV), leave-one-site-out (LOSO) CV and split-half CV were used to identify the best number of classes instead of the traditional log-likelihood ratio test (Payne et al., Reference Payne, Telford, Blackford, Blundell, Booth, Charman, Lamentowicz, Lamentowicz, Mitchell, Potts, Swindles, Warner and Woodland2011; Grimm et al., Reference Grimm, Mazza and Davoudzadeh2017), see Supplementary Material. Bayesian information criterion (BIC) was used as the main fitting index for choosing class numbers (Nylund et al., Reference Nylund, Asparouhov and Muthén2007) with Akaike information criteria (AIC) and log-likelihood guiding interpretation. Sensitivity analyses were conducted using k-means clustering based on principal components.
Profiles of latent classes
To validate class differences, we first compared the distribution of AQoL-6D standardised dimension and total utility scores. Descriptive statistics were used to compare differences in risk factors between classes. Risk factors that could explain observed heterogeneity were identified from the study's wider assessment battery and included demographic variables, diagnosis, clinical staging, PHQ-9, GAD-7; SIQ-Jnr and PSQI. Multivariate multinomial logistic regression models were subsequently carried out to further validate LCA results (also known as the 3-step LCA method) and identify risk factors that could best predict class membership. Two separate models were used due to possible overlap between clinical diagnosis/severity and self-reported clinical symptoms (demographic variables, diagnosis and clinical staging included in the first model and the second model additionally included clinical symptoms). Relative risk ratios (RRR) are reported, which represent the risk of the outcome falling in one outcome group relative to the reference outcome group with an increase or presence of a given risk factor while controlling for the effect of other risk factors.
Results
Cohort characteristics
The cohort has previously been described elsewhere (Filia et al., Reference Filia, Rickwood, Menssink, Gao, Hetrick, Parker, Hamilton, Hickie, Herrman, Telford, Sharmin, McGorry and Cotton2021). The overall cohort comprised 1107 individuals; however, only 1067 had complete information from the AQoL-6D and were included in the analyses. The demographic and clinical characteristics of the 1067 can be found in Table 1. Briefly, the median age was 18 (IQR [16–20]), 65% of the cohort were female, and 63% were attending a headspace service in a metropolitan region. The most common diagnosis was depression and anxiety (33%) followed by only anxiety (26%).
Table 1. Demographic and clinical characteristics of participants by the four identified latent classes
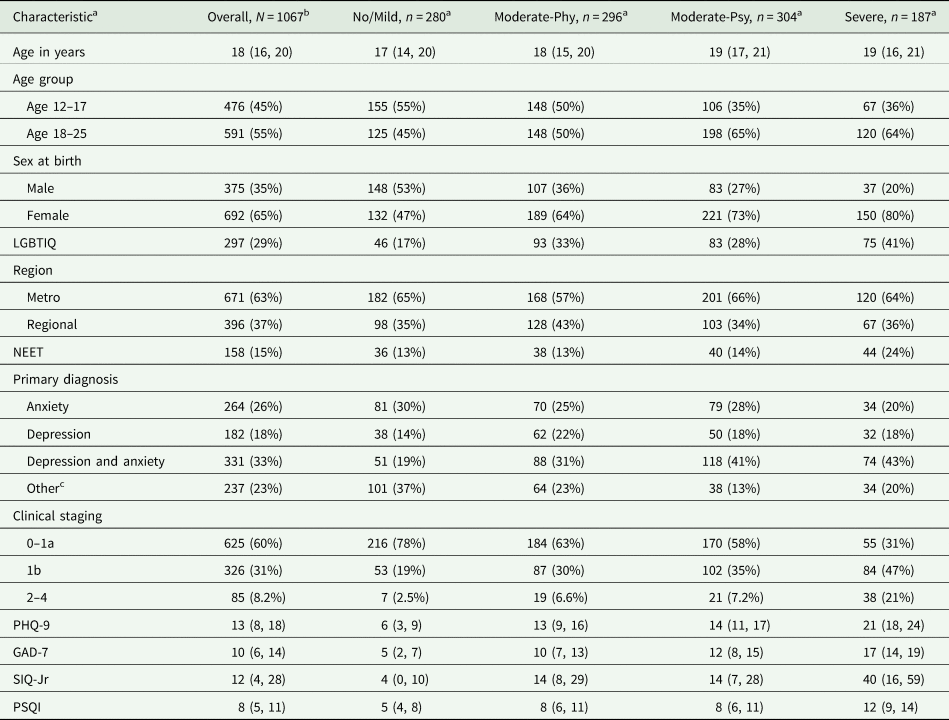
a Missing data include 42 for LGBTIQ, 32 for NEET, 53 for primary diagnosis, 31 for clinical staging, 4 for PHQ-9, 6 for GAD-7, 6 for SIQ-Jr and 48 for PSQI.
b Statistics presented: Median (IQR); n (%).
c Other diagnoses.
Profile of quality of life in the cohort
Distributions of individual AQoL-6D items are displayed in online Supplementary Fig. A1 (Supplementary Materials). Poorer QoL (higher scores) can be observed for many of the items, in particular for individual items pertaining to mental health and coping. For coping and mental health dimensions (based on standardised scores of 0 ‘worst QoL’ to 100 ‘best QoL’) distributions were relatively normal and average scores in these dimensions indicated greater levels of impairment compared to the other four dimensions (see online Supplementary Fig. A2).
The inter-item rpc correlation matrix is shown in online Supplementary Fig. A3. Correlations ranged from 0.06 (between Q5 ‘How happy do your close relationships make you?’ and Q18 ‘How good is your vision?’) to 0.83 (between Q16 ‘How much physical pain or discomfort do you experience?’ and Q17 ‘How does pain interfere with your usual activities?’). Figure 1 is the network plot of pairwise rpc inter-item correlations; all items were positively associated with each other. Clusters of items are apparent for most dimensions (higher internal correlations).

Fig. 1. Polychoric Correlation (Rpc) Network of AQoL-6D Items.
Latent class analysis
A range of models was run from the training data (10-sets for 10-fold CV and 5-sets for LOSO CV), see fitting indices in online Supplementary Figs A4 and A5. CV results indicate that the model with four latent classes was the best fitting model. BIC was lowest at 4-class model and AIC and log-likelihood also show an elbow point at 4-class model, suggesting little improvement in model fitting with increasing class numbers. Therefore, a 4-class model was chosen to be the best model and was then fitted in the total cohort. Both split-half CV and k-means clustering further validated the identified classes (results not shown).
Profile of latent class memberships
Class differences on standardised dimension scores and total utility scores can be found in Figs 2A and 2B and in online Supplementary Table A1. The first latent class, ‘No/Mild’, had no to very mild impairments in QoL, and higher ratings across QoL dimensions. The second and third classes were similar in independent living, relationships and sense, but one group showed higher impairment in pain and the other in mental health and coping dimensions. Hence, we named these groups ‘Moderate-Phy’ and ‘Moderate-Psy’. The last identified latent class, labelled as ‘Severe’, showed greater levels of impairment in QoL across all dimensions compared with other groups. The mean utility score of the ‘Severe’ group was only 0.25 (s.d. = 0.10), compared with a mean of 0.87 (s.d. = 0.10) in the ‘No/Mild’ group, which had values commensurate to the population norms (Maxwell et al., Reference Maxwell, Özmen, Iezzi and Richardson2016). The mean utility score of the ‘Moderate-Phy’ group was slightly lower than the ‘Moderate-Psy’ group, 0.54 (s.d. = 0.14) vs. 0.59 (s.d. = 0.12).

Fig. 2. Distributions of the (A) Standardised AQoL-6D Dimension Scores (B) Total Utility Scores by Identified Latent Class Membership.
Table 1 depicts the demographic, social and clinical profiles of four classes. Compared with other groups, the ‘Severe’ group represented the most severe or complex subgroup, and included more participants who were older, female, LGBTIQ, with NEET status, with a diagnosis of, and more severe, anxiety and depression, as well as a clinical staging of ultra-high risk (stage 1b) or a full-threshold diagnosed psychiatric disorder (stages 2–4). This group also had poorer sleep and more suicidal thoughts (SIQ-JR Mdn = 40 compared with Mdn = 4 in the ‘No/Mild’ group).
The ‘Moderate-Phy’ and ‘Moderate-Psy’ groups were largely comparable; however, the ‘Moderate-Phy’ group had a higher proportion of young people aged between 12 and 17 years, belonging to the LGBTIQ community, and with a primary diagnosis other than anxiety and/or depression. The Moderate-Phy group comprised individuals with provisional diagnoses (n = 30) and disorders including personality (n = 26), adjustment (n = 24), substance use (n = 17), behavioural (n = 17), psychosis (n = 4) and other (i.e., developmental disorders, n = 119). Those in the ‘Moderate-Psy’ group were more likely to be female, and had more severe depression and anxiety.
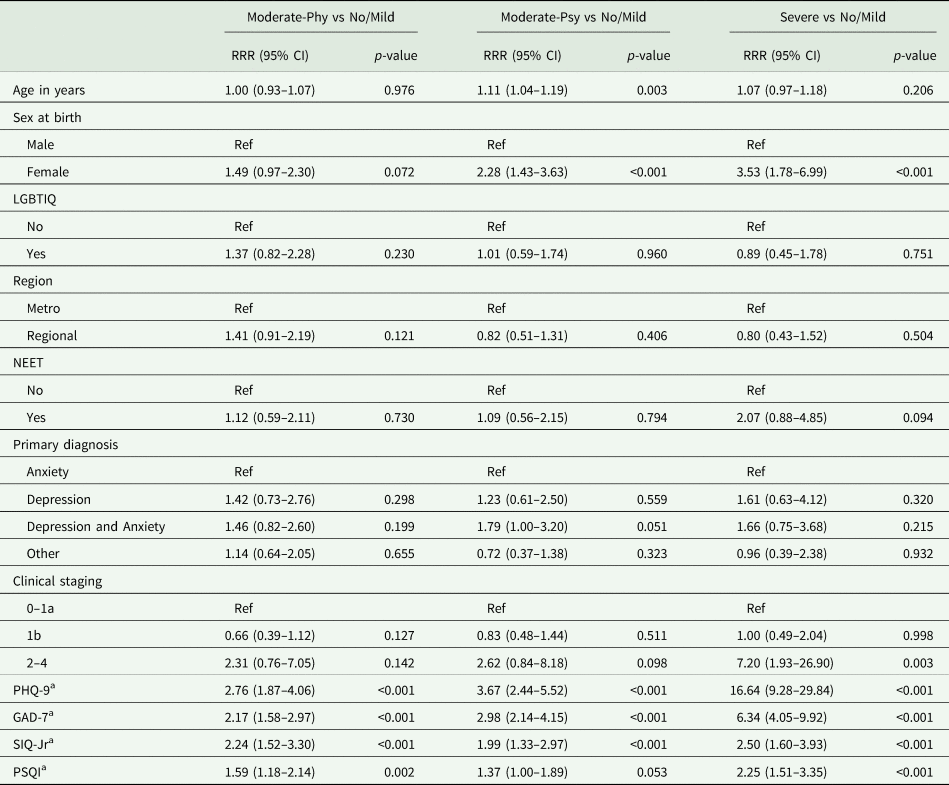
Results from the first multinomial multivariate logistic regression model (without self-reported symptoms) are displayed in Table 2. The vast majority of the univariate associations were also retained in the multivariate model. A trend of increasing severity and complexity was observed from the ‘No/Mild’ to the ‘Severe’ group. The relative risk for being in the full-threshold staging (2–4) relative to stages of increased risk and without specific symptoms (0–1a) was estimated over 14 (RRR: 14.56; 95% CI: 5.80–36.53) times higher in the ‘Severe’ group versus the ‘No/Mild’ group. When controlling for self-reported symptoms (shown in Table 3), the RR was still over 7 times higher compared with the ‘No/Mild’ group (RRR 7.20; 95% CI 1.93–26.90) and over 2 times higher compared with the ‘Moderate-Psy’ (RRR: 2.75; 95%CI: 1.16–6.49) and ‘Moderate-Phy’ group (RRR: 3.12, 95% CI: 1.25–7.78). The ‘Severe’ group had higher levels of clinical symptoms independently across multiple domains including depression, anxiety, suicidal thoughts and sleep quality. More severe self-reported clinical symptoms, particularly depressive symptoms, were found in both the ‘Moderate’ and ‘Severe’ groups relative to the ‘No/Mild’ group. Compared with the ‘Moderate-Phy’ group, the ‘Moderate-Psy’ group was older (RRR: 1.11 95%CI: 1.05–1.18), female (RRR: 1.53; 95% CI: 1.05–2.21), and have a higher level of depression (RRR: 1.33; 95%CI: 0.99–1.80) and anxiety (RRR:1.38; 95%CI: 1.08–1.75); whereas, the ‘Moderate-Phy’ group were more likely to be from regional areas (RRR: 1.73, 95%CI: 1.21–2.46).
Table 2. Multinomial logistic regression results (imputed)

*RRR represents relative risk ratio associated with one standard deviation change in the risk factor. All clinical variables were standardised. Age was not standardised. Standardisation was not needed for dummy variables. Cohort s.d.s are: 6.6 for PHQ-9; 5.7 for GAD-7; 20.3 for SIQ-JR; 3.8 for PSQI. The average prediction accuracy from imputed models is 0.413.
Table 3. Multinomial logistic regression results including clinical outcomes as risk factors (imputed)
a RRR represents relative risk ratio associated with one standard deviation change in the risk factor. All clinical variables were standardised. Age was not standardised, and standardisation was not needed for dummy variables Cohort s.d.s are: 6.6 for PHQ-9; 5.7 for GAD-7; 20.3 for SIQ-JR; 3.8 for PSQI. The average prediction accuracy from imputed models is 0.581.
Discussion
QoL is an important outcome from the perspective of young people and their families (Ravens-Sieberer et al., Reference Ravens-Sieberer, Karow, Barthel and Klasen2014). Not much is known about QoL in young people presenting to mental health services and QoL instruments are rarely routinely collected by these services. In this novel study, we investigated the heterogeneity in young people presenting to primary mental health care. Importantly, we identified four distinct groups of young people based on their responses to the AQoL-6D and these groups were externally validated based on demographic and clinical characteristics. The latent subgroups reflect varying levels of complexity (e.g., functioning, physical health) which would not necessarily be identified using clinical symptom measures such as psychological distress. Young people presented with heterogeneities in both the severity and types of impairments in QoL, which reflects their diverse needs in care type and intensity. This approach offers valuable holistic insights that have the potential to improve the targeting of primary mental health care services for young people with specific care needs.
The group with ‘No/Mild’ QoL impairments is likely to have distinct care and resource needs compared to the three other QoL groups. The ‘No/Mild’ group had health utility scores comparable with age-matched peers in the general population (Maxwell et al., Reference Maxwell, Özmen, Iezzi and Richardson2016). This group were younger (especially compared to those in the ‘Moderate-Psy’ group), more likely to be male, less likely to have a diagnosis of a mood and/or anxiety disorder, have less severe symptomatology and suicidal ideation, and to be in the early stages of illness course. Preventing worsening of symptoms and chronicity, managing comorbidities and minimising functional decline, would all be useful targets in preventing the decline of QoL in this group.
The ‘Severe’ group showed impaired QoL across all AQoL-6D dimensions with a mean utility score less than 30% of those reported by the ‘No/Mild’ group. This ‘Severe’ group seemed to have a complex presentation including both anxiety and depressive disorder diagnoses, more severe symptomatology, suicidal ideation and poorer sleep. Female sex and those with LGBTIQ status were over-represented in this group. Some of these factors could be considered risk factors for both poor QoL and mental health issues. For example, young people who identify as LGBTIQ often encounter distinct challenges in identity development and social acceptance (Brown et al., Reference Brown, Rice, Rickwood and Parker2016). Because of these issues, they are more likely to report poorer QoL (Charlton et al., Reference Charlton, Gordon, Reisner, Sarda, Samnaliev and Austin2018) and mental health (Higgins et al., Reference Higgins, Downes, Murphy, Sharek, Begley, McCann, Sheerin, Smyth, De Vries and Doyle2021). Their mental health problems are also likely to impact their QoL (Bosse, Reference Bosse2019). Mental health services need to understand such challenges in order to improve help-seeking and treatment engagement (Brown et al., Reference Brown, Rice, Rickwood and Parker2016).
We also defined two groups with moderate impairments in QoL. While the groups did not differ with respect to suicidality or sleep quality, the ‘Moderate-Psy’ group had higher levels of affective symptoms, and were more likely to be female than the ‘Moderate-Phy’ group. This might be due to affective and emotional problems being more commonly reported by females (Zahn-Waxler et al., Reference Zahn-Waxler, Shirtcliff and Marceau2008).
The ‘Moderate-Phy’ group are of particular interest. They were more likely to have received services from regional clinics, have other diagnoses and were more likely to report pain. There are a number of reasons as to why this may be the case. First, adolescence is a developmental period where somatic pain can manifest and predominate. In a large WHO-based study of pain in adolescents (up to 18 years of age), around 50% reported headaches and/or stomach pain and nearly 40% reported backache; 35.7% of young people experienced all three types of pain (Swain et al., Reference Swain, Henschke, Kamper, Gobina, Ottová-Jordan and Maher2014). Pain onset often precedes mental disorders, but it is expected the relationship is bidirectional (Slater et al., Reference Slater, Jordan, Chua, Schütze and Briggs2016). Pain, depression and anxiety can also have shared biological pathways (Simons et al., Reference Simons, Elman and Borsook2014). Second, young people in regional areas, might have concerns about confidentiality and stigma when accessing mental health services, and might present with physical rather than mental ill-health. Finally, finding that the two moderate groups did not differ in suicidality highlights the impact of pain on young people can be just as much as anxiety and depression. Further research, however, is needed to more closely look at the needs of these young people and how to best support them. There is a lack of developmentally-appropriate resources available to support this group and they may be missed in both primary health and mental health settings (Slater et al., Reference Slater, Jordan, Chua, Schütze and Briggs2016).
Most of the AQoL-6D dimensions seem to differentiate between the latent subgroups identified except for the sense domain on physical impairment in vision, hearing and communication. This is potentially explained by the lack of participation of physically disabled young people in the study. One may question where these young people receive support for mental ill-health and what barriers they may encounter in accessing services.
These findings have a number of important implications. First, young people with mental health issues have varied perceptions of their QoL. Third, these varied perceptions are associated with different demographic and clinical characteristics, and highlight varying degrees of complexity when young people first present to mental health services. Third, just obtaining information about symptoms or focusing on a total score on a QoL scale may mean that important aspects of a young person's life are missed, and such factors can be integral to treatment recovery. Finally, self-reported QoL measures can offer a cost-effective and subjective overview of an individual's life satisfaction across multiple domains and degrees of impairment. Having a young person complete such a measure, may be helpful for guiding focus in clinical assessments and alerting clinicians to potential risk factors that can be associated with poorer outcomes.
Broader implications
These findings have implications for service planners, clinical researchers and economic evaluators. Integrated youth health services, such as headspace, are a focus of mental health reforms in a number of countries and are typically designed to provide youth-friendly services for young people with mild-to-moderate or subthreshold symptoms; however, it has been noted that there is a growing frequency of young people with full-threshold diagnoses and complex presentations (Rickwood et al., Reference Rickwood, Telford, Parker, Tanti and McGorry2014). But symptoms and diagnoses are not the only features of complex presentations and QoL may help better tailor service responses within primary mental health care. Measures such as the AQoL-6D, may provide useful information about a young person's standing, over and above psychological indices such as the PHQ-9. For example, in mental health services, information about physical health and/or experiences of pain are not routinely collected, and poorer physical QoL might be an important contributor to the severity of the young person's depressive symptoms. Internalising disorders are often worse in adolescents experiencing pain than those not experiencing pain (Noel et al., Reference Noel, Groenewald, Beals-Erickson, Gebert and Palermo2016). Pain, however, can often go under recognised or misdiagnosed in young people (Friedrichsdorf et al., Reference Friedrichsdorf, Giordano, Desai Dakoji, Warmuth, Daughtry and Schulz2016). Resourcing clinicians in how to assess for, and manage pain in young people presenting to mental health services should be considered.
Our findings also have a number of implications for those undertaking or interpreting economic studies in primary youth mental health care. Notably, we have shown it is possible to identify groups who are likely to have very different patterns of costs and benefits. As the ‘No/Mild’ group has equivalent health utility scores to population norms, the scope for health utility gain is small, and the cost-effectiveness of many interventions for this group (who are younger and at earlier clinical stages) may depend on averting future ill-health and arresting illness progression. By contrast, the utility loss in the ‘Severe’ group is substantial and the older age, increased likelihood of being disengaged from work and study, and heightened suicide risk suggest that productivity loss in this group may also be high. Interventions that are effective at addressing these issues may prove cost-effective even if relatively resource intensive. Finally, for some in the ‘Moderate-Phy’ group, a question worth exploring is whether mental and/or physical health interventions may be the most feasible and cost-effective options for achieving utility gain. In this respect, economic evaluations of the design of incentives to ensure adequate participation of general practitioners and potential for inclusion of physiotherapists in youth mental health clinics may be warranted. This suggests that economic researchers should evaluate primary youth mental health services as complex systems in which the cost-effectiveness of service delivery may vary across different client groups.
Limitations
A range of factors (e.g., sample size for the total cohort and for some of the classes such as ‘Severe’ group, local dependence, high dimensionality and rare outcome groups) may impact the integrity of the LCA models (Swanson et al., Reference Swanson, Lindenberg, Bauer and Crosby2012). CV methods applied in the study only assert the validity within the study sample, and future external validation is needed to identify whether findings can be replicated in other independent samples.
Future research
There are a lot of scopes to extend this novel work. Given QoL measures differ in dimensionality, it would be interesting to see whether the latent classes using the AQoL-6D can be validated using other QoL scales. There have been other studies that have used measures such as the Eurohis-QoL (EQoL) (Kelly et al., Reference Kelly, Robinson, Baker, Deane, Osborne, Hudson and Hides2018) and the WHOQoL (Liao et al., Reference Liao, Allott, Anderson, Killackey and Cotton2022) in other populations (substance use and first-episode psychosis, respectively) who have found only three clusters. Do the latent classes differ according to the items covered by the QoL scale and the population under examination?
The current study was an important first step in understanding heterogeneity in QoL in young people with mental health issues; however, the focus was on cross-sectional data. To extend this work it would be of interest to determine the temporal stability of these groups over time. To add weight to the clinical meaningfulness of these groups, it would be also worthwhile to determine whether these groups differ in the trajectory of symptoms and functioning over the course of treatment, and the level of young people's treatment engagement using contemporary modelling techniques. For example, as an extension to latent class models, the Hidden Markov modelling technique (Rabiner and Juang, Reference Rabiner and Juang1986), can be used to evaluate whether and how individuals transit between these severity groups in longitudinal settings and evaluate risk factors associated with recovery in QoL.
Conclusions
We have shown that it is possible to identify meaningful groups of young people seeking help for mental ill-health based on their QoL. As a standardised measure to add value to direct a holistic biopsychosocial assessment, adding multi-attribute utility instruments such as the AQoL-6D to routine data collection in mental health services has the potential to generate insights that may improve the provision and targeting of care for young people. In young people with impairments across all QoL dimensions, the need for a holistic and personalised approach to treatment and recovery is particularly important.
Supplementary material
The supplementary material for this article can be found at https://doi.org/10.1017/S2045796022000427
Acknowledgements
We thank Dr Sharnel Perera for her contributions in many aspects of the project and the team of research assistants involved in collecting the data. We thank the headspace centre staff and young people whose participation made this study possible.
Author contribution
SMC conceived the focus of the manuscript and worked closely with MH and CG to refine the paper. SMC led the writing of the manuscript. CG conducted the statistical analyses and contributed to the writing of study findings. MH led the development of the supporting R package. KF, JMM, LE, CM provided comments and feedback on earlier versions of the paper. All other authors provided comments on later versions of the final version of the paper. All authors approved the final version of the paper.
Financial support
The study was supported by a National Health and Medical Research Council (NHMRC) Partnership Grant (APP1076940). This was a joint project between Orygen, The University of Melbourne and headspace National Youth Mental Health Foundation. SC is supported by a NHMRC Senior Research Fellowship (APP1136344).
Conflict of interest
The authors have no conflicts to declare.
Availability of data and materials
The datasets used in the current study are available from the corresponding author on reasonable request. A synthetically generated dataset and a R package developed for future use of our analytical method are available on the GitHub repository: https://ready4-dev.github.io/heterodox/


 Open access