


1. Introduction
The Chesapeake Bay watershed (CBW) is home to over 18 million people (Chesapeake Bay Program, 2019b) and supports significant economic activities (e.g., agricultural, industrial, and municipal). These activities negatively affect the Chesapeake Bay’s water quality (Wainger et al., Reference Wainger, Van Houtven, Loomis, Messer, Beach and Deerhake2013), where signs of major water quality degradation began in the 1950s after a population boom (Chesapeake Bay Program, 2019b). Since then, multiple strategies have been implemented to improve the Bay’s health, focusing specifically on mitigating nutrients from agriculture.
One strategy is the implementation of riparian buffers, where current research supports their use as a best management practice (BMP). Research has found that riparian buffers improve water quality by reducing sediment and nutrient (nitrogen/phosphorus) runoff from croplands (Bonham, Bosch, and Pease, Reference Bonham, Bosch and Pease2006). The central way to establish riparian buffers on agricultural land is through cost-share programs, such as the Conservation Reserve Enhancement Program (CREP), which provides financial incentives and cost-share payments to farmers for their establishment and maintenance. On the state level, Maryland CREP also aims to improve water quality and provides financial support to agricultural owners (i.e. producers) to convert a parcel of agricultural land to a riparian buffer (e.g., forest or grassed streamside) for a 10- to 15-year period (Maryland Department of Natural Resources, 2019a).
In 1997, Maryland became the first state to participate in CREP and pledged to install 100,000 acres of riparian buffers through the program to reduce 11 million pounds of nitrogen, 1.1 million pounds of phosphorus, and 200,000 tons of sediment annually to achieve water quality goals in the Chesapeake Bay (Maryland Department of Agriculture, 2019a). Almost half of the counties in Maryland have buffered, or partially buffered, 85% of their streams. In Allegany and Washington counties in western Maryland, located within the Ridge and Valley (R&V) physiographic province of the Appalachian Mountains, about 75 and 41% of streams have been buffered over the last decade; about 25 acres of riparian buffers have been planted per year across the two counties (Winters, Reference Winters2018a, Reference Winters2018b). Counties with low percentages of buffered streams are one of the factors impeding Maryland from reaching the Chesapeake Bay total maximum daily load (TMDL) goals along with restoration of riparian buffers – about 67,000 acres are enrolled under MD CREP (Noto, Reference Noto2019) and only about 27,000 acres are covered with forest buffers as of 2019 (Maryland Department of Natural Resources, 2019b).
While federal and state agencies aim to increase riparian buffers, focus should also be on how to exploit funds most efficiently. For instance, BMP implementation should be prioritized in locations where they will function optimally and be the most cost efficient. Riparian buffer function varies spatially and temporarily throughout the CBW because it lies within six physiographic provinces (Lowrance et al., Reference Lowrance, Altier, Newbold, Schnabel, Groffman, Denver and Todd1997). Thus, buffer placement is an important issue throughout the CBW, especially in the Piedmont, R&V, and Appalachian Plateau physiographic provinces. Our research focuses on the R&V physiographic province because it has a complex hydrogeological system where little research of riparian buffer function has been conducted. Of those few studies, between 25 and 50% of nitrate reduction has been found (Lowrance et al., Reference Lowrance, Altier, Newbold, Schnabel, Groffman, Denver and Todd1997; Weller et al., Reference Weller, Baker and Jordan2011); yet this province makes up 32% of the CBW. Therefore, this paper aims to quantify the economic costs of potential nutrient reductions in streams from riparian buffers installed in the R&V portion of the CBW in western Maryland. The other objectives are to evaluate economic net gains to the landowners for riparian buffer installation and determine their cost-effectiveness to improve stream water quality. Cost savings could be achieved by targeting specific riparian buffer restoration practices based on nutrient mitigation. These objectives apply to water quality improvements in streams through the reduction of nitrogen and phosphorus from riparian buffer restoration on agricultural land. Estimating all potential environmental benefits of riparian buffers is not considered and beyond the scope of this study.
Few studies have conducted cost-effectiveness analyses on riparian buffer restoration. The economic analysis of establishing riparian buffers on agricultural land in different regions under CREP have been evaluated by Nakao et al. (Reference Nakao, Sohngen, Brown and Leeds1999) and Nakao and Sohngen (Reference Nakao and Sohngen2000), Lynch and Tjaden (Reference Lynch and Tjaden2000), Wossink and Osmond (Reference Wossink and Osmond2002), among others. A few recent studies have focused on buffer-water-related economic costs of nutrient mitigation (Bonham et al., Reference Bonham, Bosch and Pease2006; Kaufman et al., Reference Kaufman, Abler, Shortle, Harper, Hamlett and Feather2014; Shortle et al., Reference Shortle, Kaufman, Abler, Harper, Hamlett and Royer2013; Wieland et al., Reference Wieland, Parker, Gans and Martin2009). Bonham et al. (Reference Bonham, Bosch and Pease2006) assessed the compliance costs and reductions in phosphorus from implementing nutrient management and riparian buffers for the farm-specific scenario in agricultural watersheds. Wieland et al. (Reference Wieland, Parker, Gans and Martin2009) assessed cost estimates based on constructed and program costs and summarized cost efficiencies for nutrient mitigation BMPs, including cost estimates for riparian buffers of the Chesapeake Bay. Kaufman et al. (Reference Kaufman, Abler, Shortle, Harper, Hamlett and Feather2014) and Shortle et al. (Reference Shortle, Kaufman, Abler, Harper, Hamlett and Royer2013) investigated the economic impacts from reducing nutrient discharge through credit trading programs and estimated costs to agricultural producers of the Watershed Implementation Plans (WIPs) developed by states in the CBW. They estimated the annual marginal abatement cost of removing pollutants from implementing agricultural BMPs in Maryland with land retirement scenarios in the range from about $2.0 to less than $20.0 per pound of nitrogen and from about $14 to less than $100 per pound of phosphorus in 2010 dollars to achieve 90% of its total load reductions. However, buffers were not included in their cost analysis of nutrient reductions because of data limitations.
The recent cost-effectiveness studies that most relate to our study are Van Houtven et al. (Reference Van Houtven, Loomis, Baker, Beach and Casey2012), Wieland et al. (Reference Wieland, Parker, Gans and Martin2009), and Fleming et al. (Reference Fleming, Merritts and Walter2019). Wieland et al. (Reference Wieland, Parker, Gans and Martin2009) estimated cost-efficiencies of nitrogen reductions for buffers and other BMPs across provinces in Maryland based on annualized average costs of the practice comprised of establishment cost, incentives, rental payments, and technical efficiencies, along with nitrogen reductions from the CBW Model (CBWM, Phase 5). Van Houtven et al. (Reference Van Houtven, Loomis, Baker, Beach and Casey2012) estimated cost-effectiveness of nitrogen and phosphorus reduction in the Chesapeake Bay region based on annualized average costs of riparian forest and grass buffers comprised of CBM capital cost, operations and maintenance costs, opportunity cost, transaction cost, and nutrient reductions from the CBWM (Phase 5) under credit nutrient trading. Likewise, Fleming et al. (Reference Fleming, Merritts and Walter2019) estimated cost-effectiveness of BMPs, inclusive of riparian buffers in southern-central Pennsylvania based on annualized implementation costs comprising of establishment cost, maintenance cost, and opportunity cost, and nutrient abatement from the CBWM (Phase 6). We add to this literature by estimating cost of nutrient reductions from riparian buffers in western Maryland while calculating present value of annual total economic costs (private costs and government costs) spent on a riparian buffer and using annual reductions in nitrogen and phosphorus from the CBWM (Phase 6) and own synoptic studies in Allegany and Washington counties. Our cost data are drawn from localized sources utilizing county specific cost information and relevant load reductions at a spatial buffer-stream level.
Our paper contributes to the estimation of economic costs of reducing nutrients with riparian buffers and their cost-effectiveness in western Maryland. The importance of understanding the role of riparian buffers for improving water quality in R&V was a factor in determining the costs of nutrient reductions from buffers in western Maryland. We utilize data on nutrient mitigation from the CBWM and from two synoptic stream studies of riparian buffer function in western Maryland, which allows us to show interesting results such as certain buffers could mitigate more nitrogen or phosphorus than other buffers. Specifically, forest buffers are likely to reduce more nitrogen and phosphorus than grass buffers based on the CBWM data. However, grass buffers are likely to be more cost effective for reducing nitrogen, but less cost-effective for reducing phosphorus than forest buffers. Furthermore, based on data from our synoptic studies, we find that a mix of riparian forest buffers with natural forests could be the most cost-effective practice for reducing nitrogen for particular locations, resulting in a larger impact on water quality. Because we estimate the costs and gains of establishing buffers under CREP, we show that forest buffers provide greater financial gains to landowners than other buffers, while existing and newly planted forest buffers achieve higher nitrogen reductions. Therefore, significant cost savings for reducing nitrogen can be realized through spatial targeting of existing and newly planted forest buffers in western Maryland. These results could be relevant for policymakers and used by managers to calculate and compare costs for establishing different buffers and nutrient mitigations in the region while considering their cost-effectiveness with respect to nutrient reduction.
2. Study Region and Riparian Buffer Scenarios
2.1. Study Region
The study region is in western Maryland in the R&V physiographic province. Its geology comprises adamantine ridge capstones, including siliceous sandstone and conglomerates. The deeper bedrock and valley bottoms are limestone and shale that easily erode through chemical dissolution and fluvial processes (Fenneman, Reference Fenneman1938; Lowrance et al., Reference Lowrance, Altier, Newbold, Schnabel, Groffman, Denver and Todd1997). In some areas, extensive erosion has led to the formation of karst terrain, including a network of unmapped caverns and caves that enhances hydraulic conductivity and produces many springs and seeps (Grumet, Reference Grumet2019). Because of this unique mountainous terrain, only a few studies have estimated the function of riparian buffers (Husic et al., Reference Husic, Fox, Adams, Ford, Agouridis, Currens and Backus2019; Miller et al., Reference Miller, Denis, Ator and Brakebill1997; Schnabel et al., Reference Schnabel, Shaffer, Stout and Cornish1997; Weller, Baker, and Jordan, Reference Weller, Baker and Jordan2011) and, to our knowledge, none have estimated the cost of nutrient retention in this region. This study also uses data from our synoptic research on riparian buffers in two western Maryland counties, Allegany and Washington within the R&V. Figure 1 shows the location of Allegany and Washington counties and the spatial distribution of streams. The green areas represent agricultural land use, and the red lines indicate less than ten percent of tree canopy cover (buffer potential).
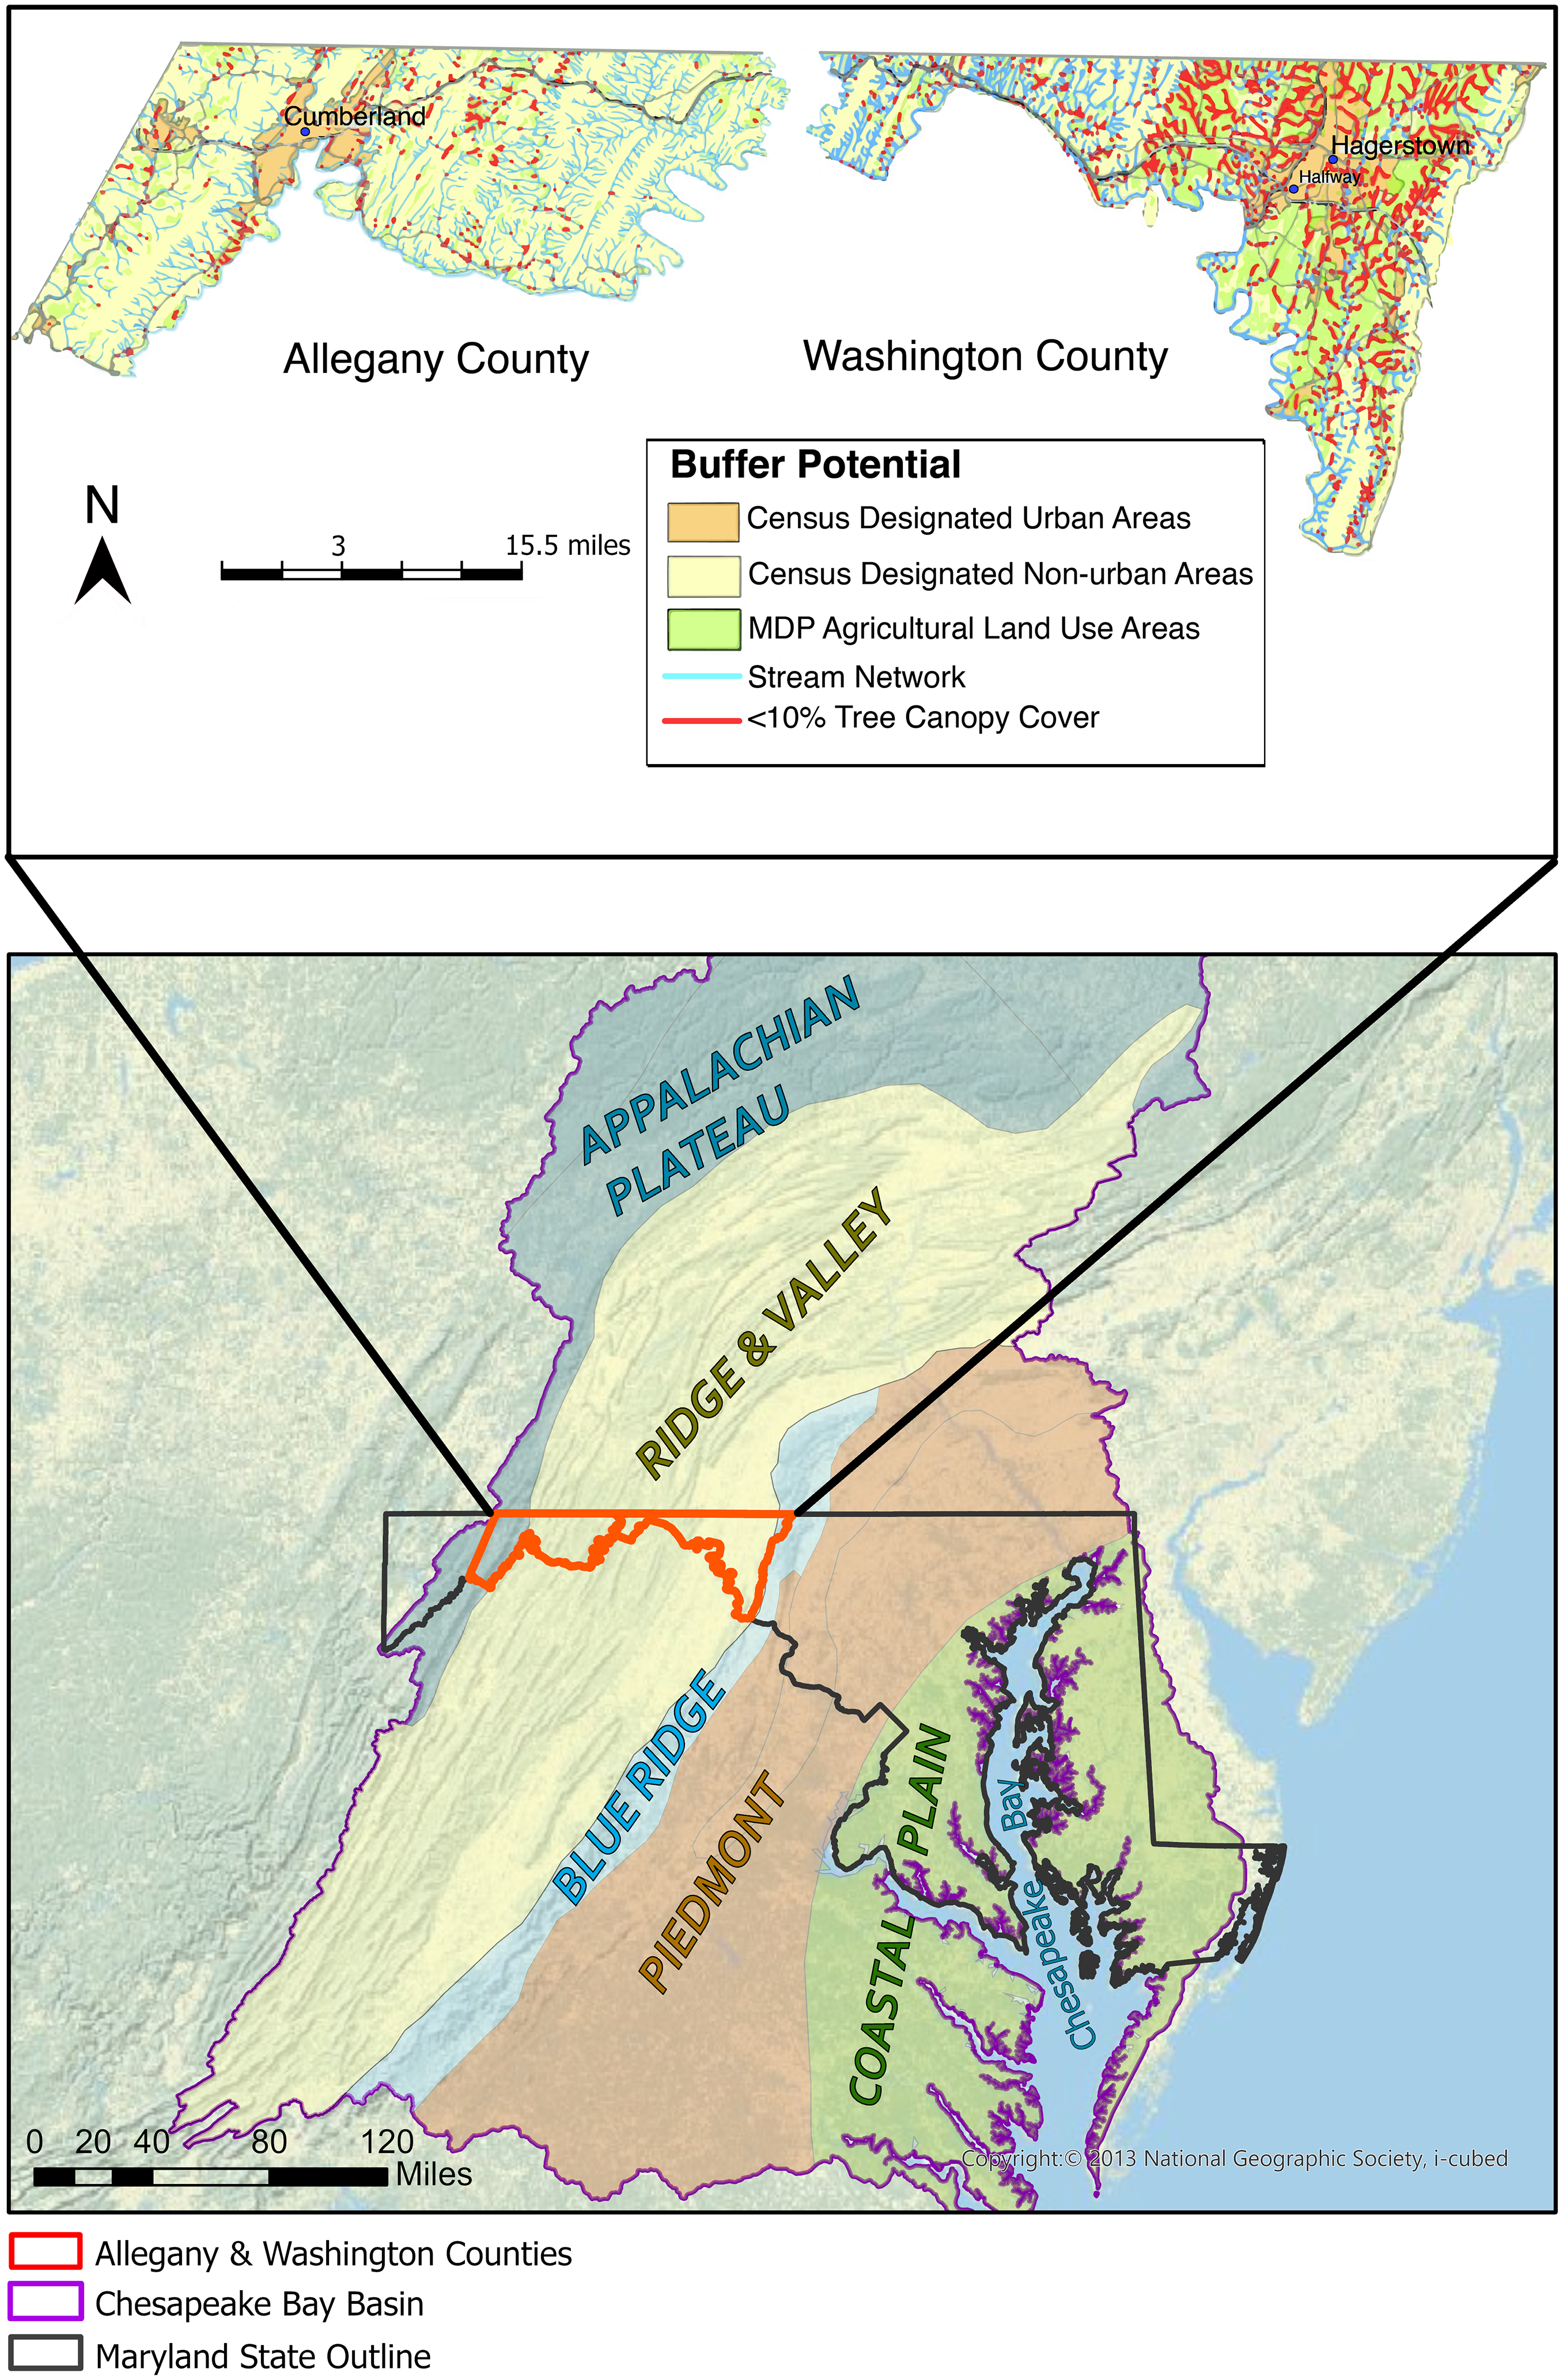
Figure 1. Distribution of riparian forest buffer locations along the streams in Allegany and Washington counties based on 2013/2014 high resolution landcover dataset from the Maryland Department of Natural Resources (reproduced using figures from Winters, Reference Winters2018a, Reference Winters2018b) and a general reference map of the counties’ locations and physiographic province (produced using National Geographic Society USA Topo basemap (2023)).
The potential agricultural area where riparian buffers could be established is estimated at 854 acres (∼70.5 stream miles) in Washington County and 188 acres (∼15.5 stream miles) in Allegany County (Table 1) (Winters, Reference Winters2018a, Reference Winters2018b).
Table 1. Riparian buffers in western Maryland*

Data from DNR (Winters, Reference Winters2018a, Reference Winters2018b); ND = no data
Notes:
* Western Maryland includes Allegany and Washington counties, as well as Garrett County within the Chesapeake Bay Watershed.
** Existing buffers refers to the areas extending 100 feet from each side of a stream segment that is at least 10% forested or covered by tree canopy based on one-meter resolution landcover data.
2.2. Riparian Buffer Scenarios and Nutrient Reduction
We use three different scenarios to perform an economic analysis on riparian buffer installation: (1) conversion of one acre of cropland to a streamside grass buffer, (2) conversion of one acre of cropland to a streamside riparian forest buffer, and (3) enhancing a riparian forest area by converting half an acre of cropland to a riparian forest buffer adjacent to half an acre of a preexisting natural forest, summing to a full one-acre riparian forest buffer. The riparian grass buffer scenario is modeled after the conservation practice (CP)-21 (i.e., grass filter strip) under CREP, where grass filter strips must be at least 10 feet wide next to a perennial or seasonal stream. The forest buffer scenario is modeled after CP-22 under CREP, where the width of the streamside forest is between 35 and 100 feet and borders a perennial or seasonal stream or a waterbody (Maryland Department of Agriculture, 2019b). The last scenario includes a combination of a planted riparian forest buffer next to a natural forest that is bordering a perennial or seasonal stream with a width of up to 35 feet. Since this incorporates natural mature and young forest augmented to plantings under CREP, from hereafter, it will be referred to as "existing forest buffer."
To analyze nutrient reductions by riparian buffers in the first two scenarios, we obtained the nitrogen and phosphorus reduction estimates from the CBWM-Phase 6. The data from CBWM represent average loads of nitrogen and phosphorus that are reduced by the implementation per unit or acre of BMP at the county level. We accounted for annual pounds of nitrogen and phosphorus reduced per acre for establishing grass or forest buffers in Allegany and Washington counties. The nutrient reductions represent typical amounts of nutrients reduced at the edge of the stream area, simulated through the Chesapeake Assessment Scenario Tool (CAST) (Chesapeake Bay Program, 2019a).
The CBWM simulates load reductions for different types of buffers and applies different efficiency of pollutants removed per BMP. The load reductions are considered for the converted land use from cropland to a riparian buffer. In circumstances where the riparian buffer protects an area larger than itself, one needs to adjust the simulated load reduction to account for the area protected from the riparian buffer. For example, according to the CBWM, nitrogen reduction for every one-acre of forest buffer of 30 feet is assumed to mitigate nutrients from two acres of upland and two acres of adjacent land (Chesapeake Bay Program, 2019a). Consequently, the nitrogen reduction from establishing a buffer was multiplied by a factor of four. For phosphorus reduction, the efficiency of a riparian buffer is twice the amount reported on agricultural land and was multiplied by a factor of two. These efficiency factors indicate buffers can effectively reduce nitrogen in surface and subsurface flows, but phosphorus retention is more dependent on sediment and surface flow (Simpson and Weammert, Reference Simpson and Weammert2009).
Synoptic studies were used to estimate load reductions for the existing forest buffer. Our experimental design included existing and newly planted riparian forest buffers, as we did find significant correlations when combining newly planted forest buffers with the older, established mature forests. Since the CBWM model does not provide nutrient reductions for existing buffers, we used our synoptic results, along with the CBWM estimates for forest and grass buffers in the studied region to estimate economic costs of potential nutrient reductions with riparian buffers under three scenarios. Nutrient reductions for establishing a riparian buffer in Allegany and Washington counties based on CBWM and synoptic data are shown in Table 2.
Table 2. Nutrient reduction loads

Note: *Estimates from Chesapeake Bay Watershed Model (CBWM, Phase 6) (Chesapeake Bay Program, 2019a) for total nitrogen (TN) and phosphorus (TP). The nutrient reductions represent typical pounds of nutrients reduced for each buffer at the edge of the stream in each county obtained from the Chesapeake Assessment Scenario Tool model as of 2018. **Nutrient reduction estimates from our synoptic studies. Data are combined from both Allegany and Washington counties. Nitrogen measurements include total dissolved nitrogen (TDN) only (Siemek, Reference Siemek2021). The ‘Existing Forest Buffer’ includes a ½ acre of existing riparian forest buffer and a ½ acre of planted forest buffer, summing to a one-acre riparian forest buffer.
According to the synoptic analysis results of the TDN load retention, the arithmetic mean of the distribution is much higher than the median value for TDN loads (
 $\overline{x}$
= 174 & median = 57.3 pounds/acre/year) and measured net discharge rates (
$\overline{x}$
= 174 & median = 57.3 pounds/acre/year) and measured net discharge rates (
 $\overline{x}$
= 5.5 & median = 1.4 feet/year), indicating that both distributions were right-skewed. Based on USGS stream gauge data, the median discharge rate is similar to the mean long-term runoff rate of Town Creek Watershed (1.3 feet/year), the watershed in which many of our study sites are located (U.S. Geological Survey, 2019). Using this comparison as validation, we utilized the median of the computed instantaneous TDN loads to represent annual riparian buffer nutrient reductions, as shown in Table 2. No significant results were found for the phosphorus species (i.e., orthophosphate (PO4-P) and total dissolved phosphorus (TDP). Additional information on the methodology of the synoptic study can be found in Online Appendix (S1) and Siemek (Reference Siemek2021).
$\overline{x}$
= 5.5 & median = 1.4 feet/year), indicating that both distributions were right-skewed. Based on USGS stream gauge data, the median discharge rate is similar to the mean long-term runoff rate of Town Creek Watershed (1.3 feet/year), the watershed in which many of our study sites are located (U.S. Geological Survey, 2019). Using this comparison as validation, we utilized the median of the computed instantaneous TDN loads to represent annual riparian buffer nutrient reductions, as shown in Table 2. No significant results were found for the phosphorus species (i.e., orthophosphate (PO4-P) and total dissolved phosphorus (TDP). Additional information on the methodology of the synoptic study can be found in Online Appendix (S1) and Siemek (Reference Siemek2021).
The overall prospective reduction of nutrients varies among buffer type and across counties (Table 2). The CBWM shows that each acre of grass buffer reduces 21.9 pounds of nitrogen per year in Allegany County and 31.1 pounds per year in Washington County. Similarly, each acre of forest buffer is likely to reduce 27.8 pounds of nitrogen per year in Allegany County and 38.8 pounds per year in Washington County. Grass buffers are estimated to retain 0.09 pounds of phosphorus per year in Allegany County, and 0.2 pounds per year in Washington County, while forest buffers are expected to reduce about 0.5 pounds of phosphorus per year in Allegany and Washington counties. These values from the model do not directly account for upgradient or adjacent land use to the buffer, but it does apply the efficiency proportionally to agricultural land uses in a land-river segment.
The synoptic studies imply that an acre of existing and planted forest buffer reduces nitrogen by about 57.3 pounds per year on average in Allegany and Washington counties (Siemek, Reference Siemek2021). Note, we did not find significant nutrient reductions from newly planted riparian forest buffers alone. The predicted reduction is estimated for both counties and includes total dissolved nitrogen (TDN) concentrations retained in groundwater only. The CBWM rates are based on surface and subsurface retention of nitrogen (total N), and their nutrient retention rates do not reflect the variability found across the landscape. Furthermore, there is little evidence of phosphorus retention based on our study results. However, our study was conducted during baseflow conditions and only tested soluble forms of P. The most common forms in cropland are bound to soil particles that are released during storm events (Liu et al., Reference Liu, Weller, Correll and Jordan2000), which we did not sample.
3. Economic Model
Following Freeman (Reference Freeman2003), let q represent the environmental resource (land, water, etc.) quality and S represent the set of government regulations designed to support the agricultural land conversion to a riparian buffer, such that q(S) represent the changes in q on S that affects the private decision-making. Because private response depends on the governmental regulation, R(S), the function of q is given as
 $$q=q[S, R\left(S\right)].$$
The private decision to convert land to a riparian buffer depends on private costs for establishing a conservation practice, C t (q) and producer benefits or gains, B t (q) received from the conservation program. The costs and benefits are flows of money over time t during the length of the contract, T. In some cases, a producer’s gains also include additional income from harvesting trees, hunting, and/or fishing, but these activities are not considered in this analysis.
The net present value (NPV) of net benefits to producers at time t can be expressed as
 $$NPV=\int _{0}^{T}\left[B_{t}\left(q\right)-C_{t}\left(q\right)\right]e^{-rt}=\int _{0}^{T}\left[Rp_{t}\left(q\right)+I_{0}\left(q\right)+Cs_{O}\left(q\right)-C_{o}\left(q\right)-M_{t}\left(q\right)-O_{t}\left(q\right)\right]e^{-rt}$$
where B t (q) – producer benefits or gains received at time t; C t (q) – private costs for establishing a conservation practice; Rp t (q) – annual rental payments; I 0(q) – one-time incentive payments for signup in initial period t = 0; Cs O (q) – cost-share payments under the conservation program; C o (q) – producers initial establishment cost to convert the land and install a buffer; M t (q) – maintenance and mowing cost; O t (q) – land opportunity cost or foregone income; and the term e −rt discounts the future streams of net benefits at the discount rate r over time t. The economic costs C t (q) to producers are sum of initial establishment cost to convert the land and install a buffer in initial period t = 0, defined as C o (q), maintenance cost M t (q) at time t, and land opportunity cost or foregone income, given as O t (q).
Gains to producers, B t (q), are sum of annual rental payments under the conservation program based on soil quality in the form of average soil rental rates, Rp t (q), one-time incentive payments for signup based on percentage of rental rate and the practice, I 0(q), and cost-share payment, Cs O (q), as a share of cost to install a practice at time t = 0.
Since payments to producers from conservation program are public spending, the present value of all economic costs, TC(q) also incorporate gains to producers expressed as
 $$TC\left(q\right)=\int _{0}^{T}\left[C_{t}\left(q\right)+C{S_{O}}\left(q\right)+{Rp_{t}}\left(q\right)+I_{0}\left(q\right)\right]e^{-rt},$$
where TC(q) represents all economic costs to be spent on establishing and maintaining a riparian buffer; C t (q)– private costs for establishing a conservation practice; CS O (q) – cost-share payments under the conservation program; Rp t (q) – annual rental payments; I 0(q) – one-time incentive payments for signup in initial period t = 0; and the term e −rt discounts the future streams of total costs at the discount rate r over time t.
To estimate the cost of reducing nutrients in waters using riparian buffers, the total economic costs needed to install the buffer are divided by the associated nitrogen or phosphorus reduction. If the annual reduction in nutrients (pollutants) is defined as P i (q), and the annual cost of reduction of nutrients is given as C(P i ), then the annual cost per pollutant i can be expressed as
 $$C\left(P_{i}\right)={TC\left(q\right) \over T*P_{i}\left(q\right)}.$$
To calculate total economic costs of establishing riparian buffers, this study uses information about typical costs for planting and establishing a buffer and annual maintenance costs in western Maryland from USDA NASS (2019). We account for the average soil quality for cropland in each county. Lastly, we estimate the present value of costs of reducing nutrients in the streams on a per acre basis by quantifying the amount of nutrients reduced per acre of buffer, based on the CBWM and our empirical data.
4. Results
This section presents the empirical results of the economic assessment on establishing riparian buffers on cropland under CREP in two counties in western Maryland. Section 4.1 analyzes the costs and gains to producers for establishing the riparian buffers under three options, and Section 4.2 analyzes the costs of nutrient reductions from riparian buffers.
4.1. The Costs and Gains to Producers from Installing Riparian Buffers
We begin by estimating the costs and gains to the producers for establishing riparian buffers under CREP using three scenarios as described in Section 2. For the economic analysis, self-constructed spreadsheets are used along with the CREP Maryland Chesapeake Bay factsheet as of April 2018 (Farm Service Agency, 2022). Producer costs and gains are determined by placing economic values on the resources and services required for each practice’s establishment following the methodology in Section 3. The key economic assumptions include a CREP contract term of 15 years; average soil rental rate for the cropland of each county obtained through the Allegany Soil Conservation District; establishment costs for the installation of riparian buffers; incentive payments under CREP; and a discount rate of 5%.Footnote 1 Table A1 in the Appendix lists the detailed economic assumptions and conditions under CREP.
Table 3 presents the present value of net gains to producers estimated over a 15-year period (in 2019 dollars).
Table 3. Costs and benefits to producers establishing riparian buffers in Allegany and Washington counties under CREP
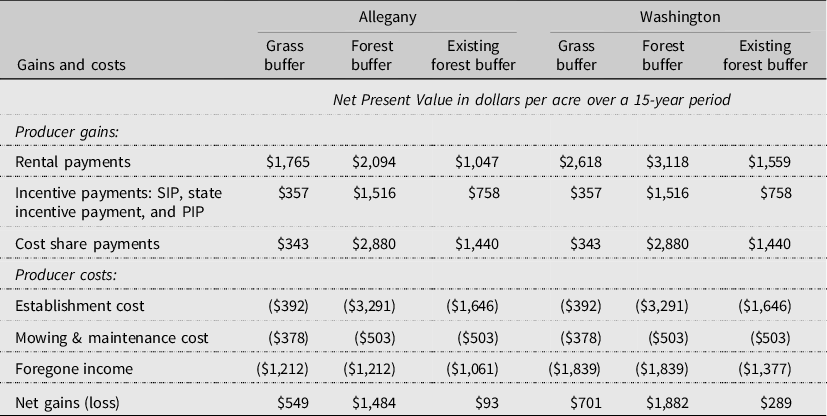
Notes: The table shows the gains and losses to the producers from the conversion of cropland to a riparian grass buffer, riparian forest buffer, and a riparian forest buffer next to a natural forest through the enrollment of Maryland’s Conservation Reserve Enhancement Program (CREP). SIP is one-time signing incentive payment. PIP is one-time practice incentive payment. A cost-share payment comprises of up to 50% of establishment cost to install the practice and 37.5% of the establishment cost from the State of Maryland. All estimates are calculated in 2019 dollars. All future estimates discounted at 5%.
The gains to producers through Maryland CREP include annual rental payments based on the average soil rates in each county, cost-share payments under CREP to cover a percentage of installation costs, a one-time incentive payment based on the conservation practice, and an added, annual incentive payment that ranges from 80 to 200% of the local soil rental rate depending on the conservation practice installed. The costs for establishing riparian buffers include installation costs, continuous maintenance and mowing costs, and opportunity cost in the form of lost income to producers. The costs and gains to producers are estimated for each option based on average estimates for two counties in western Maryland.
4.1.1. Rental Payments
These payments play a central part in setting the gains and costs for land enrollment and the practice installed under a long-term contract. Producer rental rates vary by geographical location, with higher rents to be paid on more productive soils. Rental payments for the cropland in western Maryland are lower than the average producer rental rates in Maryland. Based on average soil rental rates in the two counties, producers can earn $58 and $88 per acre per year in rental payments in Allegany and Washington counties, plus the incentive bonus based on the conservation practice offered (150 or 200% of the rental rate for the riparian grass buffer or the riparian forest buffer). Combined rental rates and incentive payments for the conservation practice represent the guaranteed annual rental payment a producer receives during the contract period. For the existing forest buffer, rental payments are given only for the portion of the enrolled cropland that was converted into a forest buffer.
Under CREP, the present values of annual rental payments are estimated as of 2019 at $1,765 per acre for a riparian grass buffer, $2,094 per acre for a riparian forest buffer, and $1,047 for an existing (natural and planted) riparian buffer in Allegany County over the 15-year contract period. In Washington County, the annual rental payments under three options are estimated at $2,618, $3,118, and $1,559 (present value) per acre, respectively. Because the soil rental rates and the incentive bonuses for each conservation practice differ, the rental payments vary under the three options of cropland enrollment.
4.1.2. Incentive Payments
One-time incentive payments include a signing incentive payment (SIP) of $100 per acre for establishing a grass buffer or a riparian buffer. The practice incentive payment (PIP) comprises of 40% from the cost for establishing the practice, as described below. In addition, the State of Maryland provides an incentive payment of $100 per acre for land enrollment (Farm Service Agency, 2022). In sum, the total incentive payments under three scenarios range from $357 to $1,516 per acre in the first year of enrollment. The incentive payments are the largest for establishing a riparian forest buffer.
4.1.3. Cost-share Payments
Cost-share payments are paid to eligible participants from federal and state funding for establishing vegetative cover or implementing conservation practices under contracts. Cost-share payments are calculated based on the cost to install the practice. The enrolled producer receives a cost-share payment of up to 50% of their own cost to install a practice from federal resources and 37.5% of the installation cost from the state (Farm Service Agency, 2022). The total cost-share payments are estimated at $343 per acre for the grass buffer, $2,880 per acre for the forest buffer, and $1,440 per acre of the newly planted forest buffer with the existing buffer option. The notable difference in the cost-sharing payments result from the higher installation cost to establish a riparian forest buffer compared to the cost for establishing a grass buffer. The cost of establishing riparian buffers is described below.
4.1.4. Establishment and Maintenance Cost
These costs represent voluntary practice installation cost and maintenance expenses. The direct costs to establish riparian forest buffers include costs of the site preparation, seeds and trees, plantings, replantings, and maintenance. The costs also depend on the site location, types and number of trees and shrubs planted, number of acres installed, and whether tree shelters are included.
To establish a riparian forest buffer with shelters costs approximately $3,291 per acre as of 2019 per the USDA County Executive Director at the Washington County Farm Service Agency (FSA). These costs are based on rates approved by FSA for the establishment of forest buffers, including $1,275 per acre for plantings of 300 trees of hardwoods and shrubs and $2,016 for plantings with tree shelters ($6.72 per shelter) (Bennett, Reference Bennett2021). In western Maryland, tree shelters are necessary to protect trees from deer; therefore, they are included in the total cost for installing a forest buffer. Previously, the cost estimates for a forest buffer establishment have been reported between $218 and $729 per acre (Lynch and Tjaden, Reference Lynch and Tjaden2000) but $2,150 per acre when trees were planted with shelters (Palone and Todd, Reference Palone and Todd1998) with cost of tree shelters ranging from $3.35 to $6.50 per shelter in Maryland (Wieland et al., Reference Wieland, Parker, Gans and Martin2009).
In addition, we also account for the cost on reinforcement plantings after 2 years from the buffer’s establishment of $100 per acre and annual mowing cost of $40 per acre. These costs are relevant to current expenditures of establishing forest buffers in western Maryland and to correspondent costs used by USDA in both counties. Note, planting costs for the establishment of the forest buffer vary significantly based on types of trees being planted and contractor rates. For example, the planting and replanting costs are lower for softwoods at $650 per acre compared to $1,275 per acre for hardwoods and shrubs (Bennett, Reference Bennett2021); however, hardwoods are better suited for riparian areas (Farm Service Agency, 2023).
For the grass buffer, the establishment costs also depend on land location and perimeter footage, vegetation to be planted, planting practice, and pesticide and herbicide application amounts. To establish a riparian filter strip, it costs approximately $392 per acre in Washington County. These costs include seed costs for cool-season grasses of $300 per acre and planting cost of $92 per acre. This figure can be lower or higher depending on the grass seed mixture per CREP’s recommended seed list and herbicides needed to control weeds and existing cover, and lime and fertilizer application per soil test results. For example, the establishment of a grass buffer with the warm-season grasses costs $212 per acre in Washington County. The previous establishment costs have been reported in the range from $168 to $400 per acre for grass buffers (Lynch and Tjaden, Reference Lynch and Tjaden2000), and from $384 per acre for grass and legume strips to $803 per acre for hay filter strips (Nakao et al., Reference Nakao, Sohngen, Brown and Leeds1999).
In addition, the maintenance cost for reseeding the legume part of a grass mixture after the fourth year is $96 per acre (twice per practice) and mowing costs are $40 per acre every other year to control the vegetation growth. The 50% cost-share for grass buffer establishment does not exceed an annual payment of $125/acre during the 15-year contract period.Footnote 2
Total present value of the maintenance and mowing costs for establishing the grass buffer is estimated at $378 per acre. Total present value of the maintenance and mowing costs of establishing the riparian forest buffer is estimated at $503 per acre, and the corresponding costs for the existing and adjacent forest buffer is also valued at $503 per acre over 15 years. A mixture of a riparian buffer and natural forest will require maintenance and the associated spending for the fully established forest buffer. Therefore, all the maintenance and mowing costs with the forest buffer have been accounted for the enhanced riparian buffer.
4.1.5. Opportunity Cost
The cost of lost opportunity from establishing the riparian buffers represents the forgone income to the producers from their cropland taken out of production. To account for opportunity cost, we consider a baseline scenario of corn production on no-till, non-irrigated cropland as estimated in the University of Maryland Extension “MD Crop Budgets” worksheet (Beale et al., Reference Beale, Breeding, Dill, Johnson, Lewis and Rhodes2019). With average yield of 150 bushels per acre and the 5-year average price of $3.90 per bushel, the producer is assumed to gain net income of about $162 per acre (net income over variable and fixed costs excluding the land charge). Because of differences in average soil rental rates in the two counties, the opportunity cost will also vary in each county. We utilized the above net income while accounting for the percentage difference in average soil rental rates in two counties. The opportunity cost of cropland taken out of production is estimated at $162 per acre in Washington County and at $107 per acre in Allegany County.
Note, according to the USDA Cash Rents Survey, the average annual rental rate in Maryland for cropland is reported at $109 per acre as of 2019. Under the baseline scenario, the cropland cost is treated as the fixed cost for the calculation of the forgone income for conservation practices (USDA NASS, 2019). The variable cost of inputs can change depending on the soil, the input prices, and the production. The gross revenue can also vary depending on the crop production, its yield, and prices of the crop. Under these assumptions, producers lose approximately $1,212 per acre (present value) in Allegany County and $1,839 per acre (present value) in Washington County with riparian forest or grass buffers over 15 years.
The present value of opportunity cost with existing forest buffer is valued at $1,061 per acre in Allegany County and $1,377 per acre in Washington County over 15 years. Half of the opportunity cost of the cropland is considered for the half-acre on the enhanced riparian buffer in each county. In addition, the annual foregone income for the adjacent natural forest is considered at $40 for timber harvests on the remaining half of the acre.
4.1.6. Net Gains to Producers
Based on the per-acre net gain estimates, producers are expected to receive financial gains from the cropland enrollment with the riparian forest and grass buffers under CREP in both counties. The producers are likely to financially gain with establishment of the existing and planted riparian forest buffer. However, the economic net gains for establishing an existing riparian buffer are significantly lower overall due to accounting for the benefits to producers only on the newly planted riparian forest buffer (0.5 acre) under CREP. The net gains with grass buffer are more than twice lower than the net gains with riparian forest buffer. The differences in net gains are attributed to the differences in soil quality, while the latter determines the annual rental payments to producers over a 15-year period. Insufficient incentives and the projected financial losses to producers are known to contribute to declines in CREP enrollment in recent years.
4.2. The Cost of Nutrient Reductions
The total economic cost function in equation 3 is used to estimate the present value of the economic costs for establishing a riparian buffer under three options. These costs include producers’ costs and governmental spending for riparian buffers. Program payments are paid by the government to the producers; therefore, payments reflect public expenses to establish riparian buffers. Equation 4 is used to estimate annual costs of nutrient reductions. The annual costs are calculated per pound of nitrogen and phosphorus for each buffer by dividing annual economic costs on a per acre basis by nutrient load reductions as reported in Table 2 for each corresponding county.
Table 4 summarizes the present value of annual costs of nutrient reduction from establishing a buffer in each county. Nutrient reduction costs vary based on the type of buffer. The estimated annual costs of mitigating nitrogen per acre of a riparian buffer range from $5.9 to $20.7 per pound in Allegany County and from $6.9 to $17.6 per pound in Washington County. The costs to reduce or prevent a pound of nitrogen from a forest buffer are more than 40% higher than the costs of nitrogen reduction from the grass buffer in each county. The phosphorus reduction costs are substantially higher in the range from $1,863.4 to $2,989.0 per pound for the grass buffer, and $1,222.1 to $1,426.0 per pound for the forest buffer. Thus, the costs to reduce a pound of phosphorus are higher for grass buffers than for forest buffers in each county, while the costs to reduce a pound of nitrogen are higher for forest buffers. The differences in costs of nutrient removal largely depend on the load of each nutrient reduction per buffer and indicate that certain buffers could be more cost effective for reducing nitrogen or phosphorus for a particular location.
Table 4. Economic costs of nutrient reductions in dollars per pound per year

Notes: *The estimates show the present value of annual costs of nutrients reduced per pound based on the corresponding reduction loads by grass or forest buffers, according to CBWM reported in Table 2.
**The estimates show the present value of annual cost of nitrogen reduction from existing and planted forest buffers based on the average loads determined by our synoptic studies (Siemek, Reference Siemek2021).
The average annual costs of nitrogen reductions in streams from existing and newly planted riparian buffers are estimated at $5.9 and $6.9 per pound in 2019 dollars in Allegany and Washington counties. Comparing these estimates with nitrogen reduction costs from grass and forest buffers in both counties, we can conclude that targeting buffer gaps near existing forested riparian areas could be the most cost-effective practice for reducing nitrogen. Note, nitrogen reductions for the existing and planted riparian forest buffers were calculated using our synoptic studies while load reductions for riparian forest and grass buffers were estimated using CBWM for each corresponding pollutant for the two counties as of 2019.
Our costs of nutrient reductions are discounted at an annual rate of 5%. A 3% discount rate is also recommended by the U.S. Office of Management and Budget (OMB, 2023). Fleming et al. (Reference Fleming, Merritts and Walter2019) used a discount rate of 2% in estimating cost-effectiveness. We conducted a sensitivity analysis of our costs using discount rates of 2% and 3%. In sum, the lower discount rates tend to increase the relative costs of nutrient reductions, since the value of future estimates are discounted less compared to the results with the ‘private’ discount rate of 5% (see Table A2 in Appendix).
We also summarized the costs of nutrient reductions and main assumptions of cost estimations from studies by Bonham et al. (Reference Bonham, Bosch and Pease2006), Wieland et al. (Reference Wieland, Parker, Gans and Martin2009), Jones et al. (Reference Jones, Branosky, Selman and Perez2010), Van Houtven et al. (Reference Van Houtven, Loomis, Baker, Beach and Casey2012), and Fleming et al. (Reference Fleming, Merritts and Walter2019) and reported them in Table S1 in the Online Appendix. Their costs are not directly comparable to our cost estimates because of differences in modeling scenarios, geographic regions, nutrient reductions, differences in program payments, variously used cost information, and other variables. The annual costs of nutrient removal per acre with buffers from the most recent study by Fleming et al. (Reference Fleming, Merritts and Walter2019) are relatively similar to our costs to some degree. For example, Fleming et al. (Reference Fleming, Merritts and Walter2019) estimated costs of nitrogen reduction at $12.2 per pound with grass riparian buffers and $12.9 per pound with forest riparian buffers, and costs of phosphorus abatement at $2,442 per pound and $1,284 per pound, respectively. Their costs of nitrogen reduction for grass buffers are almost the same as our estimates of about $12 per pound, but lower than our costs for forest buffers of $20.7 and $17.6 per pound in Allegany and Washington counties. Their costs per pound for phosphorus removal are lower than ours but within the range of our estimates. Fleming et al. (Reference Fleming, Merritts and Walter2019) used the same Phase 6 CBWM as our study, so the different values may be due to differences in cost estimates, pollution mitigation loads in two regions, different discount rates, and other parameters.
The estimated costs are somewhat comparable to annualized costs per pound of nutrients reduced per buffer estimated in 2018 dollars on the county level within CBWM and downloaded from the Chesapeake Assessment Scenario Tool (CAST, 2018). The annualized rate is 5%, which is comparable with the discount rate used in our estimation. The utilized average cost of nitrogen removal is $8.9 per pound with grass buffers and $11.6 per pound with forest buffers in Allegany County and $6.5 and $8.7 per pound in Washington County, respectively. The utilized average cost of phosphorus removal from grass buffers estimated at $1,275.2 per pound and from forest buffers at $626.1 per pound in Allegany County and $1,150.2 and $730.3 per pound in Washington County, respectively. Note, that the annualized average costs per pollutant for a buffer in the CBWM reflect the annual cost of establishing and maintaining the riparian buffer over its lifespan incurred by the public and provided entities, and therefore, not directly comparable to the present value of our annual economic costs per pollutant associated with nutrient reductions for each riparian buffer on a per acre basis. In addition, the CBWM model does not estimate the nutrient reductions from the existing buffers and the respected cost of pound per pollutant reduced to the Chesapeake Bay in western Maryland. But, even with such differences, the estimated values of nutrient mitigation indicate a notable variability in the costs based on buffer type, location, and nutrient pollutant.
Riparian buffers are relatively a cost-efficient practice in reducing nutrients in comparison to other BMPs. For example, Jones et al. (Reference Jones, Branosky, Selman and Perez2010) show that grass buffers and restored wetlands are the most cost-effective practices for nitrogen reduction under trading credits. Van Houtven et al. (Reference Van Houtven, Loomis, Baker, Beach and Casey2012) find that cover crops and grass buffers are cost-effective BMPs for nitrogen removal, while continuous no-till and grass buffers are cost-effective BMPs used for phosphorus removal under the trading credits scenario. Kaufman et al. (Reference Kaufman, Abler, Shortle, Harper, Hamlett and Feather2014) and Shortle et al. (Reference Shortle, Kaufman, Abler, Harper, Hamlett and Royer2013) find that land retirement and cover crops are the two cost-effective BMPs for Maryland but without accounting for forest or grass buffers in their analyses. Fleming et al. (Reference Fleming, Merritts and Walter2019) find that cover crops, grass buffers, and forest buffers are the most cost-effective practices for nitrogen removal, and legacy sediment mitigation and forest and grass buffers are most cost-efficient for phosphorus removal in the Bay region. We find that grass buffers are a more cost-effective practice than forest buffers in nitrogen removal, while forest buffers are more cost-effective than grass buffers in phosphorus reduction in western Maryland without accounting for other BMPs.
When extrapolating the agricultural buffer potential in Allegany and Washington counties (Table 1) to riparian buffers, the total economic cost associated with enhanced existing riparian forest buffers is estimated to be about $87 thousands and $465 thousands (in 2019 dollars) in Allegany and Washington counties, respectively, over the next 15 years.Footnote 3 The total economic costs of newly planted riparian buffer restoration in the two counties of western Maryland could reach around $1.0 million and about $5.3 million in the present value in Allegany and Washington counties over the next 15 years, if 60% of agricultural buffer potential will be buffered. The economic costs of a grass buffer would likely cost around $0.2 million in Allegany County and $1.4 million (in 2019 dollars) in Washington County over the next 15 years, if 30% of agricultural buffer potential will be used for grass buffers. When considering potential nutrient reductions, the enhanced existing buffer would reduce about 90.0 thousand pounds of nitrogen across the two counties over a 15-year period. This assumes that sites defined as “agricultural buffer potential” are between naturally forested sites that would facilitate filling in buffer gaps. Otherwise, about 345.3 thousand pounds of nitrogen is expected to be reduced from newly planted forest buffers, if 60% of agricultural buffer potential will be used, and 138.1 thousand pounds of nitrogen will be reduced from grass buffers if 30% of agricultural buffer potential will be targeted. Phosphorus abatement from planted forest buffers is estimated around 3,689.3 pounds and from grass buffers is about 844.7 pounds in two counties over 15 years.
In summary, the heterogeneity in economic costs is largely explained by the differences in the estimated loads of nutrients reduced by each buffer type. The hydrogeomorphology of the R&V also makes it necessary to accurately estimate how much nutrients are actually reduced per acre of riparian buffer. Our study suggests that cost-effectiveness should be estimated for various types of riparian buffers established on the specific sites with respect to the specific pollutant reduction rates.
5. Conclusion and Discussion
The cost of reducing nutrients in streams from riparian buffers has been estimated in two counties comprised in the Ridge & Valley physiographic province in western Maryland. By incorporating the conditions of the Conservation Reserve Enhancement Program (CREP) for riparian buffers and the nutrient mitigation data, this analysis underlines the importance in considering the economic estimates and costs of nutrient reductions for different types of riparian buffers in different counties. While the positive net gains to producers can be associated with riparian buffer restoration in general, the economic costs of nutrient reduction can vary across the riparian buffer practice, the specific pollutant mitigation, and the watershed jurisdictions.
When deciding which option to use, the producers should consider the soil quality of their land, the terms of the CREP contract, the opportunity cost, and the market conditions. Although riparian buffers are expected to bring economic gains to the producers under CREP, the cost to convert cropland to a riparian forest buffer is at least twice more than the cost of converting it to a grass buffer or the enhancement of an existing buffer on a per-acre basis. The combination of a planted riparian buffer and an existing forest is likely more beneficial in reducing nitrogen; yet producers neither receive economic payments for preserving existing riparian forests under the current conditions of CREP nor can they receive substantial monetary incentives for enhancing a critical riparian area to extend a natural forest strip. Nevertheless, our study finds that the enhancement of existing riparian buffers could be the most cost-effective option to implement and mitigate nitrogen than newly planted forest or grass buffers in western Maryland. The forest and grass buffers’ nitrogen reductions based on the CBWM loads are comparable, but the cost of nitrogen reduction for forest buffers is one-third greater than that for the grass buffers on a per acre basis. At the same time, the cost of phosphorus reduction for forest buffers is significantly lower than that for the grass buffers due to lower phosphorus reduction loads with grass buffers.
Our economic analysis has several limitations that could be addressed in the future. First, our analysis relies on nutrient reduction loads from the CBWM Phase 6 and own empirical estimates for nitrogen reduction from the synoptic studies associated with riparian buffers in two counties. The CBWM provides surface and subsurface nutrient retention estimates based on the nutrients’ reduction efficiencies determined within the hydrogeomorphic regions. Our synoptic studies were conducted at specific sites in two counties in western Maryland during baseflow conditions and focused on soluble forms of nutrients in subsurface waters. While the synoptic analysis finds significant correlations with nitrogen on the various sites containing planted and mature forests, there is little evidence of a significant relationship between phosphorus retention from the examined riparian buffers. Furthermore, our synoptic studies find insignificant correlations between newly planted buffers and nutrients in tested sites of western Maryland. Therefore, further research is needed to investigate nutrient retention from riparian buffers in less studied physiographic provinces.
Second, our economic analysis of the riparian buffers is hypothetical. We take a CREP perspective on the implementation of three scenarios by using economic assumptions, default values, and average estimates for the establishment of riparian buffers in two counties of western Maryland. Our analysis covers forest and grass riparian buffers established on cropland, while other best-management practices using vegetative covers are not investigated. In addition, the assumed buffer scenarios do not account for many localized factors that could significantly affect the cost-effectiveness of each buffer, including the age of the buffer and nutrient retention, the type of agricultural farming and land use, the survival rates of various types of plantings, the hydrologic flow regimes, and factors of the watershed, etc. The riparian areas are highly heterogeneous in mountainous regions and thus the cost nutrient estimation should be conducted for spatially specific riparian buffers at the particular sites.
Third, our analysis investigates the costs of nutrient reductions for the newly planted buffers adjacent to the existing riparian buffers. The eligible practices under CREP do not include naturally grown forest, and the landowners are not incentivized for its establishment. Although we account for rental payments and cost share only on the augmented acreage, the economic gains and costs could be underestimated if participants maintain the entire buffer. Development of riparian areas already containing natural forests will facilitate the closure of buffer gaps, which would reduce the possibility of groundwater passing through an unbuffered area in karst terrain, especially in the mountainous regions of western Maryland.
Lastly, we did not account for other potential environmental benefits in areas where riparian buffers are established. Riparian buffers provide vital environmental benefits and ecosystem services; however, quantifying the monetary value of environmental benefits is challenging and beyond the scope of this paper. Had it been considered, the environmental benefits and ecosystem services from riparian buffers and improved water quality would have comprised the largest portion of total economic benefits (Marczak et al., Reference Marczak, Sakamaki, Turvey, Deguise, Wood and Richardson2010; Marczak and Richardson, Reference Marczak and Richardson2007; Naiman, Bilby, and Bisson, Reference Naiman, Bilby and Bisson2000; Nakano and Murakami, Reference Nakano and Murakami2001; Richardson et al., Reference Richardson, Naiman, Swanson and Hibbs2005; Wainger and Mazzotta, Reference Wainger and Mazzotta2011).
Supplementary material
The supplementary material for this article can be found at https://doi.org/10.1017/aae.2023.24
Data availability statement
The data that support the findings of this study are available from the corresponding author, S.S., upon reasonable request.
Acknowledgments
A special thanks to Joe Winters and Melissa Nash from MD DNR for allowing us access to their western Maryland riparian buffer reports and to Shannon Potter Dill from UMD Extension and Colleen Cashell from FSA for providing feedback on our benefit–cost analysis. I would like to pay special regard to Mona Lee from SCD and Charles Bennett and Laura Pleasanton from USDA Farm Service Agency for quickly responding to our inquiries. We thank participants at the 2019 meeting of the Southern Economics Association for their helpful comments and the four anonymous reviewers for their consideration and valuable inputs. This paper is scientific contribution no. 6306 from University of Maryland Center for Environmental Science.
Author contribution
Conceptualization, S.S., O.K., K.N.E.; methodology, S.S., O.K., K.N.E.; formal analysis, S.S. and O.K.; data curation, S.S. and O.K.; writing—original draft, S.S. and O.K.; writing—review and editing, S.S, O.K., and K.N.E.; synoptic studies and results, S.S. and K.N.E.
Financial support
This research received no specific grant from any funding agency, commercial, or not-for-profit sectors.
Competing interests
Stephanie Siemek, Oleg Kucher, and Keith Eshleman declare none.


 Open access