


An established function of vitamin D is to maintain bone health and homeostasis of Ca and P(Reference Veldurthy, Wei and Oz1). Recent studies have suggested that vitamin D may play a protective role against several infirmities such as metabolic syndrome(Reference Ganji, Tangpricha and Zhang2), diabetes mellitus(Reference Angellotti and Pittas3), CVD(Reference Pilz, Verheyen and Grubler4), autoimmune diseases(Reference Martens, Gysemans and Verstuyf5), depression(Reference Vellekkatt and Menon6) and cancer(Reference Grant7). Although vitamin D is synthesised endogenously when the dermis is exposed to the sun’s UV-B light, the diet provides a major source of vitamin D(Reference Baggerly, Cuomo and French8), especially in the absence of exposure to sunlight. The dietary sources of vitamin D include egg yolks, wild or irradiated mushrooms, oily fish such as mackerel, tuna, and salmon, and fortified foods such as cereals, milk, yogurt, butter, margarine, fruit juices, and tofu(Reference Holick9). Measurement of vitamin D status is widely assessed using the concentrations of serum 25-hydroxyvitamin D (25(OH)D). Dietary or endogenously synthesised vitamin D in the skin is converted to 25(OH)D in the liver. Circulating 25(OH)D is considered the best marker because it reflects the dietary and endogenously synthesised vitamin D and has a longer half-life (2–3 weeks). On the other hand, 1,25, dihydroxyvitamin D, an active hormone form, cannot serve as a marker of vitamin D status because this form is strictly controlled and has a much shorter half-life(Reference Pilz, Marz and Cashman10).
To date, there is no consensus regarding cutoff serum 25(OH)D concentrations for vitamin D deficiency. Vitamin D deficiency has been defined as having serum vitamin D concentrations from 25 nmol/l to 75 nmol/l(Reference Ginde, Liu and Camargo11–Reference Lu, Zhang and Ke13). The US Institute of Medicine defined deficiency, insufficiency, and sufficiency as having serum vitamin D concentrations < 30 nmol/l, 30 to < 50 nmol/l, and ≥ 50 nmol/l, respectively(Reference Herrick, Storandt and Afful14). A concentration of > 125 nmol/l was associated with adverse health effects(Reference Burt, Billington and Rose15). These cut-off points are based on bone health and Ca homeostasis. On the other hand, the Endocrine Society recommended serum vitamin D concentrations of > 75 nmol/l for optimal bone and non-bone health.(Reference Holick, Binkley and Bischoff-Ferrari16)
Vitamin D deficiency has become a global nutritional health issue(Reference O’Mahony, Stepien and Gibney17). Worldwide, about 1 billion people suffer from vitamin D deficiency(Reference Nair and Maseeh18). In the USA, 4·9 % of the population (≈19·5 million) have been reported to have vitamin D deficiency(Reference Cashman19). Even in sunny areas like the Middle East, vitamin D deficiency is highly prevalent(Reference Lips, Cashman and Lamberg-Allardt20). The majority of the nations do not have mandated food fortification of vitamin D. However, several nations have some form of voluntary fortification of dairy products. Despite these fortification efforts, the majority of the populations do not meet the daily recommendations for vitamin D(Reference Bilinski and Talbot21). Although vitamin D supplementation has been suggested as a way of meeting the vitamin D requirements, there has been an increased emphasis on meeting the nutrient requirements through the diet(Reference Lichtenstein and Russell22). The plausible reasons for global vitamin D deficiency are decreased outdoor physical activity due to changing lifestyles leading to a decline in sunlight exposure(Reference Manferdelli, La Torre and Codella23) and increased use of sunblock lotions(Reference Libon, Courtois and Le Goff24). In light of decreased exposure to sunlight, the diet becomes an important source of vitamin D although dietary sources are limited. Dietary recommendations for vitamin D are based on the assumption that exposure to sunlight is minimum in the population(Reference Spiro and Buttriss25). Because people consume different foods rather than a single food or nutrient and in different frequencies and quantities, the interest has grown to study the relationship between whole diet and serum biomarkers. Many studies have addressed the relationship between the consumption of certain foods and vitamin D such as dairy products(Reference Al-Daghri, Aljohani and Al-Attas26). Dietary patterns are a complex system affected by many elements that can either have a synergetic or an antagonistic effect(Reference Jacobs and Tapsell27). Limited studies have focussed on the relationship between dietary patterns and vitamin D concentrations. A study by Zupo et al.(Reference Zupo, Lampignano and Lattanzio28) found a direct association between adherence to a Mediterranean diet and vitamin D concentrations. A study on vegetarian diets in Pakistan found that those who consumed a vegetarian diet had a higher vitamin D concentration compared with those who consumed a non-vegetarian diet(Reference Baig, Sheikh and Islam29). To our knowledge, no data are available on the relationship between specific food patterns and serum vitamin D in US adults. Therefore, this study aimed to investigate whether there was an association between serum 25(OH)D concentrations and food patterns in US adults using the data from the nationally representative sample surveys.
Methods
NHANES description
The National Center for Health Statistics and Centers for Disease Control and Prevention conduct large nationally representative sample surveys known as the National Health and Nutrition Examination Survey (NHANES) on the noninstitutionalized US population. A stratified, multistage, probability, sample survey design was used to collect a representative sample of the US population of all ages. Households were randomly selected and all members within the household were then selected based on age, sex, and race-ethnicity. To produce reliable estimates, several sub-populations such as persons 60 years and older, low-income persons, adolescents, Mexican Americans/Hispanics, and non-Hispanic blacks were oversampled. Since 1999, NHANES has been conducted as annual surveys, and data are released in 2-year cycles for public use. Data on demographic characteristics, diet, and health were collected from personal interviews. Physical examinations and collection of blood and urine samples were conducted in the Mobile Examination Centers. Detailed descriptions of the survey design and methodologies are described elsewhere. The National Center for Health Statistics Ethics Review Board approved all NHANES protocols before data collection. The ethical review board approval codes for the NHANES 2003–2004 and NHANES 2005–2006 were #98-12 and #2005–2006, respectively(30,31) .
In this study, data from two cycles of NHANES 2003–2004 and NHANES 2005–2006 were used. NHANES 2003–2004 was conducted between January 2003 and December 2004 on 12 761 participants (of which 9643 were examined in Mobile Examination Centers). NHANES 2005–2006 was conducted between January 2005 and December 2006 on 12 862 participants (9950 were examined at Mobile Examination Centers). NHANES 2003–2004 had a response rate of 79 % and 76 % for the interviewed sample and the examined sample, respectively. NHANES 2005–2006 had a response rate of 80·5 % and 77·5 % for the interviewed sample and the examined sample, respectively(32). Detailed explanations of all procedures are available elsewhere(33,34) .
Study sample
We combined the data from NHANES 2003–2004 and NHANES 2004–2005 into one analytic data file. We used these two cycles because the FFQ data are available only in these two surveys. From the combined NAHNES 2003–2006 data, 10 020 adults met the criteria for inclusion. Out of these, 1029 participants were excluded due to lack of serum 25(OH)D concentrations. Further, due to a lack of food intake data, 2354 were excluded. Thus, the final analytical sample contained 6637 adults (Fig. 1).

Fig. 1. Study sample derivation: National Health Nutrition Examination Surveys (NHANES), 2003–2006. Data from NHANES 2003–2004 and 2005–2006 were concatenated into one analytic file, NHANES 2003–2006.
Vitamin D measurement
Blood samples were collected by venipuncture from participants in Mobile Examination Centers according to standard protocols. Serum 25(OH)D concentrations were analyzed at the National Center for Environmental Health of the Centers for Disease Control and Prevention using the Diasorin RIA(35). The ultra-HPLC-tandem MS method was used for later surveys beginning 2007–2008(36,37) . To make the serum vitamin D data compatible across the surveys, National Center for Health Statistics standardized vitamin D concentrations reported for previous surveys using regression models. Therefore, serum vitamin D concentrations that were used in this study are assay standardised concentrations.
Food intake measurement
A 151-item FFQ was used to collect the food intake data. The FFQ was developed, tested, and validated by both the National Institutes of Health and the National Cancer Institute. The FFQ was administered in both English and Spanish. A total of 6472 and 5549 participants took part in the FFQ data collection in NHANES 2003–2004 and NHANES 2005–2006, respectively. Retrospectively, the participants supplied what they consumed (frequency of food intakes) during the past 12 months before the survey. Participants reported food intakes as ‘never, 1 time/month or less, 2 times/month or less, 1–2 times/week, 3–4 times/week, 5–6 times/week, 1 time/day, 2–3 times/day, 4–5 times/day, and 6 or more times/day’. This information was collected as part of the household interview. The FFQ that was used in NHANES was qualitative in nature and no portion sizes were collected. This qualitative food intake data were computed into times/month with the conversion factors of 4·3 weeks/month and 30·4 days/month. To assure the accuracy and completeness of FFQ, manual verification, and quality control programs were used. The detailed data collection procedures are available elsewhere(38).
All the foods reported in FFQ were categorized into thirty food groups. These food groups were low-fat dairy, high-fat dairy, dairy alternatives, meats, processed meats, fish and seafood, eggs, poultry, both creamed and other soups, pizza, mixed food, whole grains, refined grains, cereal, nuts, legumes, fruits, fruit juices, cruciferous, starchy, other vegetables, butter and margarine, other fats, snacks and sweets, coffee/tea, alcohol, energy drinks. Depending on the frequency of intake of these food groups, three different dietary patterns were identified. The grouping of foods was based on nutritive value and the culinary nature of foods. These food groupings were based on the study published earlier(Reference Ganji, Martineau and Van Fleit39).
Confounding variables
Variables that were known to affect the serum 25(OH)D concentrations were considered as confounding variables. These were age, sex, race–ethnicity, BMI, leisure-time physical activity, education, poverty income ratio, smoking, and alcohol consumption. Age, sex, and race–ethnicity were self-reported by participants. BMI was measured using weight in kg divided by height in m2. The poverty income ratio was defined as total family income divided by the poverty threshold as defined by the US Census Bureau(40). Education was divided into < 11 grade, high school/General Education Development, some college, and higher than college categories. Smokers were categorised as current smokers, former smokers, and never smokers. Leisure-time physical activity was converted into a metabolic equivalent task (MET). MET was categorized into mild (<600 MET), moderate (600–1199 MET), and intense (≥ 1200 MET). Alcohol consumers were categorised into non-drinkers, drinkers, and not reported.
Data analysis
Statistical analysis was performed using STATA software (general-purpose statistical software package, Stata for Windows, version 16, Stata Corp LLC). We have accounted for NHANES’s complex survey design and sample weights in the analysis. A detailed description of the guidelines for data analysis was described elsewhere(41).
We utilized the FACTOR function in STATA, which used principal component analysis and varimax rotation, an orthogonal rotation. Varimax rotation was used to maximize the variance of the factors. A factor solution was applied to the frequency of food consumption of thirty food groups. This resulted in eigenvalues for thirty different food groups. Figure 1 shows the eigenvalues of thirty components or factors. The eigenvalues measure the amount of variation in relation to the total variance. An eigenvalue of 1·5 and a scree plot were used to determine the number of factors to be extracted (Fig. 2). Based upon this, the first three factors were selected and retained. These factors were labeled based on data interpretation and were considered the major dietary patterns. A factor loading score was given to each of the food groups to help divide them into three different dietary patterns. The food groups were determined based on a factor loading score > 0·3, thus if a food group had a score higher than 0·3 it falls into a specific food pattern. Food pattern scores were then stratified into quartiles. The association between dietary factor scores and serum 25(OH)D concentrations was measured using a multivariate-regression analysis. We built an unadjusted, adjusted for age, sex, and race–ethnicity, and multivariate-adjusted regression models. A multivariate model was adjusted for age, sex, race–ethnicity, education leisure-time physical activity, poverty income ratio, smoking, alcohol drinking, and BMI. This association was reported as regression coefficients (β) and their 95 % confidence intervals. In this analysis, quartile 1 was used as the referent category.
Additionally, we analyzed the association between food intake patterns scores (quartiles) and vitamin D deficiency (serum vitamin D concentrations < 30 nmol/l) with multivariate-adjusted (adjusted for age, sex, race–ethnicity, education leisure-time physical activity, poverty income ratio, smoking, alcohol drinking and BMI) logistic regression. Quartile 1 was used as the referent category, in this analysis. This relationship was reported as OR and their 95 % CI. Statistical significance was set at P < 0·05.
Results
Characteristics of the study sample by sex
Characteristics of the study sample by sex are presented in Table 1. The sample consisted of 46 % men (n 3082) and 54 % women (n 3555). Of the 6637 participants, 56 % were non-Hispanic white (n 3691), 19 % were non-Hispanic blacks (n 1259), 19 % were Mexican Americans/Hispanics (n 1245) and 6 % were of other ethnicities/races (n 442). 21 % of our sample (n 1386) reported themselves as current smokers. 26 % of the participants had not completed high school education (n 1756). 25 % of men were smokers, while only 17 % of women were smokers. Alcohol consumption was more prevalent in men (67 %) than in women (55 %). More women consumed supplements than men (62 % v. 48 %). BMI was significantly higher in women than in men (29 v. 28 kg/m2; P < 0·001).
Table 1. Sample characteristics by sex in the US National Health and Nutrition Examination Survey (NHANES) 2003–2006 (n 6637)*,†

* Data from two cycles of NHANES 2003–2004 and 2004–2005 were concatenated into one analytic data file NHNAES 2003–2006. Five persons did not report education, two persons did not report smoking and two persons did not report poverty income ratio. For simplicity, these categories were not reported.
† NHW, non-Hispanic white; NHB, non-Hispanic black; MA/H, Mexican American/Hispanic; GED, General Education Diploma; MET, metabolic equivalent task.
‡ Data are presented as mean ± standard deviation or median (inter quartile range) for continuous measures and n (%) for categorical measures.
§ Significance between men and women. t test was used for continuous variables and chi-squared test was used for categorical variables.
|| Leisure time physical activity. 1 MET = 1 kcal/kg/h.
¶ Total family income divided by the poverty threshold as defined by the US Census Bureau.
Description of food intake patterns
Three major dietary patterns were extracted based on the factor analysis from thirty predefined food groups (Table 2). Higher positive factor loading scores are considered to contribute the most to the factor score, whereas higher negative factor loading scores are thought to contribute the least. The first factor had a high factor loading scores for meats, processed meats, poultry, starchy vegetables, pizza, mixed dishes, condiments and energy drinks. Therefore, the first factor was named the meat and processed meat food (MPF) pattern. On the other hand, the second factor had a high factor loading score for cruciferous and green vegetables, fruit, other vegetables, whole grains, tomatoes, nuts, cereals, low-fat dairy products and fish and other seafood. Hence, this factor was labeled as vegetable, fruits, nuts, and whole grain (VFNW) pattern. The third factor had high factor loading scores for coffee, tea, sweets and snacks, dairy alternative, butter and margarine, high-fat dairy and eggs. Thus, this factor was named as sweet, snack and beverage (SSB) pattern. The MPF pattern was the most dominant pattern based on the scree plot (Fig. 1). The MPF pattern explained the largest variance 29·1 % and the SSB pattern explained the least variance (5·8 %). VFNW food pattern explained the variance of 6·7 %. Thus, the total variance explained by these three food patterns was 34·4 %.
Table 2. Factor loadings for food intake patterns in the US National Health and Nutrition Examination Survey (NHANES) 2003–2006 (n 6637)*,†
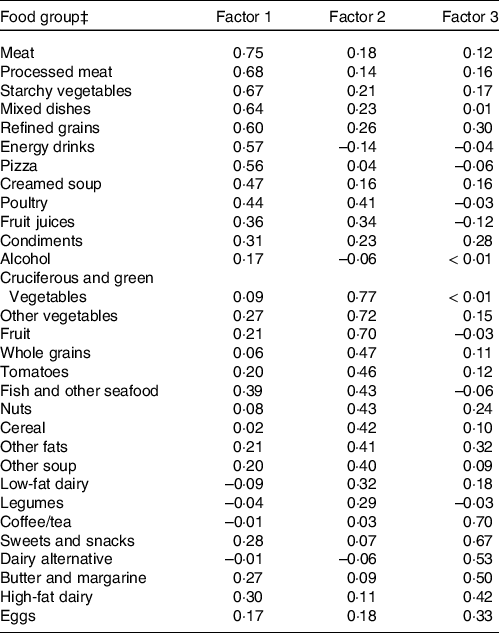
* Data from two cycles of NHANES 2003–2004 and 2004–2005 were concatenated into one analytic data file NHNAES 2003–2006.
† Factor analysis was used to extract three principle factors. Based on factor loadings and interpretability, factor 1 was labeled as meat and processed meat foods, vegetables, fruits, nuts and whole grains, and snacks, sweets and beverage food patterns.
‡ Food groupings were based on food intakes collected using a 151-item FFQ in NHANES 2003–2006.
Characteristics of the study sample by food patterns
Characteristics of the study population by quartile food pattern scores are presented in Table 3. For simplicity, we presented only data associated with extreme quartiles. Persons who consumed high amounts of MPF tend to be younger while those who consumed VFNW and SSB tend to be older. In the MPF pattern, the proportion of participants belonging to the non-Hispanic blacks race–ethnicity was highest in the fourth quartile compared with the first quartile (27 % v. 12 %, P < 0·001). Supplement consumption was lower in the MPF pattern fourth quartile compared with the first quartile (42 % v. 69 %, P < 0·001). In the same food pattern, BMI was higher in the fourth quartile compared with the first quartile (P < 0·001). Persons engaged in intense physical activity were higher in the VFNW fourth quartile compared with the first quartile pattern scores (46 % v. 33 %, P < 0·001). A higher proportion of participants smoked in the fourth quartile MPF pattern compared with the first quartile (32 % v. 13 %, <0·001). Serum vitamin D concentration was significantly lower in the fourth quartile MPF pattern compared with the first quartile (P < 0·001). While serum vitamin D was significantly higher in the fourth quartile of VFNW and SSB patterns compared with the first quartile (P < 0·001)
Table 3. Subject characteristics by food intake patterns in the US National Health and Nutrition Examination Survey (NHANES), 2003–2006
(Number and percentages, n 6637)*

* Data from two cycles of NHANES 2003–2004 and 2004–2005 were concatenated into one analytic data file NHNAES 2003–2006. MPF, meat and processed food; VFNW, vegetables, fruits, nuts and whole grain; SSB, sweet, snack and beverage; NHW, non-Hispanic white; NHB, non-Hispanic black; MA/H, Mexican American/Hispanic; GED, General Education Diploma; MET, metabolic equivalent task.
‡ Data are presented as mean ± standard deviation or median (inter-quartile range) for continuous measures and n (%) for categorical measures. For simplicity, characteristics are presented only for food pattern scores of quartile 1 and 4.
§ Significance in ANOVA for continuous variables and chi-squared test for categorical variables.
|| Leisure time physical activity. 1 MET = 1 kcal/kg/h.
¶ Total family income divided by the poverty threshold as defined by the US Census Bureau.
Association between food intake patterns and serum 25(OH)D concentrations:
Relation between food pattern scores and serum vitamin D concentrations was presented in Table 4. The serum vitamin D concentrations were significantly negatively associated with serum vitamin D concentrations in MPF food pattern. in unadjusted (P < 0·001), sex-, age- and race–ethnicity-adjusted (P < 0·001) and multivariate-adjusted models (P < 0·018). In the VFNW food pattern, serum vitamin D concentrations were significantly associated only in unadjusted (P < 0·047) and sex-, age- and race–ethnicity adjusted models (P < 0·001) but not in multivariate-adjusted model (P = 0·08). Additionally, in the restricted cubic spline analysis, we observed a non-linear relationship between VFNW and MPF food pattern scores and serum vitamin D concentrations (P < 0·001) (Fig. 3).
Table 4. Association between food intake patterns and serum vitamin D concentrations in US adults: National Health and Nutrition Examination Survey (NHANES), 2003–2006
(OR and 95 % CI, n 6637)*

* Data from NHANES 2003–2004 and 2005–2006 were concatenated into one analytic file, NHANES 2003–2006. MPF, meat and processed food pattern; VFNW, vegetables, fruits, nuts, and whole grain pattern; SSB, sweets, snacks, and beverage pattern.
‡ Food intake pattern scores were stratified into four quartiles.
§ Significance for the association between food intake pattern scores and serum vitamin D concentrations in regression analysis.
|| Referent category.
¶ Significantly different from quartile one.
** Model was adjusted for age, sex, race-ethnicity, poverty income ratio, physical activity, smoking, education, alcohol drinking and BMI.

Fig. 2. Scree plot of eigenvalues which is based on the frquency of intake of thirty food groupss from the National Health and Nutrition Examination Surveys, 2003–2006 (n 6637). Two cycles of NHANES 2003–2004 and 2005–2006 were concatenated into one analytic file. Factor components are on the X-axis and their coresponding Eigenvalues are on the Y axis. Scree plot was used to deterimine the number of factors to be extracted. Based on the plot, only first three factors were retained in the factor analysis.

Fig. 3. Non-linear association between food intake pattern scores and serum vitamin D concentrations in US adults: National Health and Nutrition Examination Surveys 2003–2006 (n 6637). Data from NHANES 2003–2004 and 2005–2006 were concatenated into one analytic file, NHANES 2003–2006. Analysis was adjusted for age, sex, race-ethnicity, poverty income ratio, education, physical activity, smoking, alcohol consumption and BMI. A restricted cubic spline procedure with three knots placed at 10th, 50th and 90th percentiles was used to analyze the non-linear association between food pattern scores and serum vitamin D concentrations. MPF (a) and VFNW (b) intake patterns are significantly non-linearly related to serum vitamin D concentrations. No relation between SSB intake pattern scores and serum vitamin D concentrations (c). MPF, meat and processed meat food, VFNW, vegetable, fruit, nuts and whole grain; SSB, sweet, snack and beverage.
Association between food intake patterns and vitamin D deficiency
The association between food pattern scores and vitamin D deficiency (< 30 nmol/l) is presented in Table 5. In the multivariate-adjusted logistic regression analysis, the MPF pattern was significantly, directly associated (P = 0·001) and the VFNW pattern was significantly, inversely associated (P = 0·001) with serum vitamin D deficiency. The likelihood of having vitamin D deficiency in the fourth quartile MPF patterns score was ≈60 % higher compared with those in the first quartile pattern score (OR, 1·6 v. 1). While the likelihood of having vitamin D deficiency in the fourth quartile VFNW patterns score was ≈55 % lower compared with those in the first quartile pattern score (OR, 0·55 v. 1). There was no association between SSB food intake pattern scores and vitamin D deficiency in US adults.
Table 5. Association between food intake pattern scores and vitamin D deficiency (< 30 nmol/l) in US adults: National Health and Nutrition Examination Surveys (NHANES), 2003–2006
(OR and 95 % CI, n 6637)*

* Data from NHANES 2003–2004 and 2005–2006 were concatenated into one analytic file, NHANES 2003–2006.
† Food intake pattern scores were stratified in to four quartiles.
‡ Significance for the association between food intake pattern scores and vitamin D deficiency in multivariate logistic regression analysis. The model was adjusted for age, sex, race–ethnicity, poverty income ratio, physical activity, smoking, education, alcohol drinking and BMI. MPF, meat and processed food pattern; VFNW, vegetables, fruits, nuts, and whole grain pattern; SSB, sweets, snacks and beverage pattern.
|| Referent category.
¶ Significantly different from referent category.
Discussion
To our knowledge, this is the first study that investigated the association between food intake patterns and assay-adjusted, standardized serum vitamin D concentrations in US adults using the nationally representative sample surveys. In this study, we derived three food intake patterns. These were MPF, VFNW, and SSB. Our results showed that high food intakes of MPF were inversely associated with serum vitamin D concentrations in US adults. Additionally, the VFNW pattern was non-linearly related to serum vitamin D, whereas there was no relationship between consumption of SSB pattern and serum vitamin D concentrations in multivariable-adjusted analysis. Additionally, the likelihood of having vitamin D deficiency was directly related to MPF food pattern scores. The likelihood of having vitamin D deficiency was inversely related to VFNW food pattern scores.
Food intake patterns derived in this study by and large are similar to the food patterns derived in several studies. For example, using the NHANES data, Poti et al.(Reference Poti, Duffey and Popkin42) derived Western and Prudent food patterns. These patterns are similar to our MPF and VFNW patterns, respectively. Using the Qatar Biobank data, recently, we reported three food intake patterns, that is, traditional (high intakes of meat, poultry; similar to MPF) and prudent (high intakes of fruits and vegetables; similar to VFNW) and sweet/snack patterns (high intakes of sweets and snacks; similar to SSB)(Reference Shi, El-Obeid and Meftah43). Utilising the NHANES III data, Ganji et al.(Reference Ganji, Kafai and McCarthy44) reported two food intake patterns, that is, high-fat-low-vegetable pattern (similar to MPF pattern) and prudent pattern (similar to VFNW). Lastly, a study from Iran has identified three food patterns, that is, Western pattern (similar to MPF), Prudent (similar to VFNW) and traditional pattern(Reference Roohafza, Feizi and Amani Tirani45). Depending on the region, the food intake patterns slightly differed due to regional differences in the availability of foods and food culture.
The MPF food pattern derived in this study is similar to the Western food pattern reported in the literature(Reference Poti, Duffey and Popkin42–Reference Roohafza, Feizi and Amani Tirani45). This MPF pattern had a high factor loading for meats. Although animal foods are the primary source of vitamin D, the amount of vitamin D is highly variable depending on the source of the meat (beef, pork or lamb) cut of the meat, season and feed composition(Reference Schmid and Walther46). Organ meats (liver and kidney) contain much more vitamin D than muscle food. Vitamin D and 25(OH)D, an active form, concentrations were 0·9 to 1·3 µg/kg and 2·7 to 5·8 µg/kg, respectively, in raw beef(Reference Purchas, Zou and Pearce47). In raw pork, the vitamin D and 25(OH)D concentrations were 0·8–4·2 µg/kg and 0·8–1·4 µg/kg, respectively. No vitamin D was found in lamb and mutton by Kobayashi et al.(Reference Kobayashi, Takeuchi, Okano, Burckhardt and Heaney48). The vitamin D content in the muscle food is directly related to the fat content of the muscle. Meat and meat products contributed to 30–35 % of vitamin D intake in 11–64 years old persons(49). Persons who consumed higher amounts of meat consumed higher amounts of vitamin D. For example, those who consumed ≥ 70 g/d of meat had a ≈30 % higher intake of vitamin D compared with those who consumed < 70 g/d of meat(Reference Derbyshire50). Thus, persons who had a higher intake of vitamin D have higher Ca blood levels because it has been well established that vitamin D maintains Ca homeostasis. Briefly, vitamin D maintains Ca homeostasis by enhancing the absorption of Ca from the gut, stimulating renal reabsorption of Ca in the distal tubule and activating bone decalcification.(Reference Khazai, Judd and Tangpricha51). In our study, the MPF pattern diet included not only meats but also foods such as processed foods starchy vegetables, mixed dishes, refined grains, energy drinks, pizza, creamed soups, poultry, fruit juices and condiments. Although meats that were consumed as part of the MPF pattern supply some vitamin D, other food groups (as described above) are not good sources of vitamin D. A study found a significant inverse relation between fast food consumption and serum vitamin D concentrations(Reference Muhairi, Mehairi and Khouri52). Similarly, another study found that consumption of processed foods was inversely associated with vitamin D content(Reference Louzada, Martins and Canella53). Overall, the relationship between processed foods or fast foods and serum vitamin D concentrations is not well understood. It is more likely that the negative association between MPF and serum vitamin D is primarily driven by the processed foods that are part of the MPF food pattern.
In addition, in this study, persons who consumed high amounts of MPF (fourth quartile) were more likely to be smokers, engaged in less physical activity and consumed fewer supplements. Smoking and a sedentary lifestyle are associated with lower vitamin D status(Reference Ren, Gu and Zhu54,Reference Hibler, Sardo Molmenti and Dai55) . While supplement use was associated with higher vitamin D status(Reference Haines and Park56). Because the recommended intake for vitamin D in US adults is 600 IU/d which is 15 µg/d(57), a level that might be difficult to be provided entirely by diet, thus the intake of vitamin D supplements might be beneficial. Also, persons in the fourth quartile for MPF pattern scores had higher BMI compared with those in the first quartile. Several studies showed that body adiposity is inversely related to serum vitamin D(Reference Dong, Asmolovaite and Marseal58,Reference Alemzadeh, Kichler and Babar59) . This is mainly due to the sequestration of vitamin D by the adipose tissue(Reference Wortsman, Matsuoka and Chen60). Also, the reduced bioavailability of vitamin D from the dermis and dietary sources are other possible causes of low circulating vitamin D in persons who are overweight and obese(Reference Vanlint61). Thus, the negative relation between MPF and serum vitamin D can partly be explained by high smoking rates, decreased physical activity and increased adiposity.
In the multivariable regression analysis, the VFNW pattern had no relation with serum vitamin D concentration although there was a trend (P < 0·08). However, in the restricted cubic spline analysis, we found a significant, non-linear relation between the VFNW pattern and serum vitamin D. This relationship was invert ‘U’. The relationship between VFNW pattern scores and serum vitamin D was positive until quartile 3 and then the relationship is negative. The VFNW pattern largely resembles a vegetarian diet, although the participants in the VFNW pattern were not exclusively vegetarians but had higher loading scores for fruits, vegetables, nuts and whole grains. In a related study, Chan et al.(Reference Chan, Jaceldo-Siegl and Fraser62) reported no differences in serum vitamin D concentrations in participants consuming vegetarian, partial vegetarian and non-vegetarian foods. It is not surprising that we did not find a linear relationship between the VFNW pattern and serum vitamin D in our study sample because the foods that are part of the VFNW pattern are poor sources of vitamin D. However, study participants in this pattern had high factor loading scores for fish and sea food and dairy products which are often fortified with vitamin D, which can explain the positive trend between serum vitamin D and VFNW pattern scores. When it comes to food items that are fortified with vitamin D, it is worth mentioning that fortification of foods with vitamin D vary from one country to another. For instance, in the USA and Sweden, liquid milk is a good source of vitamin D because it is fortified with 1 µ/100 g(Reference Itkonen, Erkkola and Lamberg-Allardt63). Recently, Canada has permitted to increase the fortification level of vitamin D from 1 to 2 µ/100 g of milk(Reference Itkonen, Erkkola and Lamberg-Allardt63). The liquid milk in the UK is not is not fortified, thus it is not a good source of vitamin D(64). Given the various levels of fortification of foods across the globe, the association between serum vitamin D and food patterns may vary from country to country.
A nationally representative survey with a large sample size of adults was one of the study’s strengths. We were able to adjust serum vitamin D concentrations for several known confounding variables because data on demographic traits, dietary information and other health-related factors were available in NHANES. Because NHANES is based on a random sample survey methodology and is representative of the US population, the findings in this study may be applied to the US adult population at large. Cause and effect measurement is not feasible due to the cross-sectional nature of this study. Additionally, due to respondents’ inability to recall intakes precisely, food intakes of adults assessed using FFQ may be underreported. FFQ used in this study was qualitative in nature. Hence, the quantification of nutrients is not possible. It has been reported that the frequency of consumption of foods explained the most variance in food intake and quantification of foods add very little to the variance of food intake(Reference Noethlings, Hoffmann and Bergmann65).
Conclusion
In conclusion, in a multivariate-adjusted analysis, serum vitamin D concentration was inversely associated with the MPF pattern. A positive trend was observed between serum vitamin D and the VFWN pattern. But there was no association of serum vitamin D with the SSB pattern. From a health perspective, the population should be encouraged to consume less processed foods and to incorporate more healthy foods such as vegetables, fruits, nuts, whole grains and fish.
Acknowledgements
None.
Conceptualisation, V. G., Z. S. and T. A. A.; Writing—original draft preparation, V. G., T. A. A. , D. A. H.; Y. A., D. K. and H. E.; Writing—review and editing, V. G., Z. S., T. A. A., D. A. H.; Y. A., D. K. and H. E.; Methods, V. G., Z. S., T. A. A., D. A. H.; Y. A., D. K. and H. E.; Supervision, V. G.; Data analysis, Z. S., Interpretation of results, V. G. and Z. S.; Funding acquisition, V. G. All authors have read and agreed to the published version.
All authors declare no conflicts of interest.


