


Dietary intake during the toddler years (1 to 3 years old) is increasingly recognised as an important factor influencing the development of adiposity during childhood( Reference Gunther, Buyken and Kroke 1 , Reference Garden, Marks and Almqvist 2 ). Adiposity in childhood leading to higher risks of morbidity, mortality and metabolic diseases in later life is well documented( Reference Dietz 3 – Reference Maffeis and Tato 6 ). Major dietary changes occur during the toddler years( Reference Saavedra, Deming and Dattilo 7 ), as children progressively transit to family foods as part of complementary feeding( 8 ). The Feeding Infants and Toddlers (FITS) study 2002 reported that unhealthy eating patterns appeared as young as 9 to 11 months old( Reference Fox, Pac and Devaney 9 ) but more importantly, dietary patterns were set as early as 18 months of age( Reference Saavedra, Deming and Dattilo 7 ). There is now strong evidence to suggest that eating habits established in early life can track into late childhood( Reference Bjelland, Brantsaeter and Haugen 10 ) and even adulthood( Reference Movassagh, Baxter-Jones and Kontulainen 11 , Reference Mikkila, Rasanen and Raitakari 12 ). Given the long-term consequences of dietary intakes during the toddler years, there is a pertinent need to evaluate dietary intakes in toddlers.
Of the various dietary assessment tools, the FFQ has been widely used to examine dietary intakes of toddlers( Reference Blum, Wei and Rockett 13 – Reference Schaafsma, Deurenberg and Calame 21 ). Although quantifying absolute intakes with an FFQ is less accurate compared with food records and 24 h recalls (24HR), it can provide information on habitual intake over a longer time period. Furthermore, the FFQ has comparatively lower respondent burden, cost of administration and ease of data management( Reference Thompson and Subar 22 ), thus is suitable for use in large epidemiological studies.
However, existing studies using the FFQ in toddlers are mostly in Caucasian populations( Reference Blum, Wei and Rockett 13 – Reference Sochacka-Tatara and Pac 20 ). In Asia, FFQ have been developed for children over a wide range of age (e.g. 6 months to 12 years of age) in the South East Asian Nutrition Survey (SEANUTS) study( Reference Fatihah, Ng and Hazwanie 23 ), but none is specifically available for a younger age group.
A dietary assessment tool is validated by comparing it with an independent reference method, such as weighed dietary records, 24HR or urinary/blood biomarkers( Reference Thompson and Subar 22 , Reference Cade, Thompson and Burley 24 ), which also aim to reflect true habitual dietary intake. In the present study, we used data from the Growing Up in Singapore Towards Healthy Outcomes (GUSTO) cohort to validate an FFQ developed for 18-month-old toddlers. The reference method used in the present study is an average of two non-consecutive 24HR.
Methods
Study design
The present study is based on the GUSTO cohort( Reference Soh, Tint and Gluckman 25 ). Pregnant women aged 18 years or above were recruited from two major public maternity units in Singapore: KK Women’s and Children’s Hospital (KKH) and National University Hospital (NUH), between June 2009 and September 2010 during their first-trimester ultrasound scan. These women are either citizens or permanent residents of Singapore and of Chinese, Indian or Malay ethnicity with homogeneous parental ethnic background. Additionally, only those who expressed intentions to deliver in NUH or KKH, to reside in Singapore for the next 5 years and agreed to donate birth tissues (e.g. cord, placenta and cord blood) are included in the GUSTO study. However, women who received or are receiving chemotherapy and psychotropic drugs, and women who have or have had type 1 diabetes mellitus, are excluded from the study. The self-administered FFQ was provided to mothers for completion at home two weeks prior to the 18th-month clinic visit. This study is granted ethical approval by both the Institutional Review Boards at KKH and NUH. Written consent was obtained from all participants as well.
Maternal and child demographic characteristics
Maternal demographic characteristics regarding education level, marital status, household income and ethnicity were collected from the mothers during the recruitment clinic visit at <14 weeks of gestation. Data on pre-pregnancy BMI was calculated using self-reported pre-pregnancy height and weight at study enrolment. Based on the BMI (kg/m2) cut-offs for Asian populations, mothers were classified as underweight (<18·5), normal (18·5–22·9), overweight (23·0–27·4) and obese (≥27·5)( Reference WHO Expert Consultation 26 ).
Child characteristics regarding gender, birth order and gestational age at delivery were extracted from birth delivery reports. Anthropometrics were measured during the 18th-month clinic visit by trained clinic personnel. Child length was measured using an infant mat (SECA 210 mobile measuring mat), recorded to the nearest 0·1 cm. Child weight was measured in duplicate and recorded to the nearest gram using a SECA 334 weighing scale. Duplicate measurements were averaged respectively. Using the WHO Child Growth Standards 2006, child weight and length were converted to BMI Z-scores using the WHO Anthro software version 3.2.2.
Dietary assessment tools
Month 18 FFQ
Two weeks prior the 18th-month clinic visit, mothers were reminded over the telephone to complete the FFQ at home and return it to clinic staff during the upcoming clinic visit. These FFQ were returned during the 18th-month clinic visit (Fig. 1). The list of food items in the FFQ was created based on data from food records (24HR and 3d food diaries) collected from the GUSTO children at 12 months and with reference to the validated Southampton Women’s Survey 12 Month Infancy Questionnaire( Reference Marriott, Inskip and Borland 27 ). Inputs from paediatric dietitians were also sought to include foods commonly consumed at 18 months of age. A total of ninety-four food items were identified and categorised into twelve food groups: (i) bread; (ii) bread spreads; (iii) breakfast cereals; (iv) rice porridge and noodles; (v) potatoes and pasta; (vi) vegetables and bean curd; (vii) fruits; (viii) meat and fish; (ix) eggs; (x) cakes, biscuits and snacks; (xi) milk and dairy products; and (xii) other beverages. The FFQ also included eleven general questions on food preparation methods, eating habits and practices and an open-ended section to capture additional food items not listed in the FFQ. Mothers had to indicate the frequency of consumption over the past month as ‘never’, ‘number of times per month’, ‘number of times per week’ or ‘number of times per day’. In addition, they had to indicate a typical serving size for each food item. To assist mothers in quantifying their toddler’s food and beverage intakes, photographs of standardised household measuring utensils and food pictures were presented. An instruction sheet was also included to guide the mothers in filling out the FFQ.
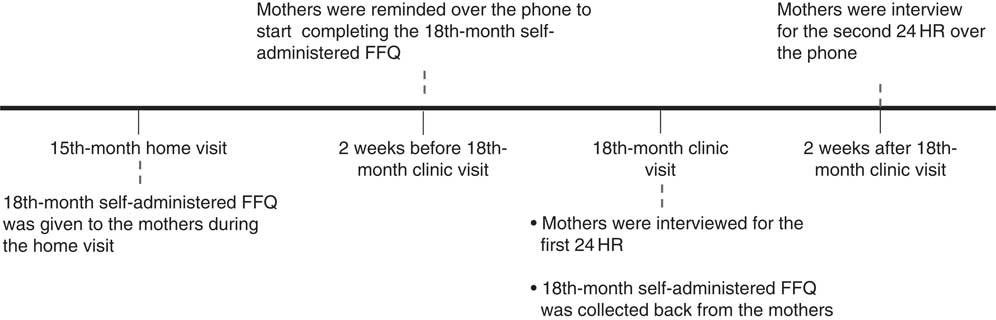
Fig. 1 The timeline of the dietary assessments that were conducted before, during and after the 18-month clinic visit (24HR, 24 h recall)
Two non-consecutive 24 h recalls
The first 24HR was administered to all mothers during the 18th-month clinic visit. For validation purposes, mothers who completed the FFQ and the first 24HR were interviewed over the telephone for a second 24HR two weeks after the clinic visit (Fig. 1)( Reference Willett 28 ). Mothers reported the intake of their toddlers with reference to commonly found household measuring utensils. All 24HR interviews were performed by trained researchers following the five-step multiple-pass method( Reference Conway, Ingwersen and Vinyard 29 ).
Nutrient intake assessment
Nutrient intakes from both the FFQ and 24HR were analysed using Dietplan (Forestfield Software), a nutrient analysis software which consists of a food composition database of locally available foods( 30 ). For composite dishes not present in the database, nutrient analyses were conducted using recipes or a similar composite dish if ingredients were not reported. Nutrient information of food items not found in the database was obtained from either food labels or the US Department of Agriculture’s national nutrient database( 31 ).
Nutrient composition of each FFQ food item was established using the weighted values of its composite foods from the food composition database. Calculation of food intake (grams per day) was done by multiplying consumption frequency with the reported serving size. For the 24HR, nutrient intakes were analysed from two typical non-consecutive 24HR and were averaged to reflect a day’s intake.
For toddlers who were bottle-fed, milk intake was calculated based on reported volumes of milk (includes formula milk and expressed breast milk). Toddlers who are directly breast-fed are assumed to consume 600 ml of breast milk daily as described by Ponza et al. ( Reference Ponza, Devaney and Ziegler 32 ). For toddlers who consumed both breast milk and formula milk, unmeasured breast milk via direct breast-feeding was quantified by subtracting reported volumes of expressed breast milk and formula milk from 600 ml. The nutrient composition of breast milk was estimated from nutrient contents of breast milk samples detailed by Dewey et al. ( Reference Dewey, Finley and Lonnerdal 33 ). Estimations of breast milk volume and nutrient composition were applicable to only 12 % of participants (n 65) who indicated consumption of breast milk at 18 months old.
Statistical methods
Descriptive characteristics of mother–toddler pairs included in the validation analyses (n 188) were compared with others in the GUSTO cohort (n 907 for maternal characteristics and n 915 for child characteristics) using the independent t test for continuous data and the χ 2 test for categorical data. The descriptive statistics were reported as means and sd for continuous variables and as percentages for categorical variables. The Wilcoxon signed-rank test was performed to compare the absolute nutrient intakes assessed by the two non-consecutive 24HR.
The Wilcoxon signed-rank test was applied to investigate differences between absolute nutrient intakes assessed by the FFQ and the averaged 24HR. Percentage difference in nutrient intakes between both methods was calculated by taking the median of the difference as a percentage of nutrient intakes derived from the averaged 24HR.
To improve normality for absolute intakes of energy, protein, cholesterol, fibre, Na, vitamin A and β-carotene, logarithmic transformation was applied on the crude data of these nutrients. All nutrients were then adjusted for energy intake using the residual method described by Willett et al. ( Reference Willett, Howe and Kushi 34 ) to remove variation due to energy intake.
The relationship between nutrients derived from the two assessment tools was analysed by Spearman’s rank-order correlation for both absolute and energy-adjusted nutrient intakes. To further adjust for intra-individual variation in the two 24HR, Spearman’s correlation coefficient (r) was de-attenuated by multiplication with an error term( Reference Willett 28 , Reference Liu, Stamler and Dyer 35 ). Within- and between-person variances in the error term were obtained from an ANOVA model.
Cross-classification analysis was used to evaluate the ability of the FFQ to rank participants according to their nutrient intakes assessed by the averaged 24HR (reference method). Participants were categorised into quartiles according to their energy-adjusted nutrient intakes. Results are presented as percentages of participants classified into the following four categories: (i) same quartile (correctly classified); (ii) adjacent quartile; (iii) one quartile apart; and (iv) extreme quartiles (grossly misclassified).
The Bland–Altman method( Reference Bland and Altman 36 ) was performed to study the level of agreement between the FFQ and the averaged non-consecutive 24HR in two aspects. The agreement of the two assessment methods on average was estimated by the mean difference (đ) in nutrient intakes between FFQ and 24HR. The agreement of nutrient intake measurements for individual participants was assessed by the percentage of participants within the limits of agreement (LOA). The LOA, calculated as đ±1·96 sd of the differences in nutrient intake between FFQ and 24HR, defines a range where 95 % of the data points are expected to lie( Reference Bland and Altman 37 ). Bland–Altman plots of difference against the mean were also constructed to investigate for relationship between measurement error and true intake.
From the 1103 participants at the 18th-month clinic visit, 674 returned the FFQ, of which 113 were disqualified due to lack of study identification number (n 2) or had twenty or more questions unanswered (n 111). From the remaining 561 participants, 361 participants provided two complete 24HR reflective of typical intake, of which 188 participants were randomly selected as the final sample for the validation analyses (Fig. 2). A reasonable sample size for a validation study is estimated to be in the range of 100–200 participants( Reference Thompson and Subar 22 ).
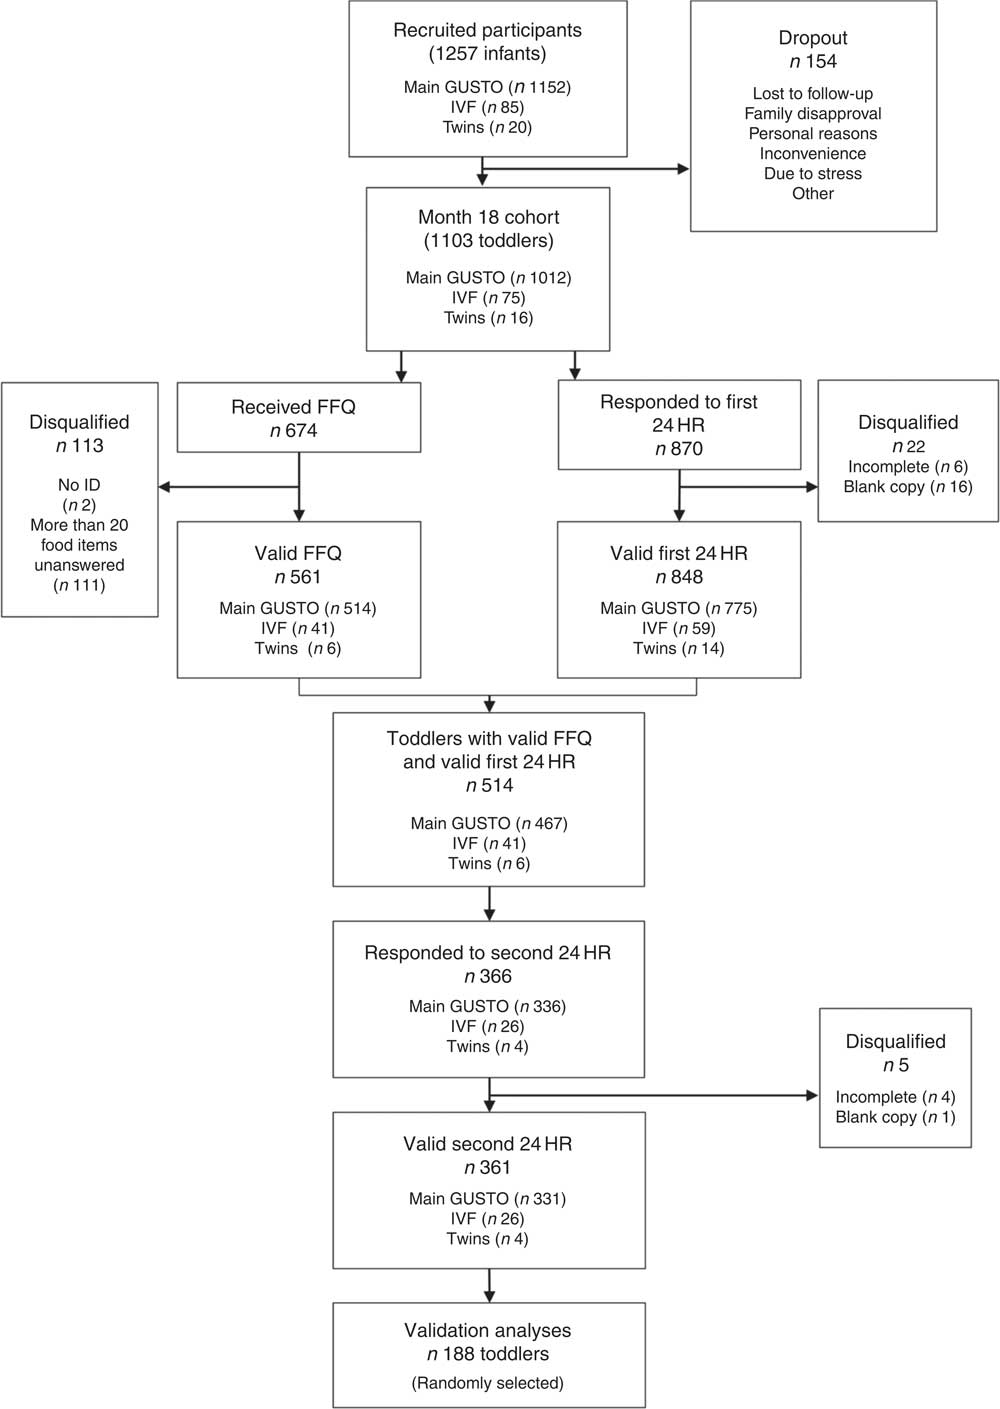
Fig. 2 Outline of the participants in the validation study. From a total of 1257 infants recruited at the beginning of the Growing Up in Singapore Towards Healthy Outcomes (GUSTO) study, there were 154 dropouts between recruitment and the month 18th-month clinic visit, resulting in 1103 toddlers remaining. From the 1103 toddlers, 514 provided both a valid FFQ and a first 24 h recall (24HR), of which 361 provided a valid second 24HR. Out of the 361 toddlers, we randomly selected 188 for our validation analyses (IVF, in vitro fertilisation)
The final sample (n 188) is sufficiently powered for Bland–Altman (n>100) and correlation analyses (n 100–200)( Reference Cade, Thompson and Burley 24 ). All statistical analyses were performed using the statistical software package IBM SPSS Statistics version 23. A two-tailed P value of <0·05 was considered statistically significant.
Results
Maternal and child characteristics of participants in the validation sample (n 188) were mostly similar to those of other participants in the GUSTO cohort (Table 1). The validation sample appeared to have a smaller proportion of male toddlers (45·2 v. 54·1 %) and a larger proportion of mothers with normal pre-pregnancy BMI (37·8 v. 32·0 %) than others in the GUSTO cohort.
Table 1 Maternal and child characteristics of participants included and excluded in the FFQ validation analysis of the Growing Up in Singapore Towards Healthy Outcomes (GUSTO) study

* P<0·05.
† P values across both groups were determined with the use of the t test for continuous variables and χ 2 analysis for categorical variables.
‡ Missing values for validation sample: n 187 for ‘Education’, n 183 for ‘Marital status’, n 178 for ‘Monthly household income’, n 154 for ‘Pre-pregnancy BMI’ and n 158 for ‘Anthropometric measurement’. Missing values for main cohort: n 892 for ‘Education’, n 887 for ‘Marital status’, n 884 for ‘Monthly household income’, n 572 for ‘Pre-pregnancy BMI’ and n 899 for ‘Anthropometric measurement’.
No significant differences in absolute intakes of energy and most nutrients were observed between the first and second 24HR, except for protein, cholesterol, fibre and Na. For these nutrients, the median differences were small (see online supplementary material, Supplemental Table 1).
Median absolute macro- and micronutrients intakes calculated from the FFQ and the average of the two 24HR are compared in Table 2. From the calculated median differences, it is apparent that the FFQ reported significantly higher estimates compared with the averaged 24HR across all nutrients (P<0·001), except for vitamin A (P=0·09). Median nutrient intakes were overestimated by 9·1 to 19·6 % for all macronutrients and micronutrients, and by greater percentages for β-carotene (70·0 %), cholesterol (62·7 %), fibre (44·0 %) and Na (29·2 %).
Table 2 Comparison of absolute nutrient intakes estimated from the FFQ and average of two 24 h recalls (24HR) among 18-month-old toddlers (n 188) in the FFQ validation analysis of the Growing Up in Singapore Towards Healthy Outcomes (GUSTO) study
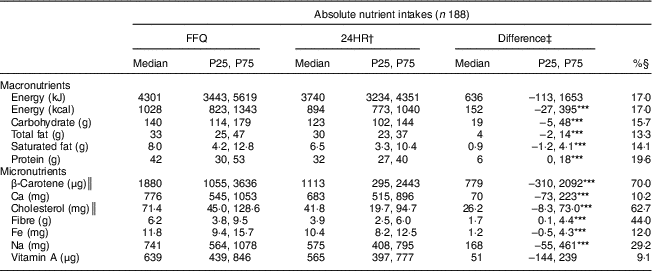
P25, 25th percentile; P75, 75th percentile.
***P<0.001; P values were determined with the use of the Wilcoxon signed-rank test.
† Nutrient intakes from the 24HR are obtained from an average of two non-consecutive 24HR.
‡ Difference in nutrient intakes performed using the difference in absolute nutrient intakes between the FFQ and 24HR (FFQ – 24HR).
§ Median of difference as a percentage of nutrient intakes derived from the averaged 24HR.
║ Missing values for 24HR: n 186 for ‘β-Carotene’ and n 185 for ‘Cholesterol’.
In correlation analyses of absolute macronutrient intakes between the FFQ and 24HR, the highest and lowest correlated macronutrients were saturated fat (r=0·66) and energy (r=0·42) intakes, respectively (Table 3). Expectedly, after adjustment for energy, r for macronutrients increased to 0·78 for saturated fat and 0·56 for carbohydrate, total fat and protein. De-attenuation of the energy-adjusted r showed a further increase in r values to 0·96 for saturated fat, 0·77 for carbohydrate, 0·62 for total fat and 0·58 for protein. For micronutrients, we observed a similar positive shift in the range of r after energy adjustment (0·40 for Na; 0·54 for fibre) and de-attenuation (0·45 for Na; 0·65 for fibre). Adjustment for energy intake and de-attenuation generally resulted in improved r for all nutrients, particularly for saturated fat (r=0·96), Ca (r=0·95) and β-carotene (r=0·80). Correlation coefficients of all nutrients were significant (P<0·001). Ratios of within- and between-person variances in the error term are not presented.
Table 3 Spearman rank-order correlation coefficients (r) of associations of absolute, energy-adjusted and de-atteunated nutrient intakes between the FFQ and average of two 24 h recalls (24HR) among 18-month-old toddlers (n 188) in the FFQ validation analysis of the Growing Up in Singapore Towards Healthy Outcomes (GUSTO) study

*** P<0.001.
† Adjusted for energy intake using the residual method. All except fat, carbohydrate, saturated fat, Ca and Fe were log-transformed before energy adjustment.
‡ De-attenuated r was calculated by multiplying raw r with an error term from ANOVA.
§ Missing values for 24HR: n 186 for ‘β-Carotene’ and n 185 for ‘Cholesterol’.
Cross-classification analyses based on energy-adjusted nutrient intakes from the FFQ and averaged 24HR revealed that the proportion of participants correctly classified varied from 43·6 % (total fat) to 65·4 % (saturated fat) for macronutrients and from 34·6 % (β-carotene) to 51·1 % (Ca) for micronutrients (Table 4). When the percentages of participants classified in the same and adjacent quartiles were combined, the proportion of participants increased and ranged from 82·4 % (protein) to 94·1 % (saturated fat) for macronutrients and from 77·7 % (β-carotene) to 92·6 % (Ca) for micronutrients. In contrast, the percentage of gross misclassification was low for both macronutrients (≤3·2 %) and micronutrients (≤6·4 %).
Table 4 Cross-classification into quartiles according to energy-adjusted nutrient intakes estimated by the FFQ and the average of two 24 h recalls (24HR) of 18-month-old toddlers (n 188) in the FFQ validation analysis of the Growing Up in Singapore Towards Healthy Outcomes (GUSTO) study

† Adjusted for energy intake using the residual method. All except fat, carbohydrate, saturated fat, Ca and Fe were log-transformed before energy adjustment.
‡ Missing values for 24HR: n 186 for ‘β-Carotene’ and n 185 for ‘Cholesterol’.
In general, the energy-adjusted Bland–Altman plots of macronutrients (Fig. 3) and micronutrients (online supplementary material, Supplemental Fig. 1) were widely scattered and did not seem to show any clear systematic increase in intake differences with increasing mean intake. The Bland–Altman plots revealed that >95 % of the participants were within the LOA for saturated fat, Ca, cholesterol and fibre, and >93 % of the participants were detected within the LOA for the remaining macro- and micronutrients. Based on the results of the Bland–Altman analysis of absolute nutrient intakes (Supplemental Table 2), positive đ values were observed for all macro- and micronutrients, except for absolute vitamin A intake (đ=−13 μg).
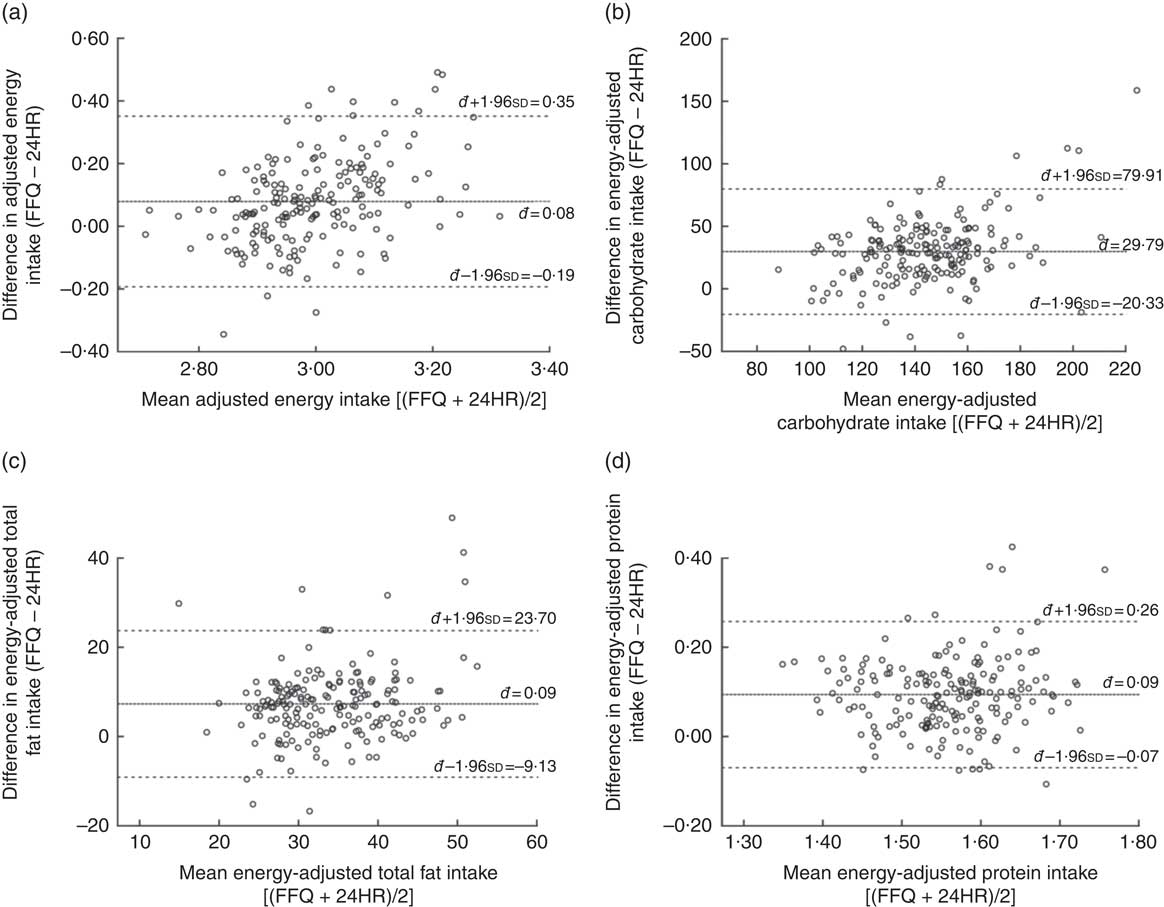
Fig. 3 Bland–Altman plots assessing the relative validity of the semi-quantitative FFQ designed to assess dietary intakes of 18-month-old toddlers in the Growing Up in Singapore Towards Healthy Outcomes (GUSTO) study. The difference in intake between the FFQ and the average of two 24 h recalls (24HR) is plotted v. the mean intake from the two methods for: (a) energy, (b) carbohydrate, (c) total fat and (d) protein. —— represents the mean difference (bias) and – – – – – represent the limits of agreement
Discussion
In the present paper, we discussed the validity of a self-administered FFQ, developed to assess nutrient intakes of 18-month-old toddlers, by comparison with the average of two non-consecutive 24HR.
We observed that the FFQ tended to overestimate absolute nutrient intakes compared with food recalls, particularly for β-carotene (70·0 %) and cholesterol (62·7 %). However, the tendency of FFQ to overestimate is known and is a common observation in previous validation studies conducted among 12-month-old infants from the UK( Reference Marriott, Inskip and Borland 27 ) and Norway( Reference Andersen, Lande and Arsky 18 ). This was also found in a longitudinal study of 1–3-year-old children at risk of type 1 diabetes( Reference Parrish, Marshall and Krebs 38 ) and in cross-sectional studies conducted among 0–24-month-old Hispanic toddlers( Reference Palacios, Rivas-Tumanyan and Santiago-Rodriguez 39 ) and 12–24-month-old New Zealand toddlers( Reference Watson, Heath and Taylor 40 ).
Correlation results revealed that all estimated nutrient intakes from the FFQ were positively associated with those from the 24HR. The reported correlations for all nutrients were satisfactory, based on cut-offs suggested by Cade et al. (r>0·3 or 0·4)( Reference Cade, Thompson and Burley 24 ) and Willett (0·4<r<0·7)( Reference Willett 41 ). When compared against absolute nutrient intakes, energy adjustment of nutrient intakes improved correlation results. Energy-adjusted values are more appropriate than absolute nutrient intakes in analyses as the latter is more likely to have a larger effect on participants with a low-energy diet than those with an energy-dense diet( Reference Willett 28 ). Good de-attenuated correlations (r ≥ 0·7) for carbohydrate, saturated fat, β-carotene, Ca and Fe are worth noting even though it was not observed for all nutrients. Nevertheless, when compared with other FFQ validation studies investigating dietary intake of toddlers, our results concurred with most studies( Reference Blum, Wei and Rockett 13 , Reference Andersen, Lande and Arsky 18 , Reference Andersen, Lande and Trygg 19 , Reference Marriott, Inskip and Borland 27 , Reference Watson, Heath and Taylor 40 ), if not performed better( Reference Andersen, Lande and Trygg 19 , Reference Sochacka-Tatara and Pac 20 , Reference Palacios, Rivas-Tumanyan and Santiago-Rodriguez 39 ). Our findings demonstrated a higher range of de-attenuated r from 0·45 to 0·96 compared with a prospective cohort study of Polish children( Reference Sochacka-Tatara and Pac 20 ) where de-attenuated r ranged from 0·27 to 0·67 and a cross-sectional study of Hispanic toddlers where range of de-attenuated r was from 0·26 to 0·77( Reference Palacios, Rivas-Tumanyan and Santiago-Rodriguez 39 ).
Across all nutrients, the proportion of correctly classified participants was large and ranged from 34·6 to 65·4 %. This compares well with earlier findings reported in Hispanic toddlers (25·7–56·0 %)( Reference Palacios, Rivas-Tumanyan and Santiago-Rodriguez 39 ), Norwegian infants (31·0–56·0 %)( Reference Andersen, Lande and Arsky 18 ) and children (35–48 %)( Reference Andersen, Lande and Trygg 19 ). The small proportions of grossly misclassified toddlers (1·1–6·4 %) fit well with observations among 12-month-old infants (0–9 %)( Reference Andersen, Lande and Arsky 18 ) and 2-year-old Norwegian children (1–6 %)( Reference Andersen, Lande and Trygg 19 ). Evidence of good ranking ability of the FFQ from the cross-classification analysis strengthened our confidence that it is a useful tool in assessing energy-adjusted nutrient intakes of 18-month-old toddlers.
There was no obvious heteroscedastic relationship between measurement bias and true macro- and micronutrient intakes (estimated by average of FFQ and 24HR) detected in the energy-adjusted Bland–Altman plots. All energy-adjusted macro- and micronutrients had 93–97 % of participants within the LOA, which falls within the proposed threshold of 95 %( Reference Bland and Altman 37 ), suggesting that the FFQ has satisfactory agreement for individual participants when energy-adjusted values are used.
To the best of our knowledge, the present work is the first that made use of an FFQ to examine dietary intakes of toddlers in Singapore. Strengths of our study include the study among a multi-ethnic Asian population, the assessment of dietary intake during the critical period when major diet changes were expected to occur, the correction of intra-individual variation between two 24HR and the inclusion of nutrient intakes from breast milk and formula milk, which are found to be substantial sources of total energy and protein intakes in toddlers( Reference Scott, Davey and Ahwong 42 , Reference Lim, Toh and Lee 43 ).
Two limitations of our study are worth noting. First, our primary source of Na intake information was based solely on the foods reported in the FFQ. This may not be a good representation of the toddler’s Na intake as it does not take into consideration discretionary salt added at the table or during preparation and cooking. Quantifying precise Na intake requires measurements of urinary Na( Reference McLean 44 ), which was not done in our study. Second, for practical reasons, the 24HR could not be administered within the same time period corresponding to the FFQ. We acknowledge that this may result in the 24HR estimates being not completely representative of the toddler’s habitual intake during the time interval in question. However, it is unlikely for major changes in a toddler’s diet to take place within a few weeks and we have also shown largely similar nutrient intakes between both 24HR (Supplemental Table 1).
Conclusion
In the present paper, we investigated the validity of our FFQ in estimating nutrient intakes of 18-month-old toddlers. Taken together, results from the study suggest that the FFQ is an appropriate instrument tool not only for assessment of energy-adjusted nutrient intakes but also for ranking toddlers into quartiles according to intakes, at 18 months of age. This FFQ could potentially be replicated to assess and understand toddlers’ nutrient intakes in other multi-ethnic populations.
Acknowledgements
Acknowledgements: This study acknowledges the contribution of the rest of the GUSTO study group, which includes the following: Allan Sheppard, Amutha Chinnadurai, Anne Eng Neo Goh, Anne Rifkin-Graboi, Anqi Qiu, Arijit Biswas, Bee Wah Lee, Birit F.P. Broekman, Boon Long Quah, Borys Shuter, Chai Kiat Chng, Cheryl Ngo, Choon Looi Bong, Christiani Jeyakumar Henry, Cornelia Yin Ing Chee, Yam Thiam Daniel Goh, Doris Fok, Fabian Yap, George Seow Heong Yeo, Helen Chen, Hugo P.S. van Bever, Iliana Magiati, Inez Bik Yun Wong, Ivy Yee-Man Lau, Jeevesh Kapur, Jenny L. Richmond, Jerry Kok Yen Chan, Joanna D. Holbrook, Joshua J. Gooley, Keith M. Godfrey, Kenneth Kwek, Kok Hian Tan, Krishnamoorthy Niduvaje, Leher Singh, Lin Lin Su, Lourdes Mary Daniel, Lynette P Shek, Marielle V. Fortier, Mark Hanson, Mary Foong-Fong Chong, Mary Rauff, Mei Chien Chua, Michael Meaney, Mya Thway Tint, Neerja Karnani, Ngee Lek, Oon Hoe Teoh, P.C. Wong, Peter D. Gluckman, Pratibha Agarwal, Rob M. van Dam, Salome A. Rebello, Seang-Mei Saw, Shang Chee Chong, Shirong Cai, Shu-E Soh, Sok Bee Lim, Chin-Ying Stephen Hsu, Victor Samuel Rajadurai, Walter Stunkel, Wee Meng Han, Wei Wei Pang, Yap-Seng Chong, Yin Bun Cheung, Yiong Huak Chan and Yung Seng Lee. Financial support: This research is supported by the Singapore National Research Foundation under its Translational and Clinical Research (TCR) Flagship Programme and administered by the Singapore Ministry of Health’s National Medical Research Council (NMRC), Singapore (grant numbers NMRC/TCR/004-NUS/2008 and NMRC/TCR/012-NUHS/2014). K.M.G. is supported by the UK Medical Research Council (grant number MC_UU_12011/4); the National Institute for Health Research (as an NIHR Senior Investigator (grant number NF-SI-0515-10042) and through the NIHR Southampton Biomedical Research Centre); and the European Union’s Erasmus+ Capacity-Building ENeASEA Project and Seventh Framework Programme (FP7/2007-2013), projects EarlyNutrition and ODIN (grant agreement numbers 289346 and 613977). Additional funding is provided by the Singapore Institute for Clinical Sciences, Agency for Science Technology and Research (A*STAR), Singapore. The funders had no role in the design, analysis or writing of this article. Conflict of interest: Y.-S.C., K.M.G. and Y.S.L have received reimbursement for speaking at conferences sponsored by companies selling nutritional products. Y.-S.C. and K.M.G. are part of an academic consortium that has received research funding from Abbot Nutrition, Nestec and Danone. None of the other authors report any potential conflict of interest. Authorship: H.X.L. and M.F.-F.C. designed the research; K.H.T., Y.-S.C., F.Y., K.M.G. and Y.S.L. designed and led the GUSTO study; H.X.L. and J.Y.T. contributed to data collection, cleaning and analysis of data; H.X.L. performed the statistical analysis; M.F.-F.C. provided statistical inputs, contributed to the interpretation of results and critically reviewed the manuscript; H.X.L. and M.F.-F.C. wrote the manuscript and had primary responsibility for the final content of the manuscript; all authors have read and approved the final manuscript. Ethics of human subject participation: This study was conducted according to the guidelines laid down in the Declaration of Helsinki and all procedures were approved by the Institutional Review Boards at KK Women’s and Children’s Hospital and National University Hospital. Written consent was obtained from all participants.
Supplementary material
To view supplementary material for this article, please visit https://doi.org/10.1017/S1368980019000557


