


Introduction
Several studies have shown that the expected growth of the world's population to almost 9 billion by 2050, dietary changes, and increase in biofuel consumption will increase the agricultural demand by some 50% compared to 2013 (FAO, 2017; Hoegh-Guldberg et al., Reference Hoegh-Guldberg, Jacob, Taylor, Bindi, Brown, Camilloni, Diedhiou, Djalante, Ebi, Engelbrecht, Guiot, Hijioka, Mehrotra, Payne, Seneviratne, Thomas, Warren and Zhou2018; Searchinger et al., Reference Searchinger, Hanson, Ranganathan, Lipinski, Waite, Winterbottom, Dinshaw and Heimlich2019). At the same time, satisfying increased agricultural demand is a challenge due to several factors, such as political instabilities (Macours and Swinnen, Reference Macours and Swinnen2000), pest and disease outbreaks (Oerke, Reference Oerke2006), decrease of available arable land, soil salinization, water scarcity, deforestation, land degradation and changes of climate conditions (Ciais et al., Reference Ciais, Reichstein, Viovy, Granier, Ogée, Allard, Aubinet, Buchmann, Bernhofer, Carrara, Chevallier, De Noblet, Friend, Friedlingstein, Grünwald, Heinesch, Keronen, Knohl, Krinner, Loustau, Manca, Matteucci, Miglietta, Ourcival, Papale, Pilegaard, Rambal, Seufert, Soussana, Sanz, Schulze, Vesala and Valentini2005; Herbert et al., Reference Herbert, Boon, Burgin, Neubauer, Franklin, Ardon, Hopfensperger, Lamers and Gell2015).
Different authors (Chen et al., Reference Chen, McCarl and Schimmelpfennig2004; Osborne and Wheeler, Reference Osborne and Wheeler2013; Ray et al., Reference Ray, Gerber, MacDonald and West2015; Najafi et al., Reference Najafi, Pal and Khanbilvardi2019) have demonstrated that climate variability and their teleconnections have led to changes in maize, rice, wheat and soybean crop yields at different scales. Their results show that 60% of the crop yield variability is related to regional climate, whilst global climate variability accounts for roughly a third (32–39%) of the total crop yield variability.
Specifically, the agriculture in Europe is characterized by high-quality production and by a variety of locally adapted farming systems; therefore, it is highly vulnerable to regional climate variability and localized extreme meteorological events.
Recently, Nobre et al. (Reference Nobre, Hunink, Aerts and Ward2019) have shown the importance of climate variability in driving the interannual changes of meteorological variables. These authors have shown that teleconnection indices (ENSO, North Atlantic Oscillation (NAO), Scandinavian Pattern, East Atlantic Pattern, and East Atlantic/West Russian Pattern) have an influence on the regional precipitation patterns and on the regional agricultural production. Considering NAO, for example, although its influence is more evident for north European areas, some studies demonstrate that NAO also impacts on weather variables in the Mediterranean at a local scale (Del Pozo et al., Reference Del Pozo, Brunel-Saldias, Engler, Ortega-Farias, Acevedo-Opazo, Lobos, Jara-Rojas and Molina-Montenegro2019), which are correlated with grapevine yield and quality (Dalla Marta et al., Reference Dalla Marta, Grifoni, Mancini, Storchi, Zipoli and Orlandini2010), wheat yield (Dalla Marta et al., Reference Dalla Marta, Grifoni, Mancini, Zipoli and Orlandini2011) and olive pollen production (Avolio et al., Reference Avolio, Pasqualoni, Federico, Fornaciari, Bonofiglio, Orlandi, Bellecci and Romano2008).
The climatic trend has also a sensitive effect on Mediterranean tree crops, and winter weather plays a key role. When temperature drops below −10°C, olive trees are stressed and start showing physiological changes that, in extreme cases, can lead to plant death (Barranco and Ruiz, Reference Barranco and Ruiz2005). Nevertheless, the most vulnerable phase of olives is flowering. Bonofiglio et al. (Reference Bonofiglio, Orlandi, Sgromo, Romano and Fornaciari2008) confirmed that 30°C is a threshold above which the development of the ovary pollen tube can be inhibited. In Italy, flowering occurs in late spring when temperatures rarely reach those extreme values. Haworth et al. (Reference Haworth, Marino, Brunetti, Killi, De Carlo and Centritto2018) observed that when temperatures exceed 40°C, plant photosynthetic and vegetative activity stops.
On the other hand, during recent decades, with the aim of responding to an increasing demand for quality and quantity of crop yields, farmers have made great progress in agricultural techniques. In particular, the agricultural technology, the introduction of new cultivars and the dynamic changes in fertilization practices can affect the most important crop yields (Fontana et al., Reference Fontana, Toreti, Ceglar and De Sanctis2015; Agnolucci and De Lipsis, Reference Agnolucci and De Lipsis2019). Parent et al. (Reference Parent, Leclere, Lacube, Semenov, Welcker, Martre and Tardieu2018) have shown how farmer's adaptation measures and strategies can reduce the maize yield gradient among European sub-regions. An increase in maize production can be obtained by using genetic variation of the crop cycle duration. Sunflower, instead, despite its high tolerance to water stress can increase yields by 53% when fully irrigated (Demir et al., Reference Demir, Goksoy, Buyukcangaz, Turan and Koksal2006). In particular, the most sensitive phase to water scarcity is flowering, followed by seed formation (Yawson et al., Reference Yawson, Bonsu, Arman and Afrifa2011; Verdi et al., Reference Verdi, Napoli, Santoni, Dalla Marta and Ceccherini2019). However, due to different factors such as climatic areas, crop variety and agricultural management strategies, and irrigation strategies, sunflower has a wider water consumption from 200 to 900 mm (Erdem et al., Reference Erdem, Delibas and Orta2001) that require specific consideration to ensure high yields. Thus, these adaptation measures strongly depend on a good knowledge of the regional climate variability. Numerous studies have shown, for example, that an appropriate irrigation of olive crops can improve yields and could be considered as a mitigation strategy for climate change (Iniesta et al., Reference Iniesta, Testi, Orgaz and Villalobos2009). Goldhamer et al. (Reference Goldhamer, Dunai and Ferguson1994) observed an increase in fruit yields of roughly 50% in irrigated system with respect to rainfed. For that reason, many studies show that much of yield variation between years occurs because of differences in the agricultural technology used, the effect of climate is difficult to detect from the raw yield data (Lu et al., Reference Lu, Carbone and Gao2017) and detrending of crop yield data is required. Several approaches are available to detrend a time series of data such as linear, non-linear, first-differencing. In our case, the linear approach has been used on barley, durum wheat, olives and sunflower, but no significant trend was identified. In light of this result, it is assumed that there have been no significant changes in these crops yield attributable to change in agriculture technology. In this sense, several authors observed how the climatic trend represents a factor that can significantly modify the agricultural productions (Dalla Marta et al., Reference Dalla Marta, Grifoni, Mancini, Storchi, Zipoli and Orlandini2010; Dalla Marta et al., Reference Dalla Marta, Grifoni, Mancini, Zipoli and Orlandini2011; Fontana et al., Reference Fontana, Toreti, Ceglar and De Sanctis2015). This is confirmed by Teasdale and Cavigelli (Reference Teasdale and Cavigelli2017) reporting as yield trends between conventional and organic agriculture, although with higher values in the conventional, follow the same trend driven by rainfall and temperature conditions. In a recent study investigating the links between the large-scale atmospheric circulation and European crop yields, Ceglar et al. (Reference Ceglar, Turco, Toreti and Doblas-Reyes2017) affirmed that technological improvements can only mask the effect of interannual variability on the trend of crop yields. Similarly, Agnolucci and De Lipsis (Reference Agnolucci and De Lipsis2019) stated that climatic trend represents the main affecting factor on crop yields, significantly exceeding other factors such as the use of fertilizers, genetic evolution, irrigation, etc.
The strong climate variability in the European region also results in a different vulnerability to climate change (Orlandini et al., Reference Orlandini, Nejedlik, Eitzinger, Alexandrov, Toulios, Calanca, Trnka and Olesenh2008, Reference Orlandini, Vicente-Serrano and Trigo2011). Bartolini et al. (Reference Bartolini, Messeri, Grifoni, Mannini and Orlandini2013), Vergni and Todisco (Reference Vergni and Todisco2011) and Orlandini et al. (Reference Orlandini, Nejedlik, Eitzinger, Alexandrov, Toulios, Calanca, Trnka and Olesenh2008) affirm that there is an increasing trend of precipitation in North Europe, while southern Europe is currently affected by a decrease in the annual precipitation and by a change in seasonal rainfall patterns. Brunetti et al. (Reference Brunetti, Buffoni, Mangianti, Maugeri and Nanni2004) observed that in Italy, as for other Mediterranean areas (Alpert et al., Reference Alpert, Ben-Gai, Baharad, Benjamini, Yekutieli, Colacino, Diodato, Ramis, Homar, Romero, Michaelides and Manes2002), there is a decrease in the number of days with precipitations, despite an increase in rainfall intensity. This trend was also confirmed by studies carried out in Tuscany region by Bartolini et al. (Reference Bartolini, Messeri, Grifoni, Mannini and Orlandini2013, Reference Bartolini, Grifoni, Magno, Torrigiani and Gozzini2018), who analysed temporal and spatial changes in precipitation from 1955 to 2013. The study showed how the effects of climate change are evident and have led to a variation in the rainfall regime in recent decades. In particular, a significant decrease in annual, winter and spring rainfall was observed in north-western areas and north-eastern Apennine Mountains but also a significant decrease in annual, winter and spring wet days was observed in all Tuscany areas. Crop phenology and yields are strictly related to climatic conditions and therefore they are sensitive indicators of climate change.
These variations in climate have an influence on the cropping systems by increasing nutrient leaching, runoff and soil erosion and by altering crop-specific water consumption, which are increasingly difficult to satisfy, especially for rainfed cultivations. Hence, agriculture must adopt new irrigation strategies to guarantee high and constant yields and in order to mitigate deleterious effects on the environment (i.e. soil degradation).
Concerning temperatures, a higher and faster increase of daily minimum than of daily maximum has been observed (IPCC, 2007). This situation results in a reduction of the mean diurnal temperature range (ΔTR) with potentially detrimental effects on evaporation and transpiration processes (Vergni et al., Reference Vergni, Todisco, Di Lena and Mannocchi2020). Nevertheless, this tendency is not homogeneous, and in Italy, ΔTR shows a large spatial variability and a positive tendency in the period 1865–1996 (Brunetti et al., Reference Brunetti, Buffoni, Mangianti, Maugeri and Nanni2004). This latter finding is related to the increasing occurrence of subtropical anticyclones over the western Mediterranean region producing clearer skies. On the contrary, Todisco and Vergni (Reference Todisco and Vergni2008) found a significant decrease in ΔTR in Central Italy, approximately from the half of the last century. However, there is a general agreement on the severe effects on Italian agriculture caused by the combined effect of global warming and precipitation.
Different studies have shown that average crop yields from Italian agriculture decreased by 5% over the last 30 years (Moore and Lobell, Reference Moore and Lobell2015). In extreme cases, as for barley and winter wheat, yield losses were up to 10%. Moreover, Ray et al. (Reference Ray, Gerber, MacDonald and West2015) affirmed that from 31 to 51% of wheat yield variability in Italy was caused by climate change. Orlandini et al. (Reference Orlandini, Nejedlik, Eitzinger, Alexandrov, Toulios, Calanca, Trnka and Olesenh2008) and Kukal and Irmak (Reference Kukal and Irmak2018) observed that climate change and variability are affecting crop yields in different ways based on the environmental zones. In particular, the main negative effects in Mediterranean countries are related to a number of factors, namely the reduction of growing season, seasonal climatic variability, drought, heat stresses, hailstorm, pest and disease attacks, weed development, soil erosion and nitrogen losses.
In this study, we analyse some teleconnection indices (Table 1), in particular: the NAO, Summer North Atlantic Oscillation (SNAO), the Intertropical Front (ITF) and the West African Monsoon (WAM) on interannual to decadal time scales, in order to relate their variability to the summer crop yields in Italy. The choice of these teleconnection indices is motivated by their impact on the central Mediterranean climate. When the winter NAO is in its negative phase, there is a precipitation increase over Italy, with the opposite occurring during its positive phase (Hurrell, Reference Hurrell1995; Hurrell et al., Reference Hurrell, Kushnir, Ottersen and Visbeck2003). While, when the summer SNAO is in its positive phase, there is a precipitation increase over Italy, with the opposite occurring during the negative phase (Folland et al., Reference Folland, Knight, Linderholm, Fereday, Ineson and Hurrell2009; Mariotti and Dell'Aquila, Reference Mariotti and Dell'Aquila2012). The WAM and its ITF have an influence on the southern Mediterranean climate patterns (Chen, Reference Chen2005; Alpert et al., Reference Alpert, Baldi, Ilani, Krichak, Price, Rodo, Saaroni, Ziv, Kishcha, Karkan, Mariotti, Xoplaki, Lionello, Malanotte-Rizzoli and Boscolo2006; Gaetani and Fontaine, Reference Gaetani and Fontaine2013).
Table 1. Teleconnection indices mentioned in the paper
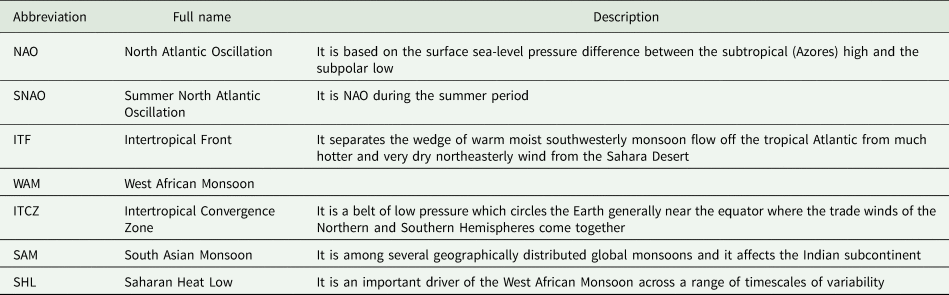
Rodwell and Hoskins (Reference Rodwell and Hoskins1996) have examined the subsidence of the South Asian Monsoon (SAM) over the eastern Mediterranean Sea and over North Africa; in periods of SAM's strong activity, this subsidence can reach the central Mediterranean region. Whilst Chen (Reference Chen2005) has examined the formation of the mid-tropospheric high over Libya; this high, in periods of WAM's strong activity, can invade the central Mediterranean region. The WAM index (Li and Zeng, Reference Li and Zeng2005) is strongly related to the summer precipitation in the region 10°N–20°N and 30°W–20°E, with teleconnections with Mediterranean region (Gaetani and Fontaine, Reference Gaetani and Fontaine2013). WAM's dynamics are rather complex, although African Outgoing Longwave Radiation (OLR) relates well with the 500 hPa heights over the central Mediterranean. The variability of the ITF ranges between 17°N and 21°N, and it is linked to the latitudinal position of WAM (Lélé and Lamb, Reference Lélé and Lamb2010). WAM originates in the Gulf of Guinea when the Intertropical Convergence Zone (ITCZ) makes its arrival, to establish itself at 10°N–12°N in its mature phase (Thorncroft et al., Reference Thorncroft, Nguyen, Zhang and Peyrille2011). In this phase, the southerly desert winds driven by the Saharan Heat Low (SHL) encounter the moist northerly monsoonal winds (Mathbout et al., Reference Mathbout, Lopez-Bustins, Royè, Martin-Vide and Benhamrouche2019). Thus, the precipitation over the Sudan-Sahel region is positively related to the ITF's latitude (Lélé and Lamb, Reference Lélé and Lamb2010). When the ITF is in its northernmost position, the Libyan high resides over the southern-central Mediterranean Sea, bringing hot and dry conditions over Italy.
Italian climate variability is related to these large-scale features, which have, in turn, an impact on the weather types over the Italian peninsula (Hess and Brezowsky, Reference Hess and Brezowsky1952; Lamb, Reference Lamb1972). In this work, we adopt a software package developed in the framework of COST 733 action ‘Harmonization and Applications of Weather Type classification for Europe Regions’, which offers several classification methods (Philipp et al., Reference Philipp, Beck, Huth and Jacobei2014; Huth et al., Reference Huth, Beck and Kucerova2015). The weather type classification used in this study is based on two methods for temperature and precipitation: a method based on principal component analysis (the T-mode PCA obliquely rotated (PCT)), and an algorithm for optimizing partitions (simulated annealing), successfully used in previous works (Messeri et al., Reference Messeri, Morabito, Messeri, Brandani, Petralli, Natali, Grifoni, Crisci, Gensini and Orlandini2015, Reference Messeri, Benedetti, Crisci, Gozzini, Rossi, Vallorani and Maracchi2018; Salinger et al., Reference Salinger, Baldi, Grifoni, Jones, Bartolini, Cecchi, Messeri, Dalla Marta, Orlandini, Dalu and Maracchi2015; Hidalgo and Jougla, Reference Hidalgo and Jougla2018; Manzanas et al., Reference Manzanas, Gutierrrez, Fernandez, Van Meijgard, Calmanti, Magarino, Colfino and Herrera2018; Vallorani et al., Reference Vallorani, Bartolini, Betti, Crisci, Gozzini, Grifoni, Iannuccilli, Messeri, Messeri, Morabito and Maracchi2018).
The aim of the study is to investigate the relationship between climate variability and the fluctuations in the yield of barley, durum wheat, olives and sunflower crops in Tuscany, Italy.
Materials and methods
Indices of large-scale climate variability (NAO, SNAO, WAM and ITF)
SNAO values were obtained from the Hadley Centre, United Kingdom Meteorological Office, whilst NAO values were taken from the NOAA Climate Prediction Center (https://www.cpc.ncep.noaa.gov/data/teledoc/nao.shtml). WAM index values were obtained from the NOAA Climate Prediction Center (http://ljp.gcess.cn/dct/page/65579) (Li and Zeng, Reference Li and Zeng2005). ITF index values were taken from https://www.cpc.ncep.noaa.gov/products/international/itf/itcz.shtml. Then, these large-scale modes were correlated with both weather regimes and crop yields in Tuscany.
Weather regimes: Italian weather types
The Tuscany climate has different characteristics from separate areas, being influenced both by the sea that bathes the region to the west, and by the morphology of the Apennines that delimits the territory both to the north and to the east. These differences are reflected in the spatial and temporal distribution of total precipitation (Appendix 1). Plain and hill areas, where barley, durum wheat and olive are concentrated, have annual cumulative precipitation between 1000 mm Versilia Coast − 1300 mm in Lucca and Garfagnana areas – and 400 mm southern coast – 600 mm in Siena and Arezzo areas. As regards the precipitation temporal distribution, they are concentrated in October–December as well as during the spring (especially in April). The highest total rainfall is recorded in November with values between 150 mm (Versilia hill areas) and 80 mm (Grosseto and Siena plane areas). The circulation regimes and weather types can be extremely useful in understanding the spatial and temporal distribution of precipitation over a heterogeneous territory such as Tuscany.
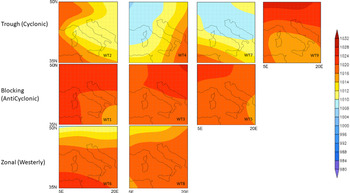
The weather types used in this work are constructed following Vallorani et al. (Reference Vallorani, Bartolini, Betti, Crisci, Gozzini, Grifoni, Iannuccilli, Messeri, Messeri, Morabito and Maracchi2018), by using mean sea-level pressure from the NCEP-DOE Reanalysis 2 (https://www.esrl.noaa.gov/psd/) with a resolution of 2.5° × 2.5° for the period 1979–2015. The nine weather types (WT classes), calculated with PCT method, were then combined in three classes of circulation regimes: cyclonic, anti-cyclonic (blocking) and zonal (westerly) (Fig. 1).
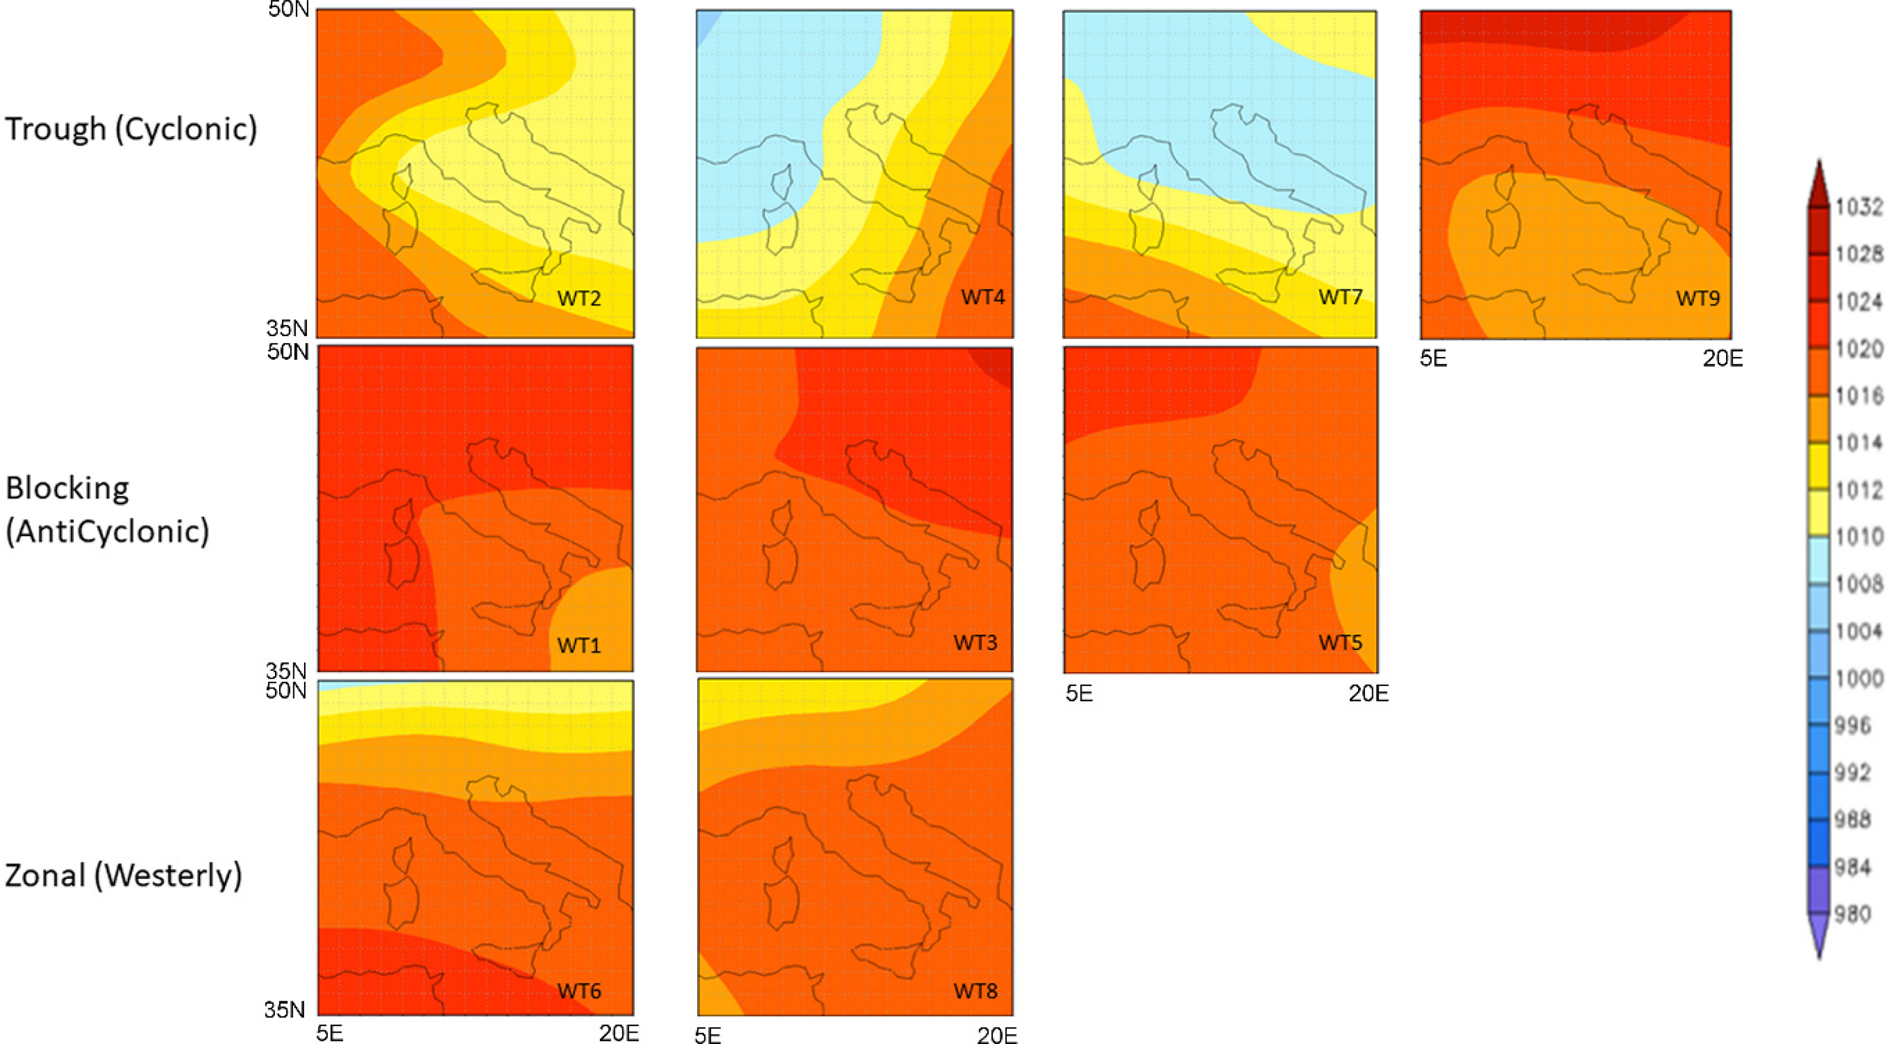
Fig. 1. Colour online. Circulation type classification for Italy based on PCT methods.
Crop data
Crop data, cultivated areas and production, were obtained from the database of the Italian Institute of Statistics (http://dati.istat.it/). We use data for the period 1981–2018 (barley and durum wheat) and for the period 2006–2018 (olives and sunflower) for the Tuscany region, and yields per hectare for each crop were calculated. ISTAT data are based on direct checks of local experts on the territory, as well as on indications from external sources (i.e. professional bodies and producer associations, administrative sources). The local trends of the main crops (arable, agricultural and fodder groups) are recorded annually with insights on vines and olives for wine and oil production, respectively.
Statistical analysis
To investigate associations between crop yields with climate indices and teleconnections and weather types, Pearson's correlation analysis has been performed between the crop and climate/weather data sets for various relevant months and seasons. Significance at the 5 and 1%, and sometimes 10% levels of confidence was identified for further exploration.
Results
Relationships between weather types and precipitation in Tuscany
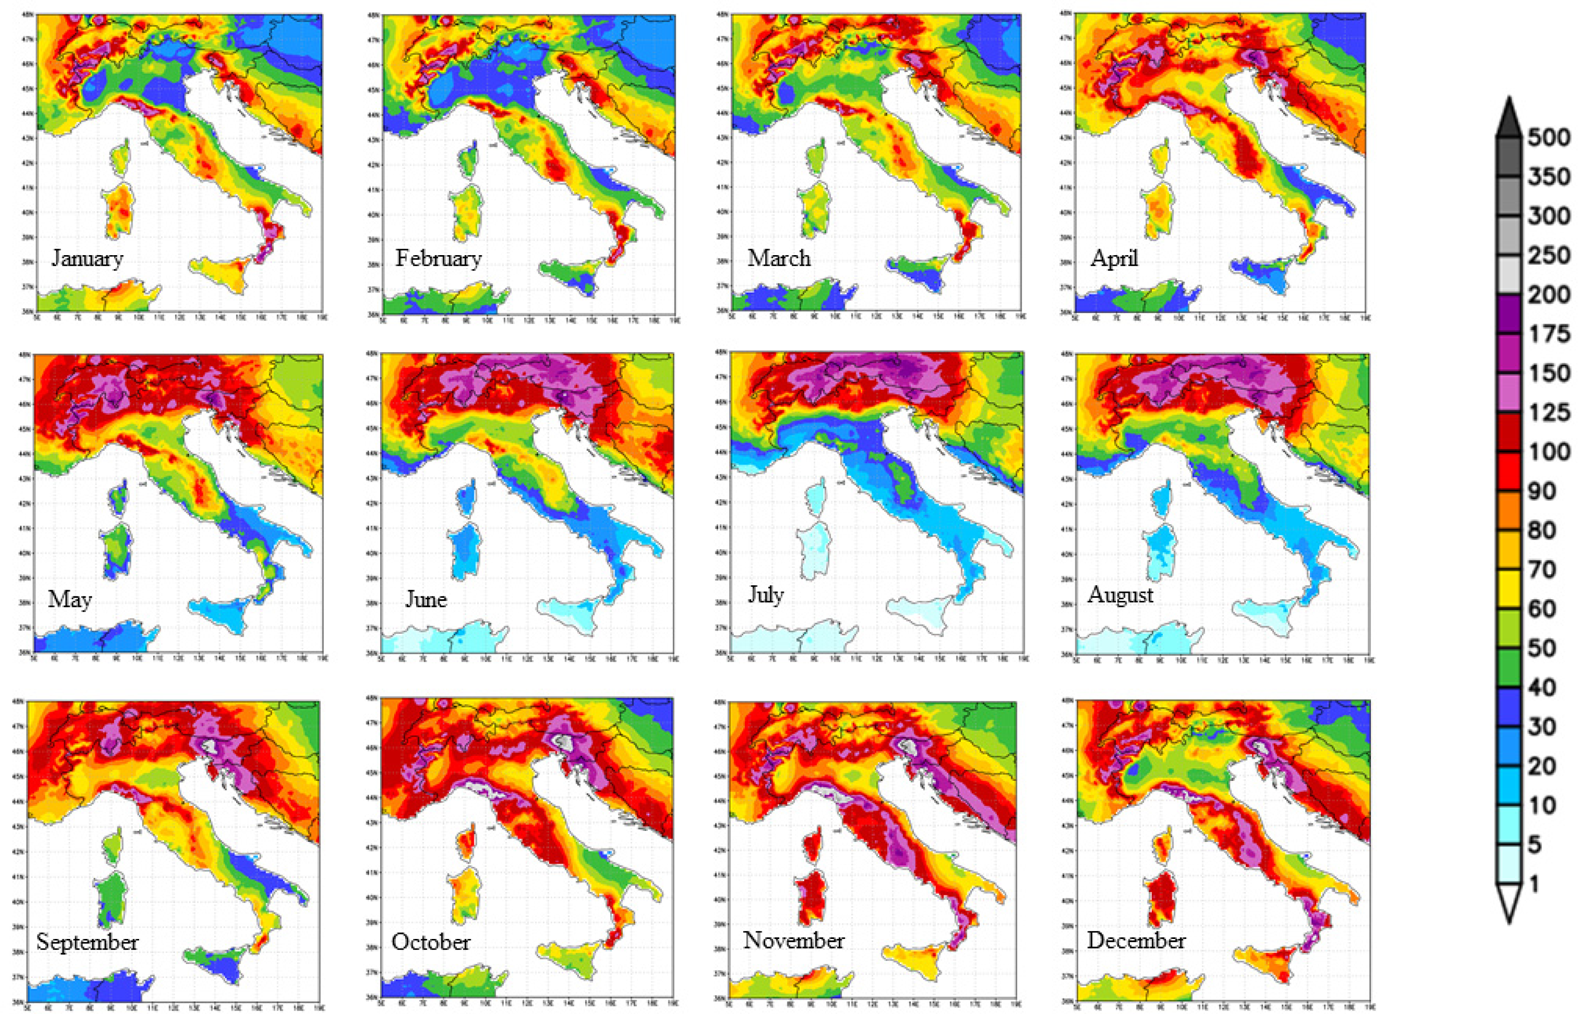
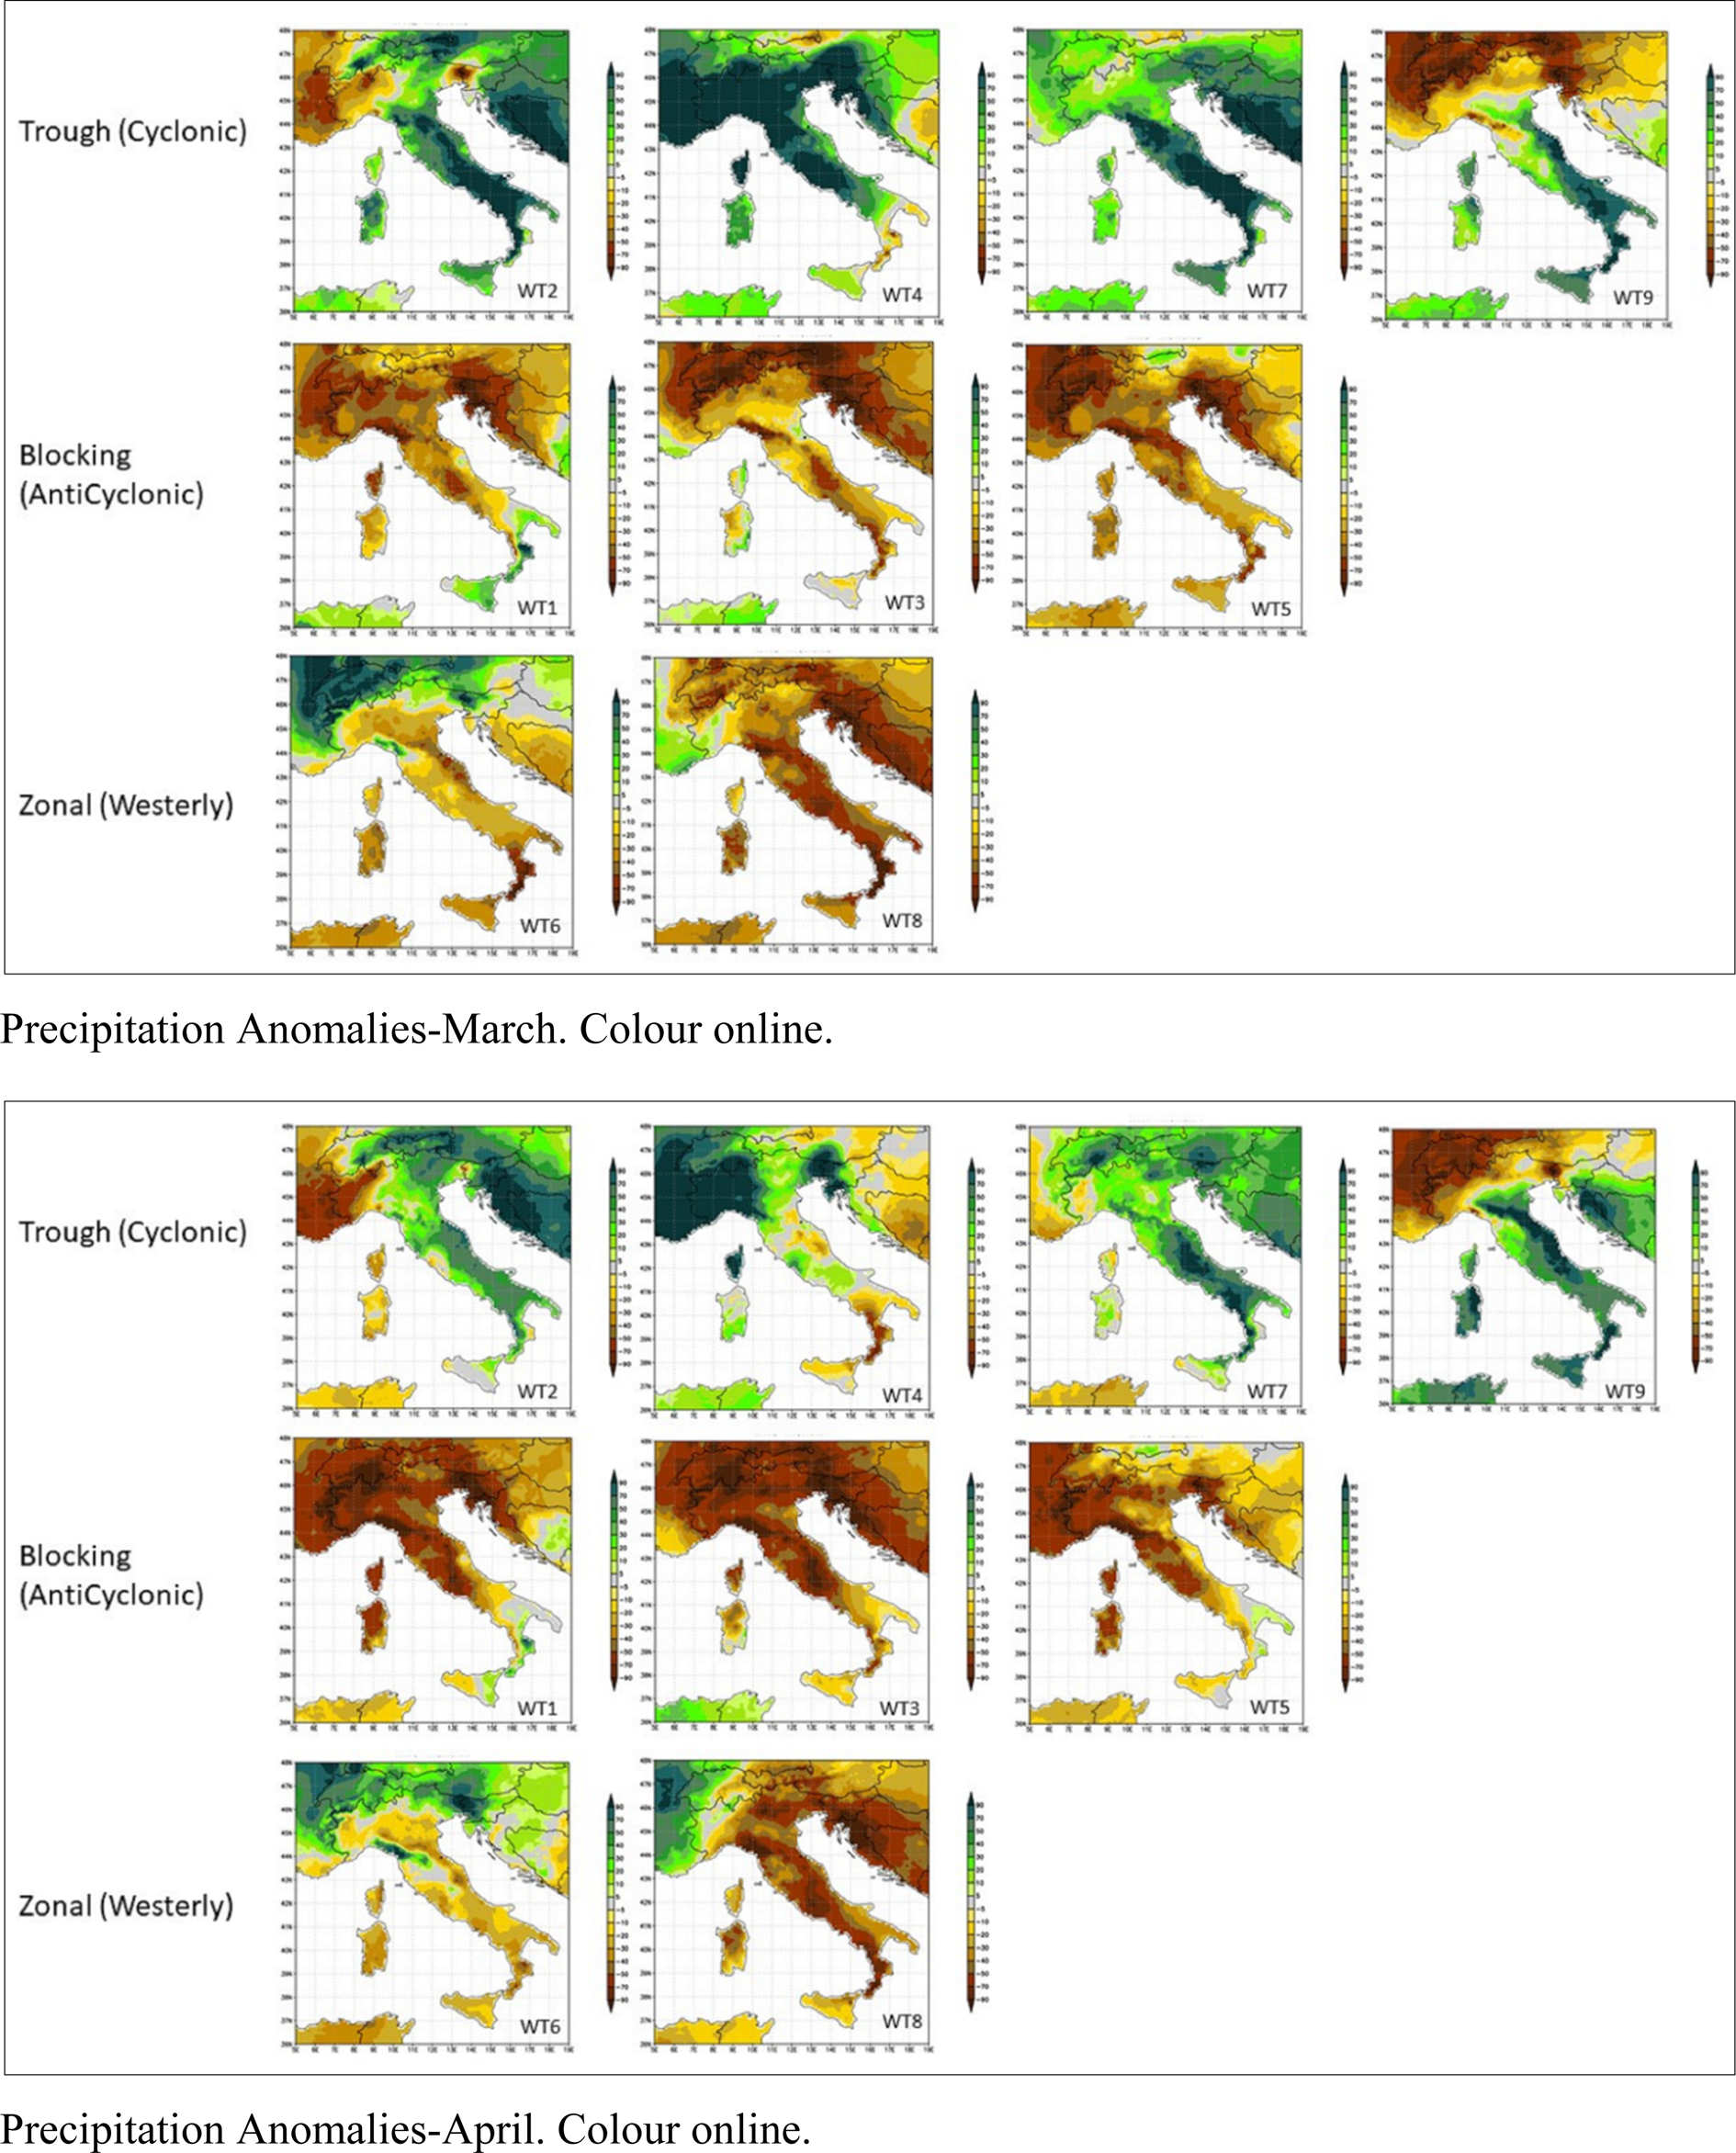
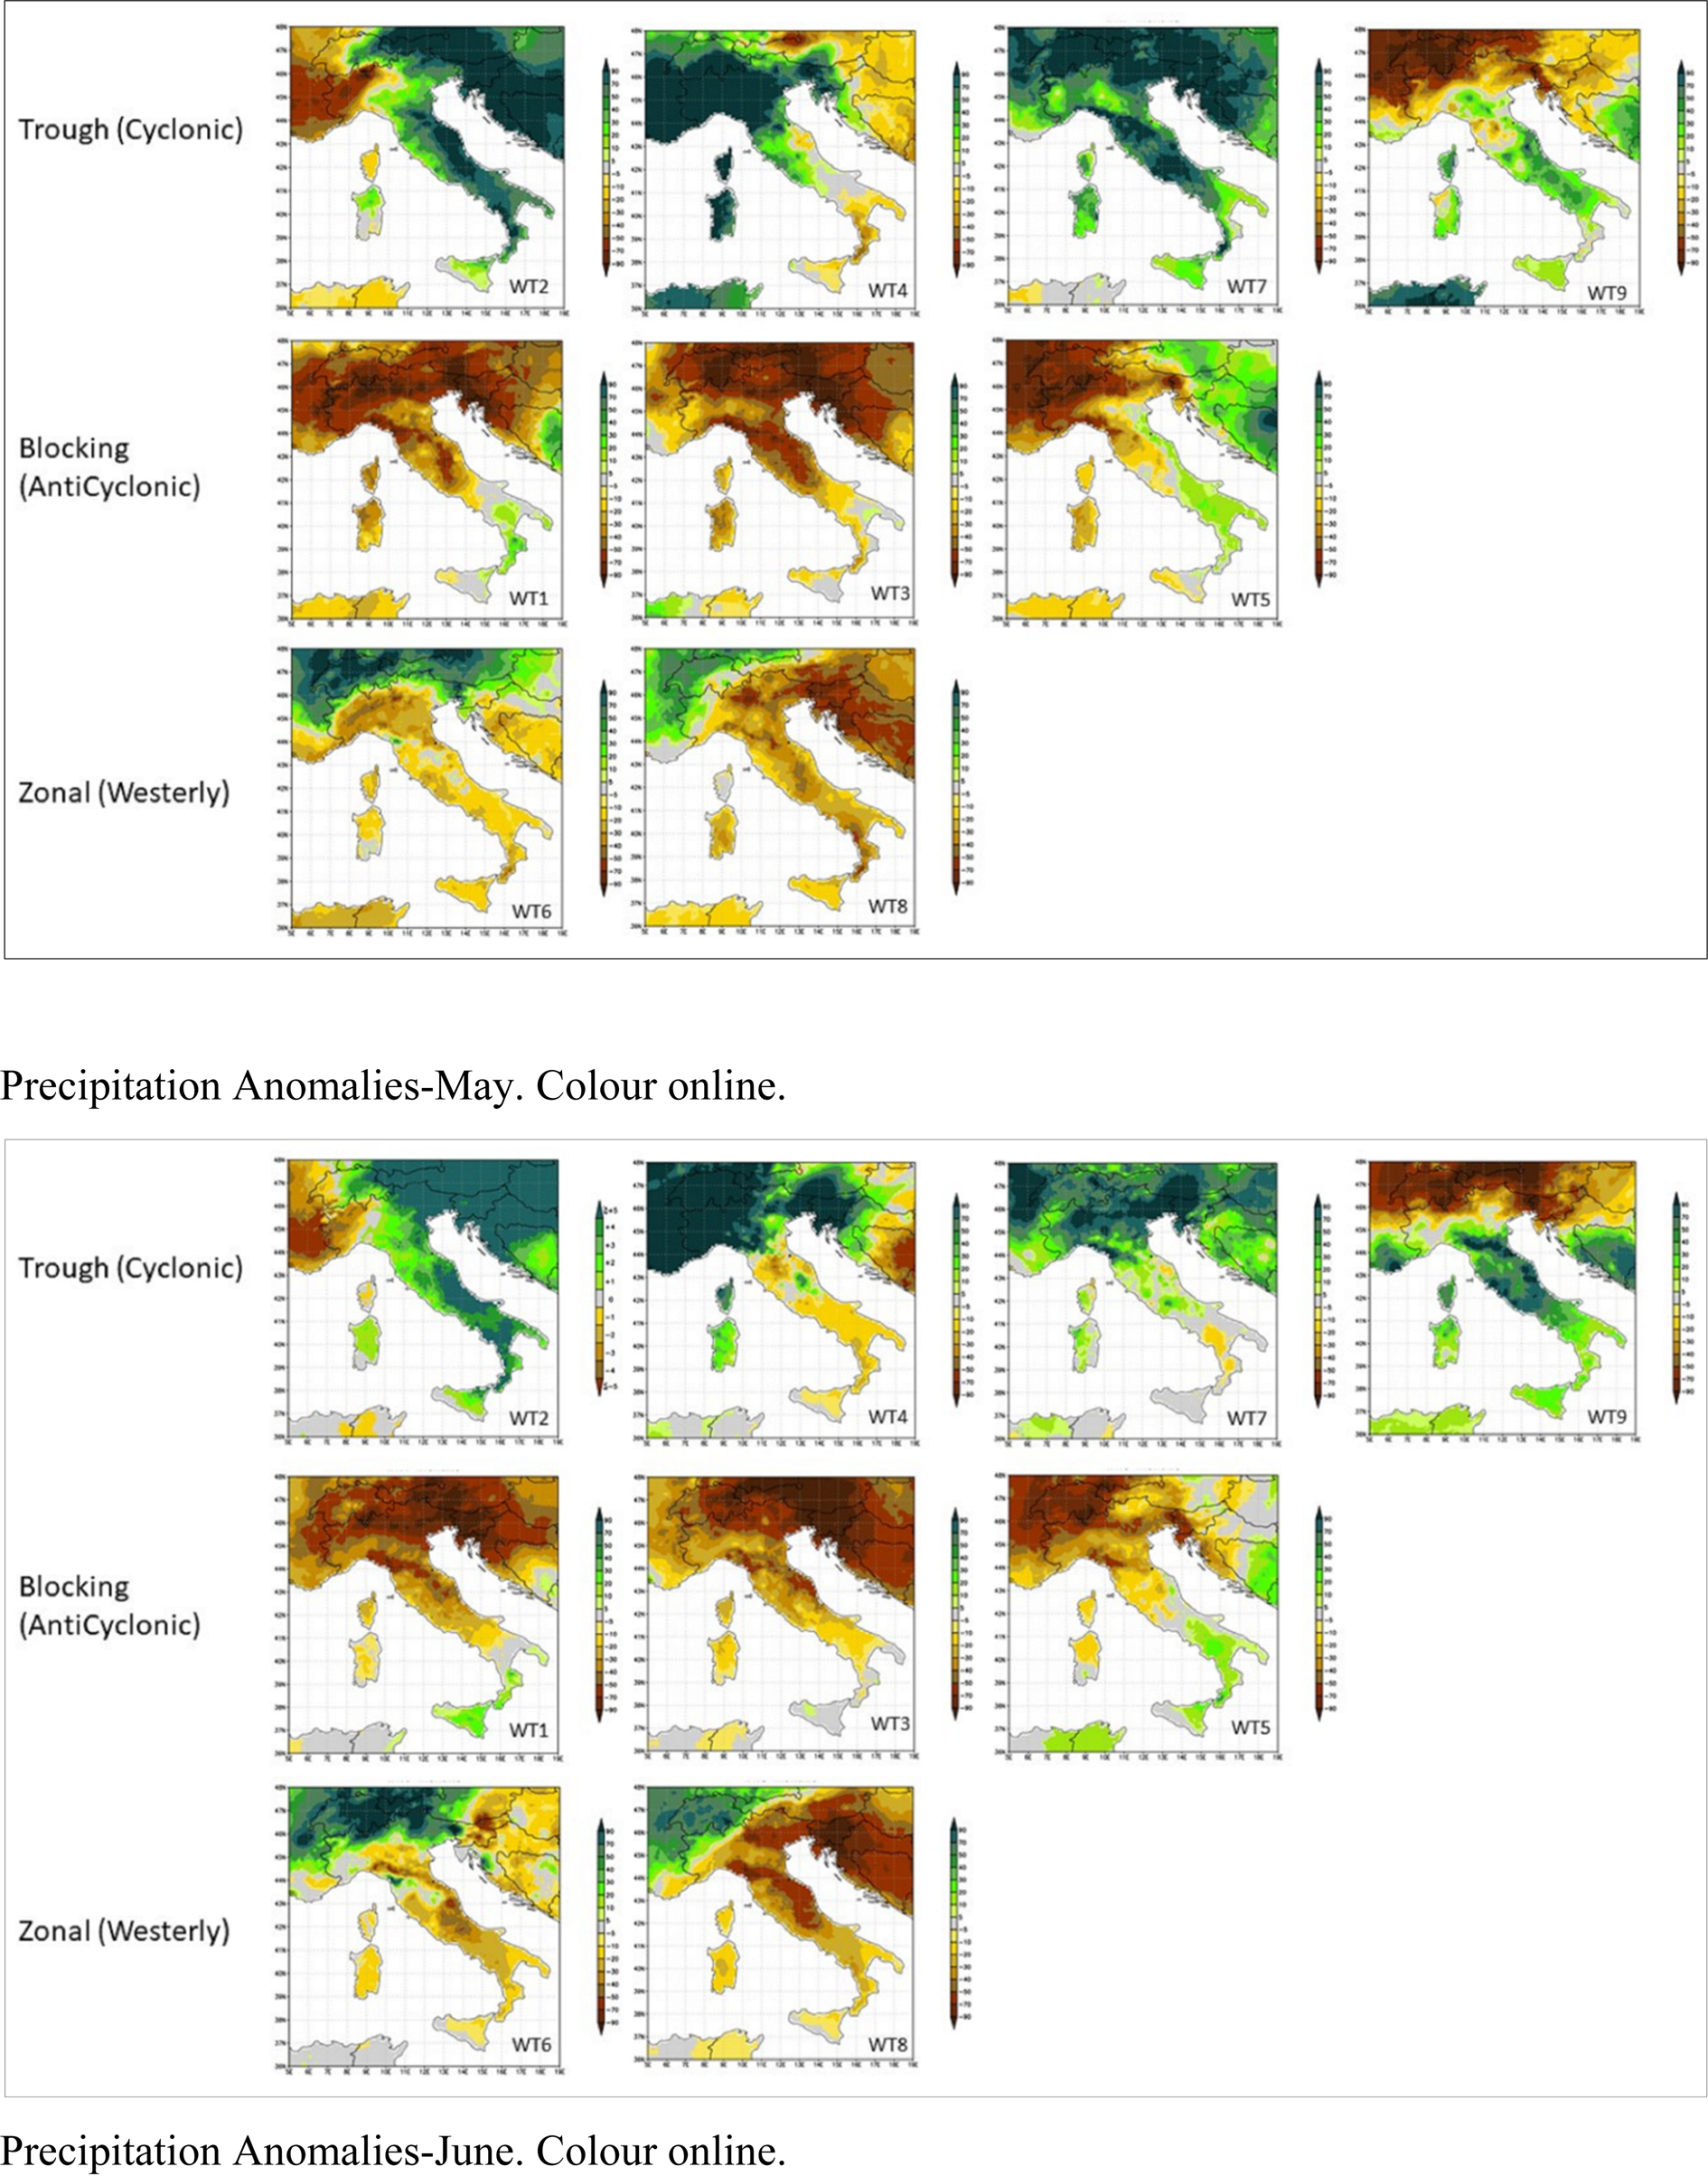
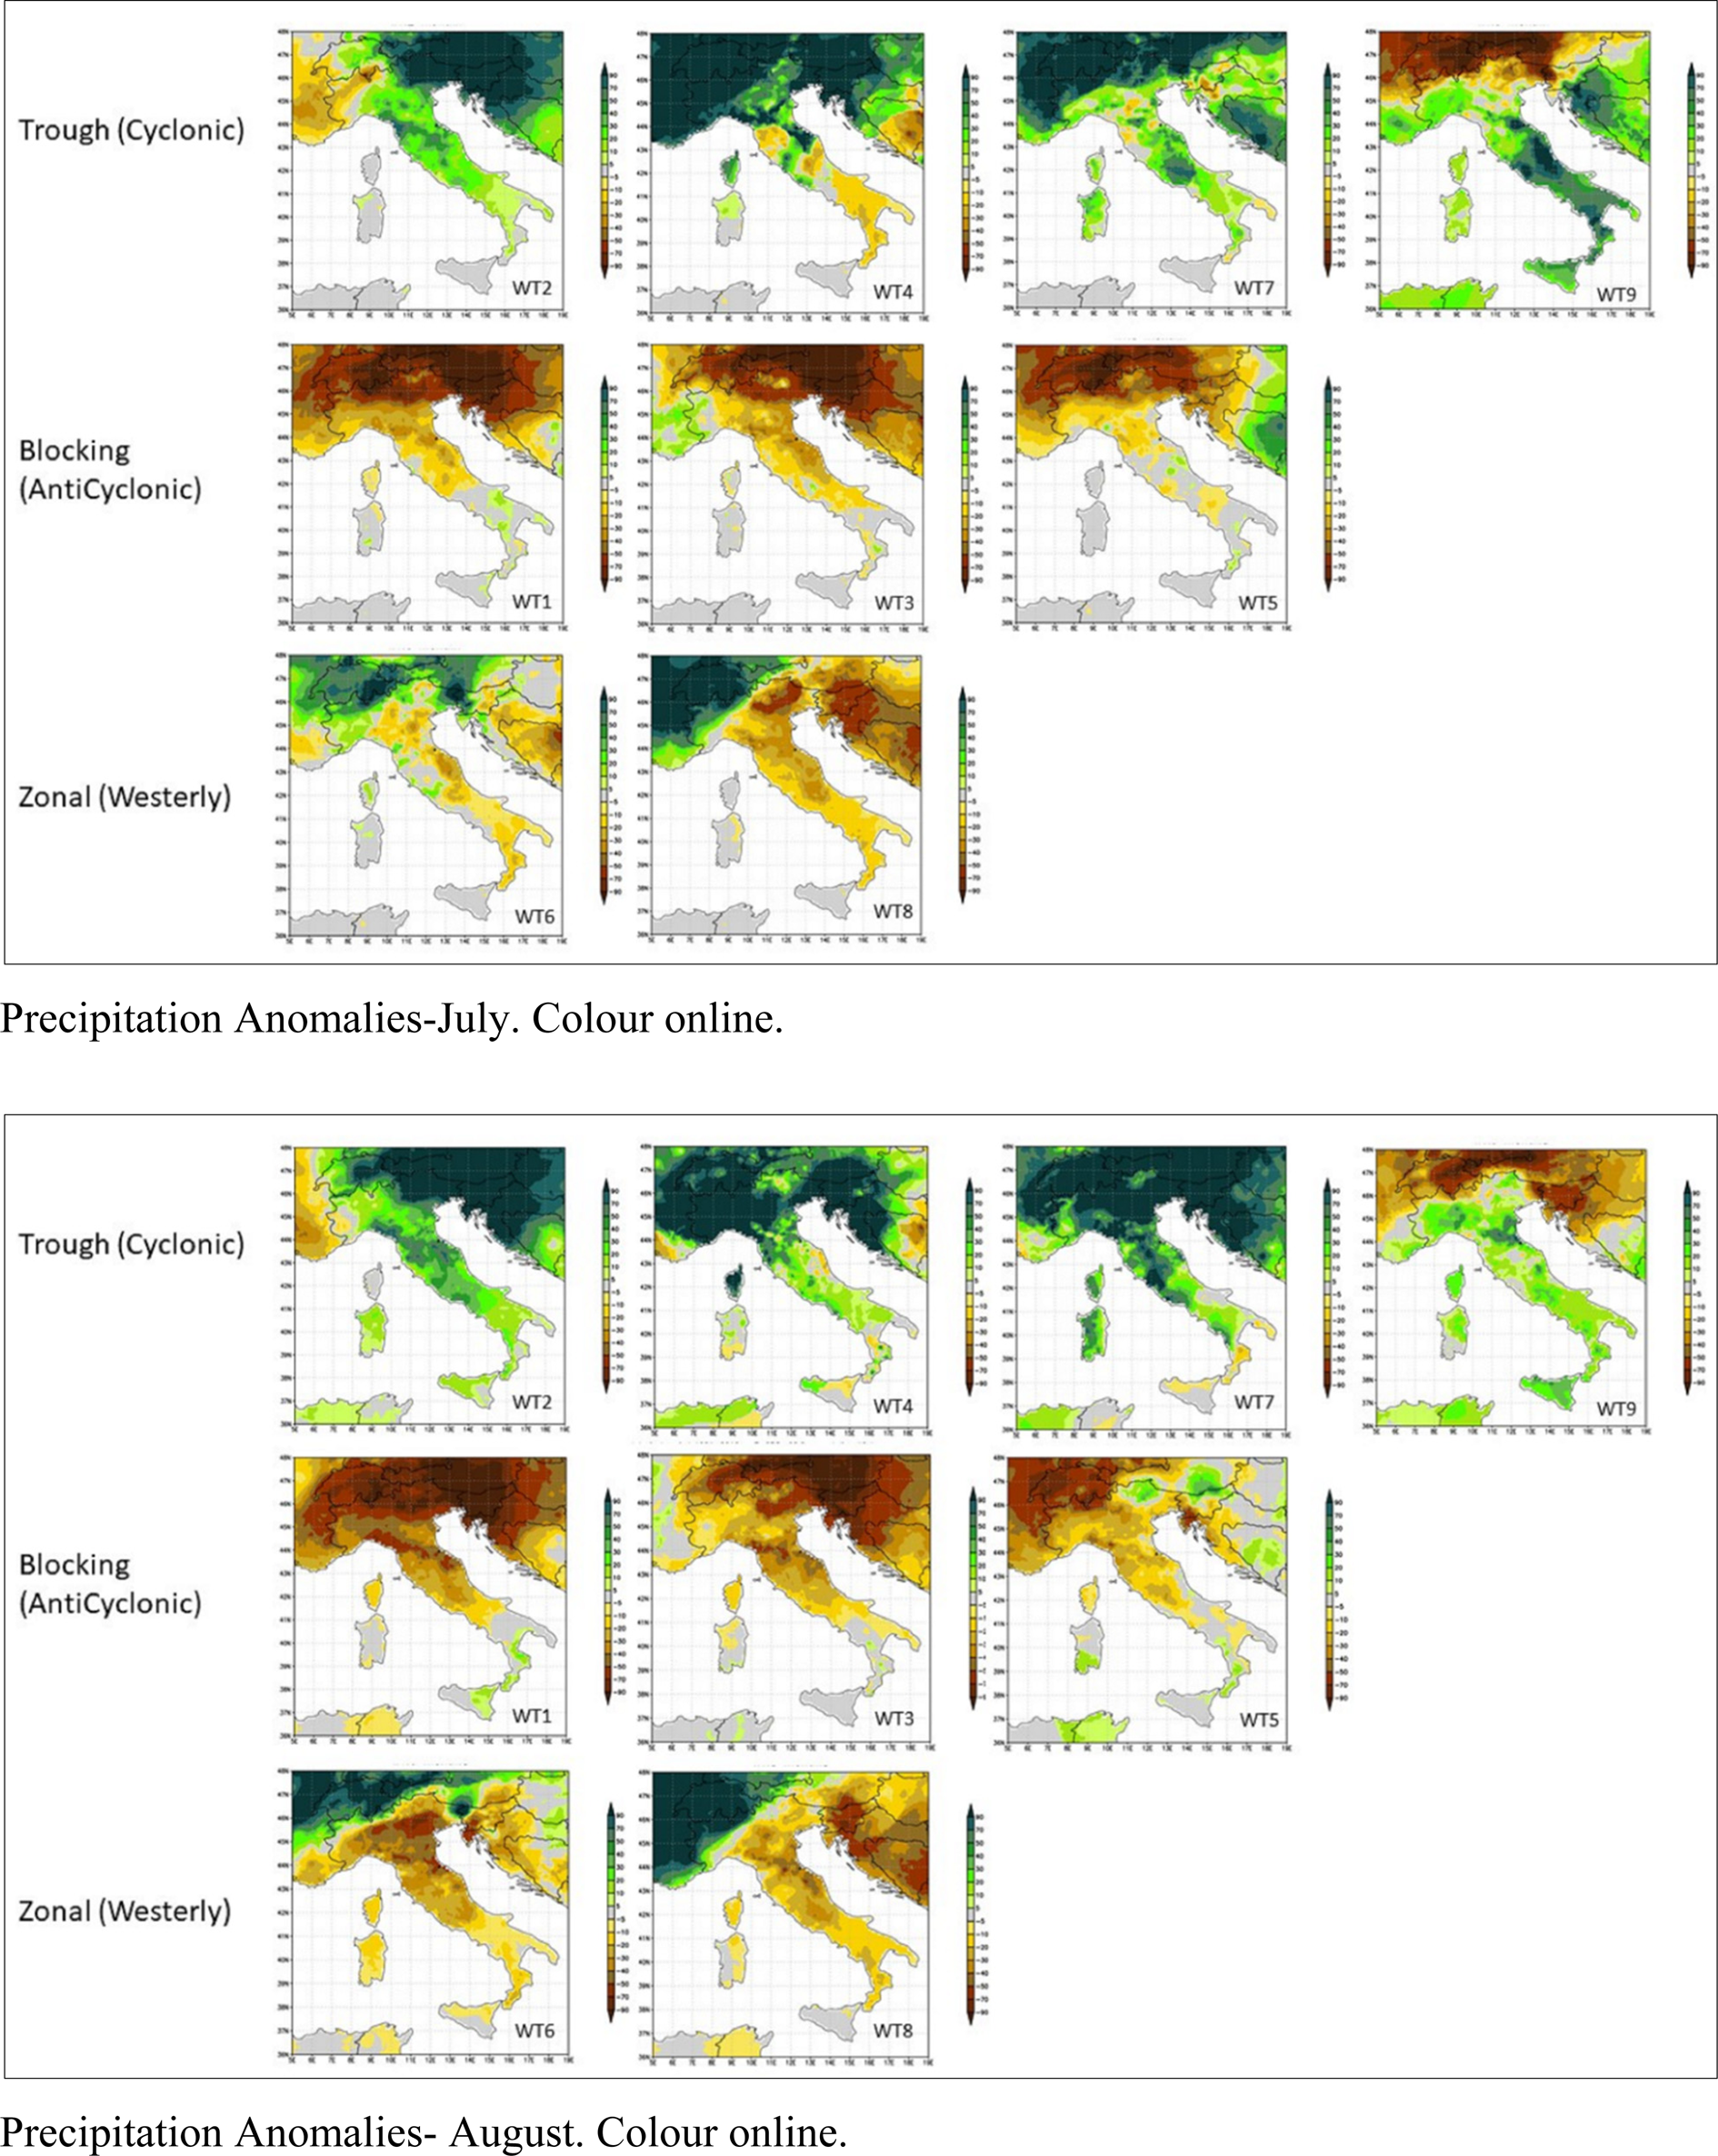
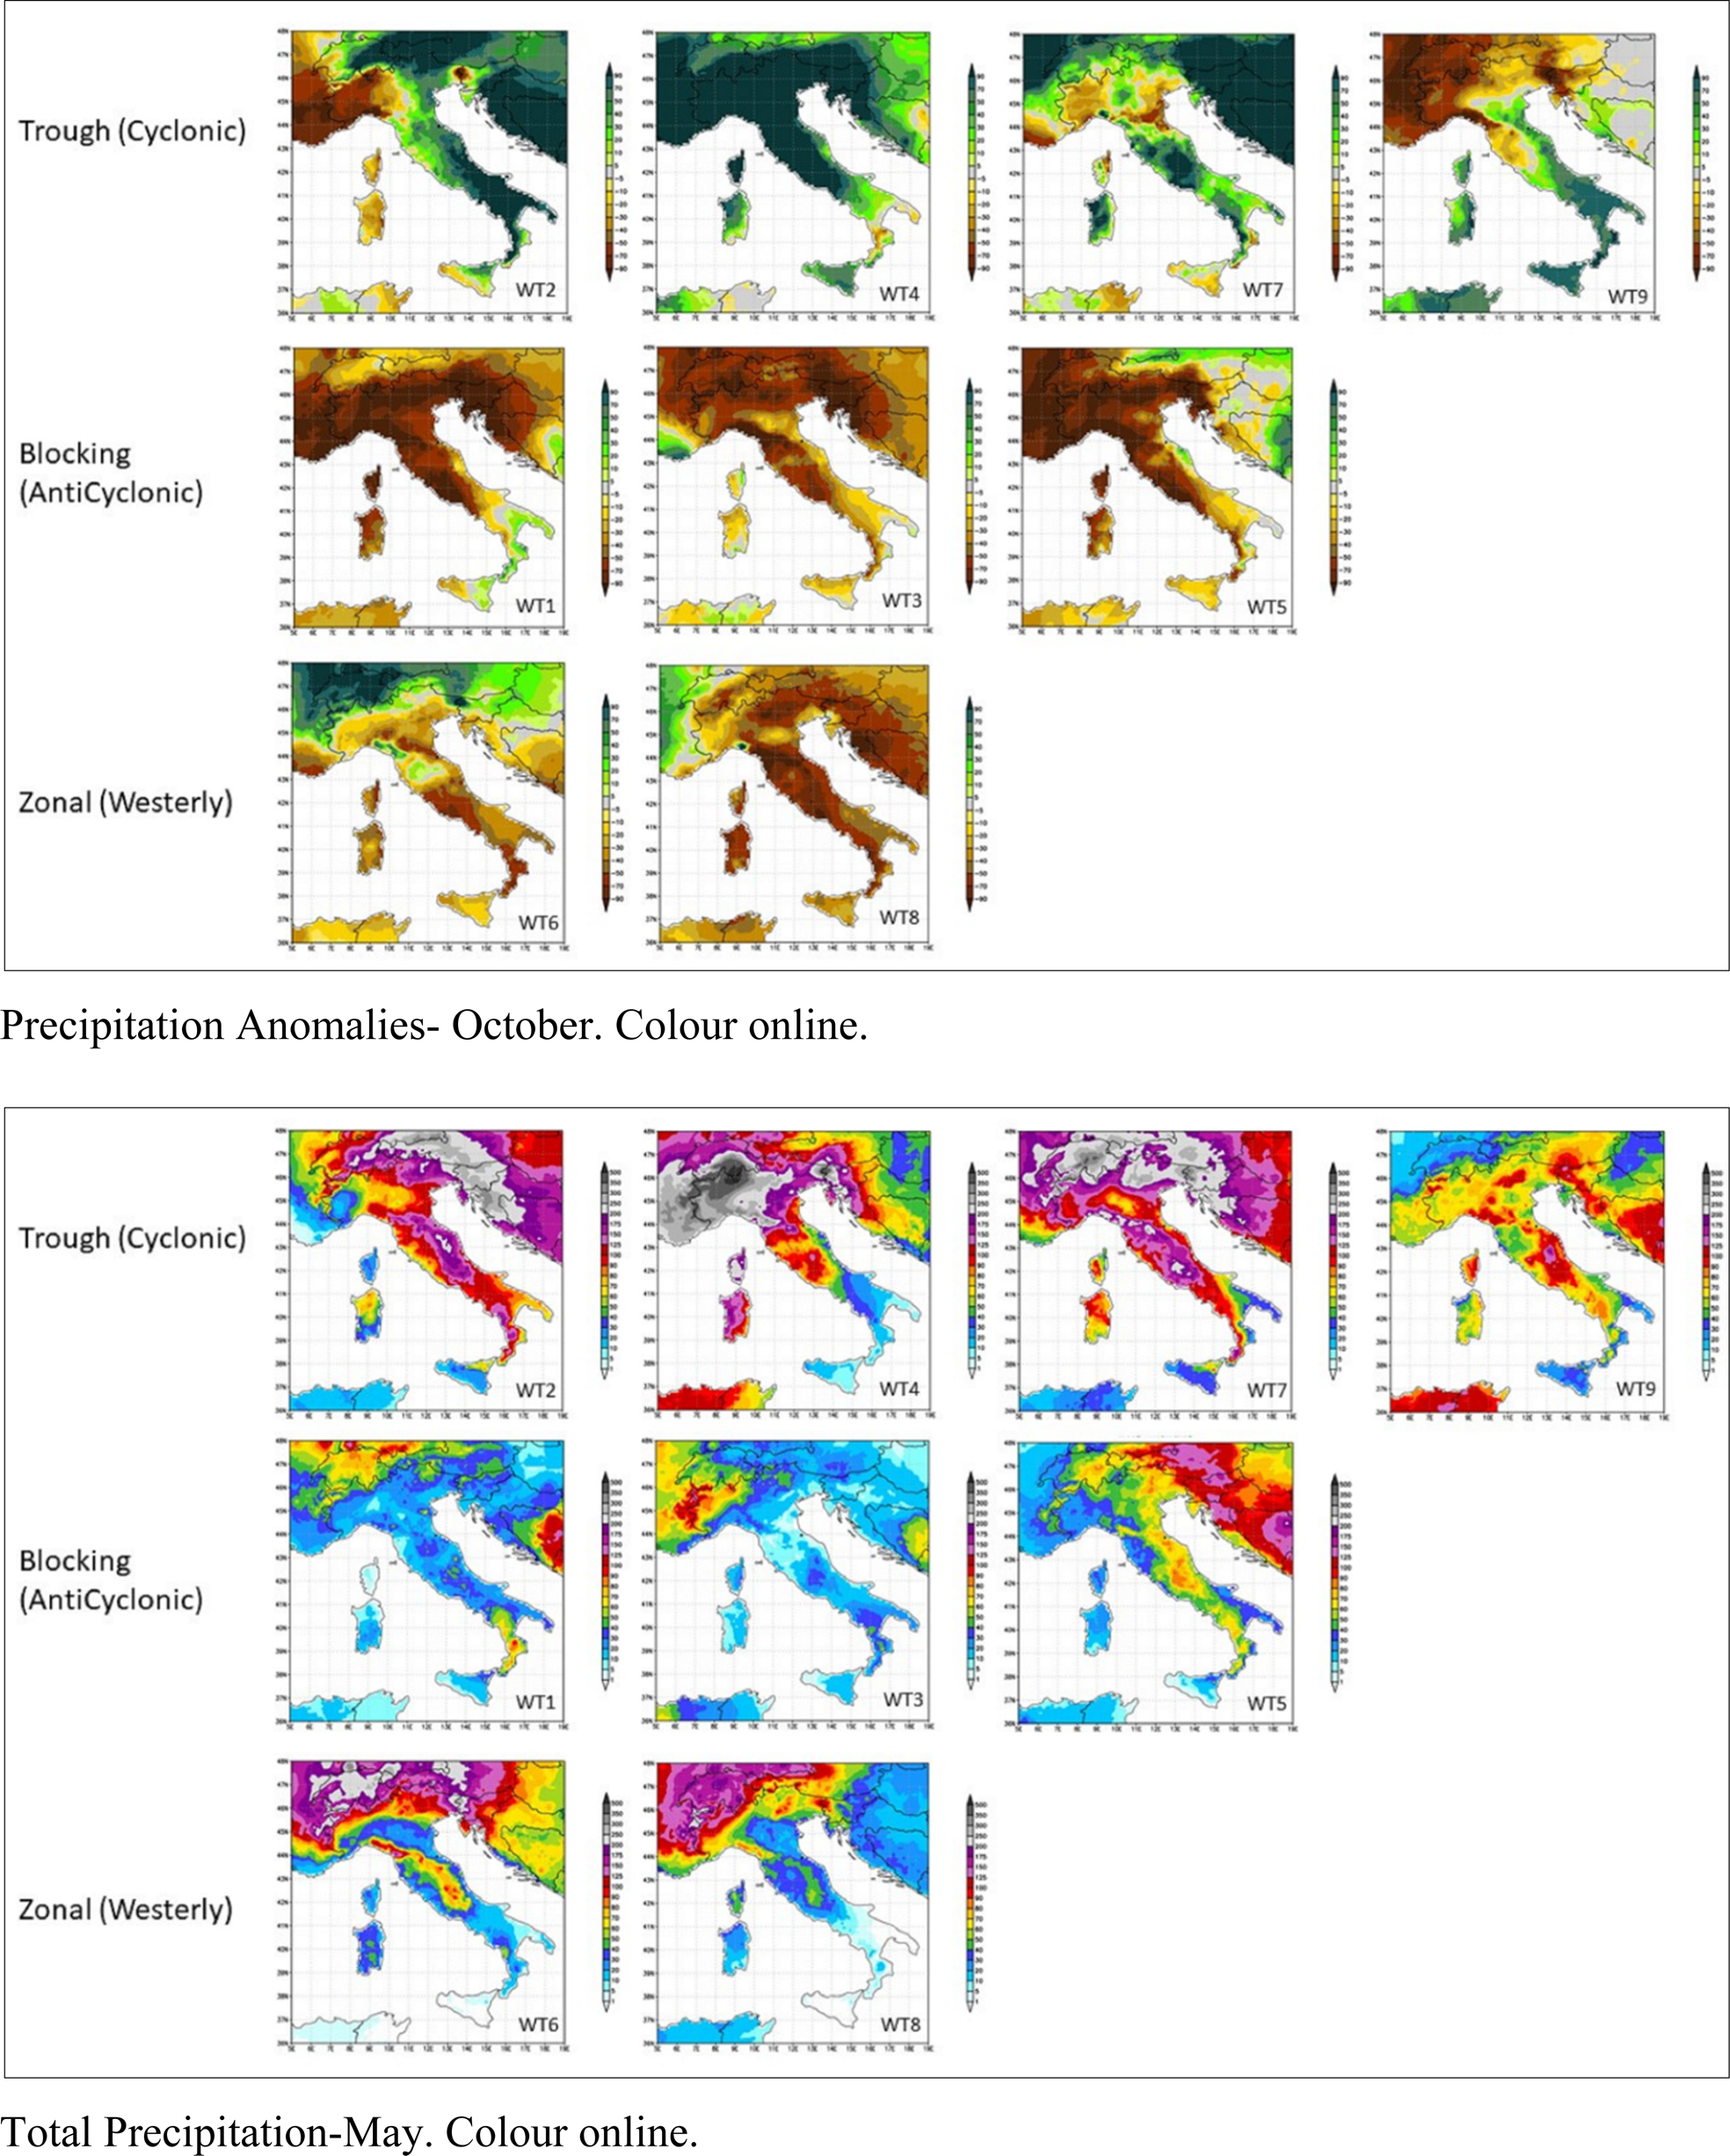
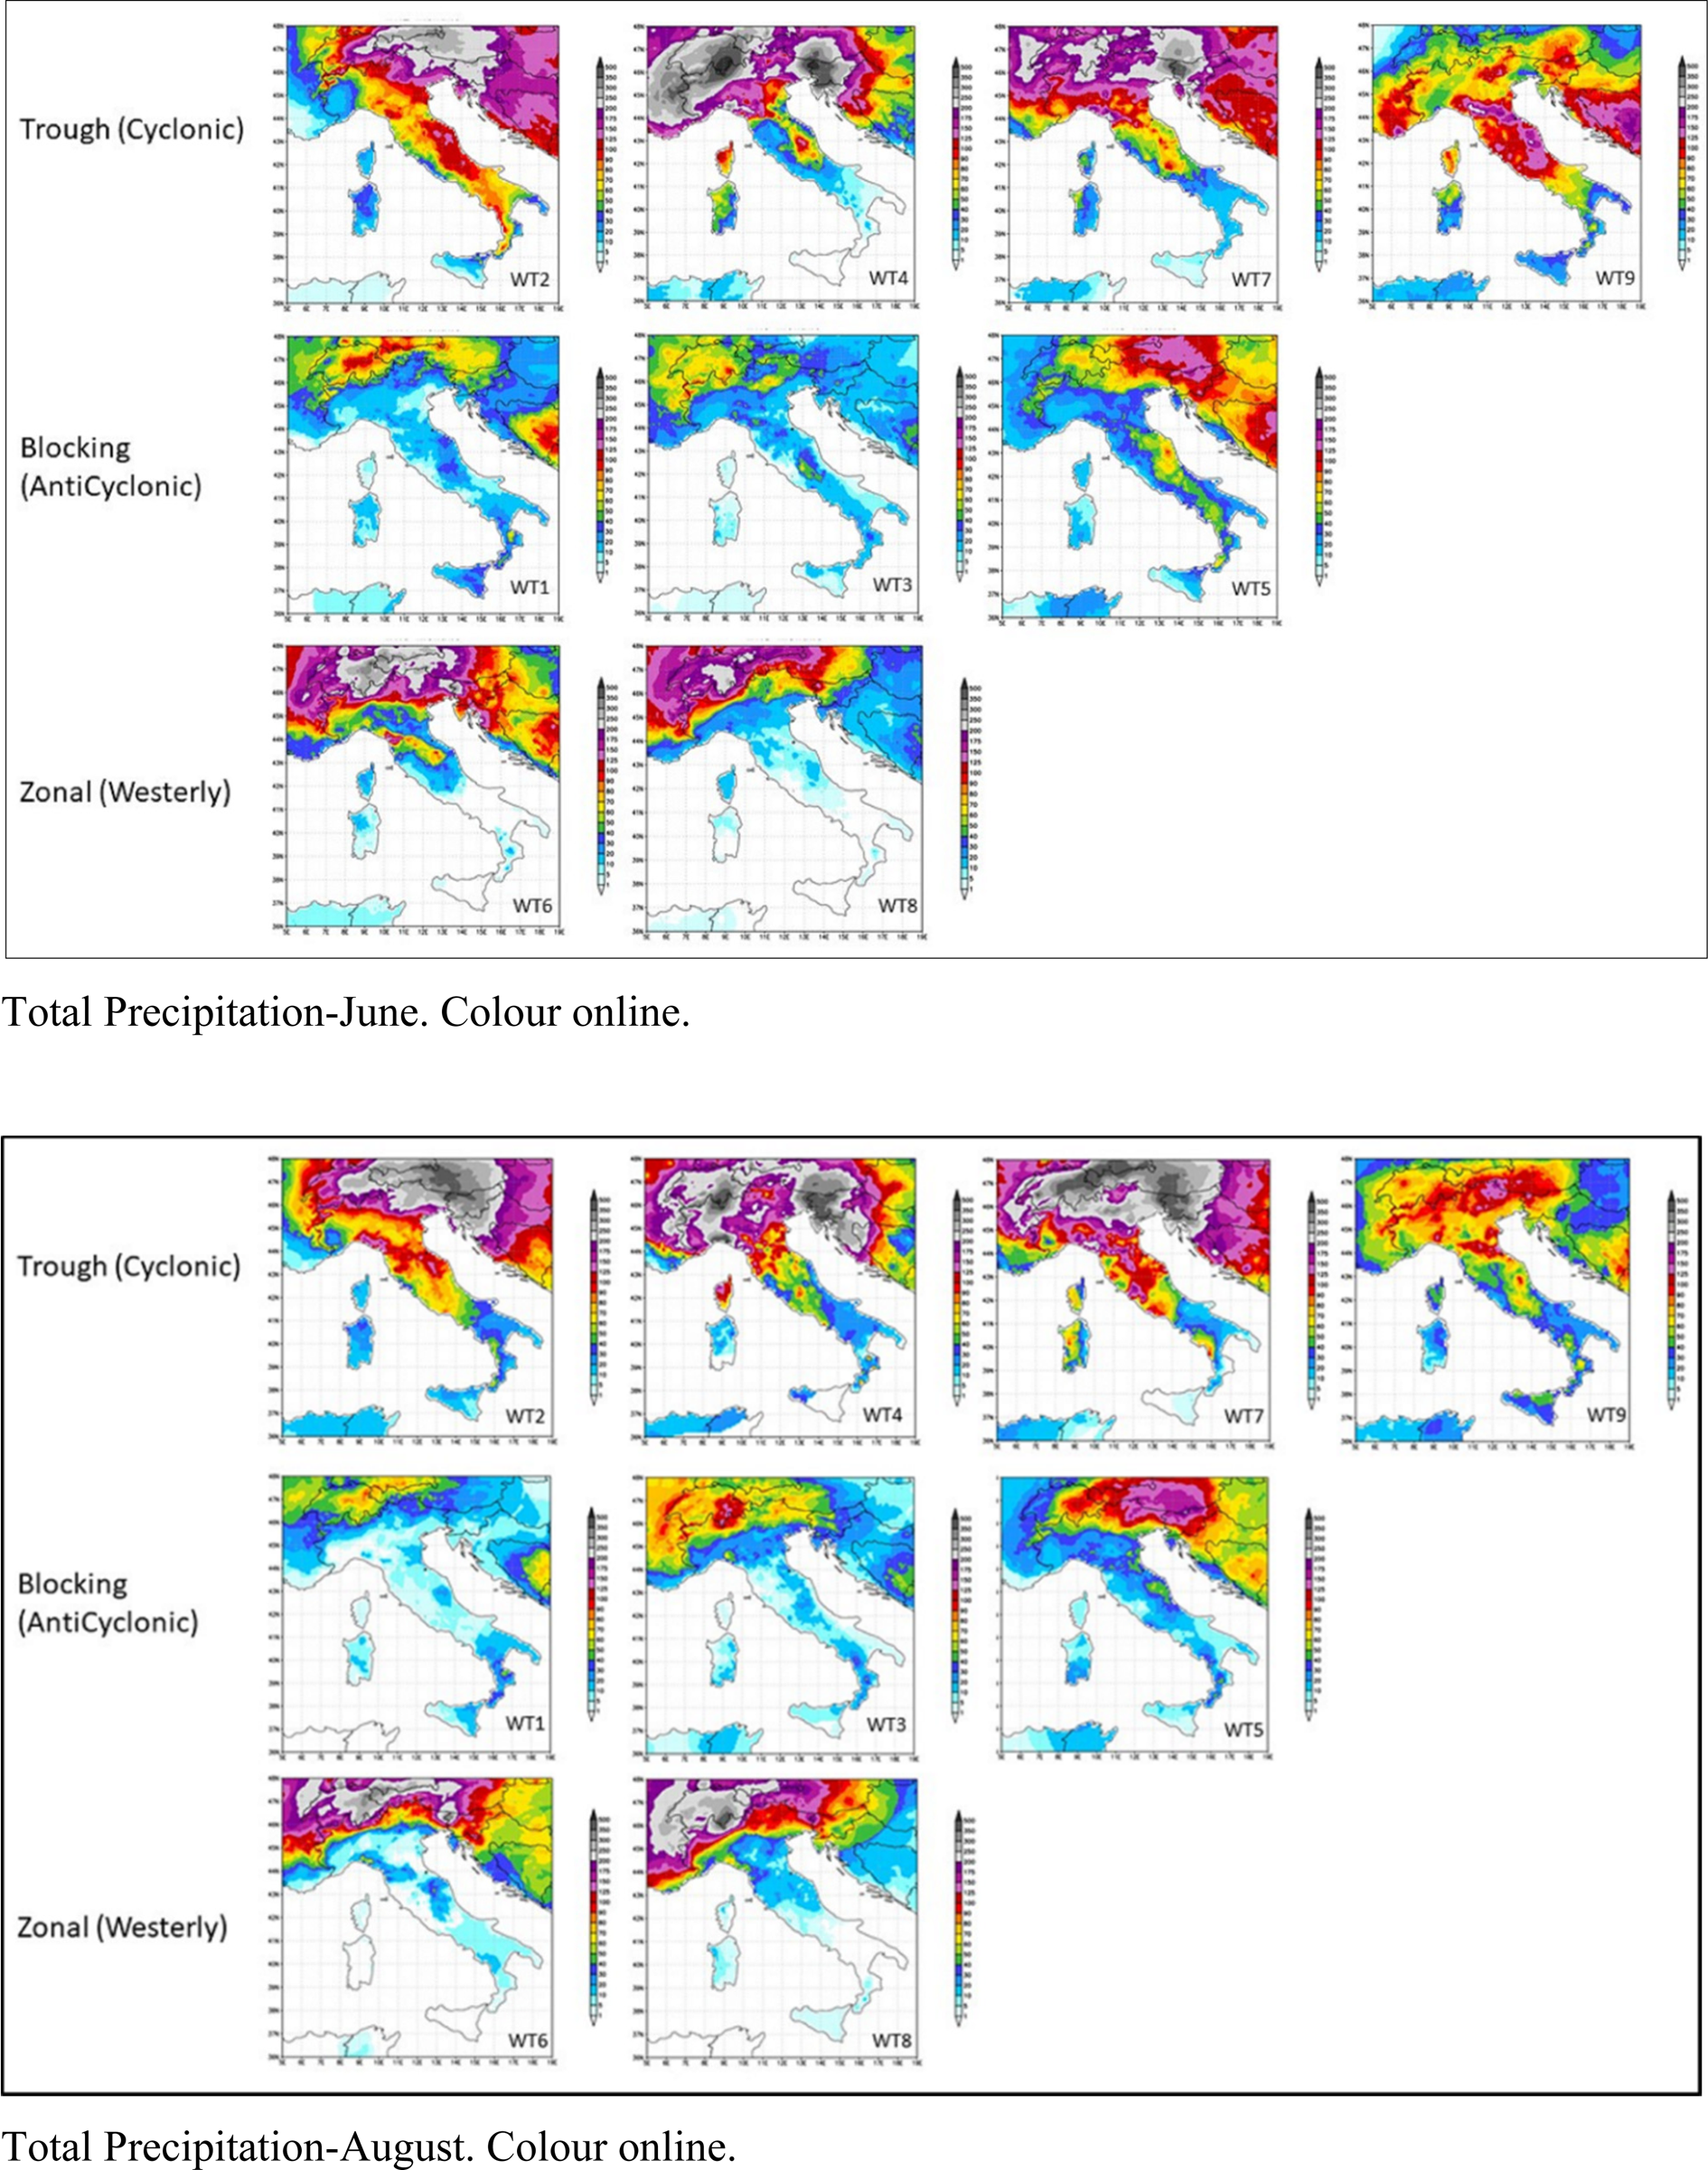
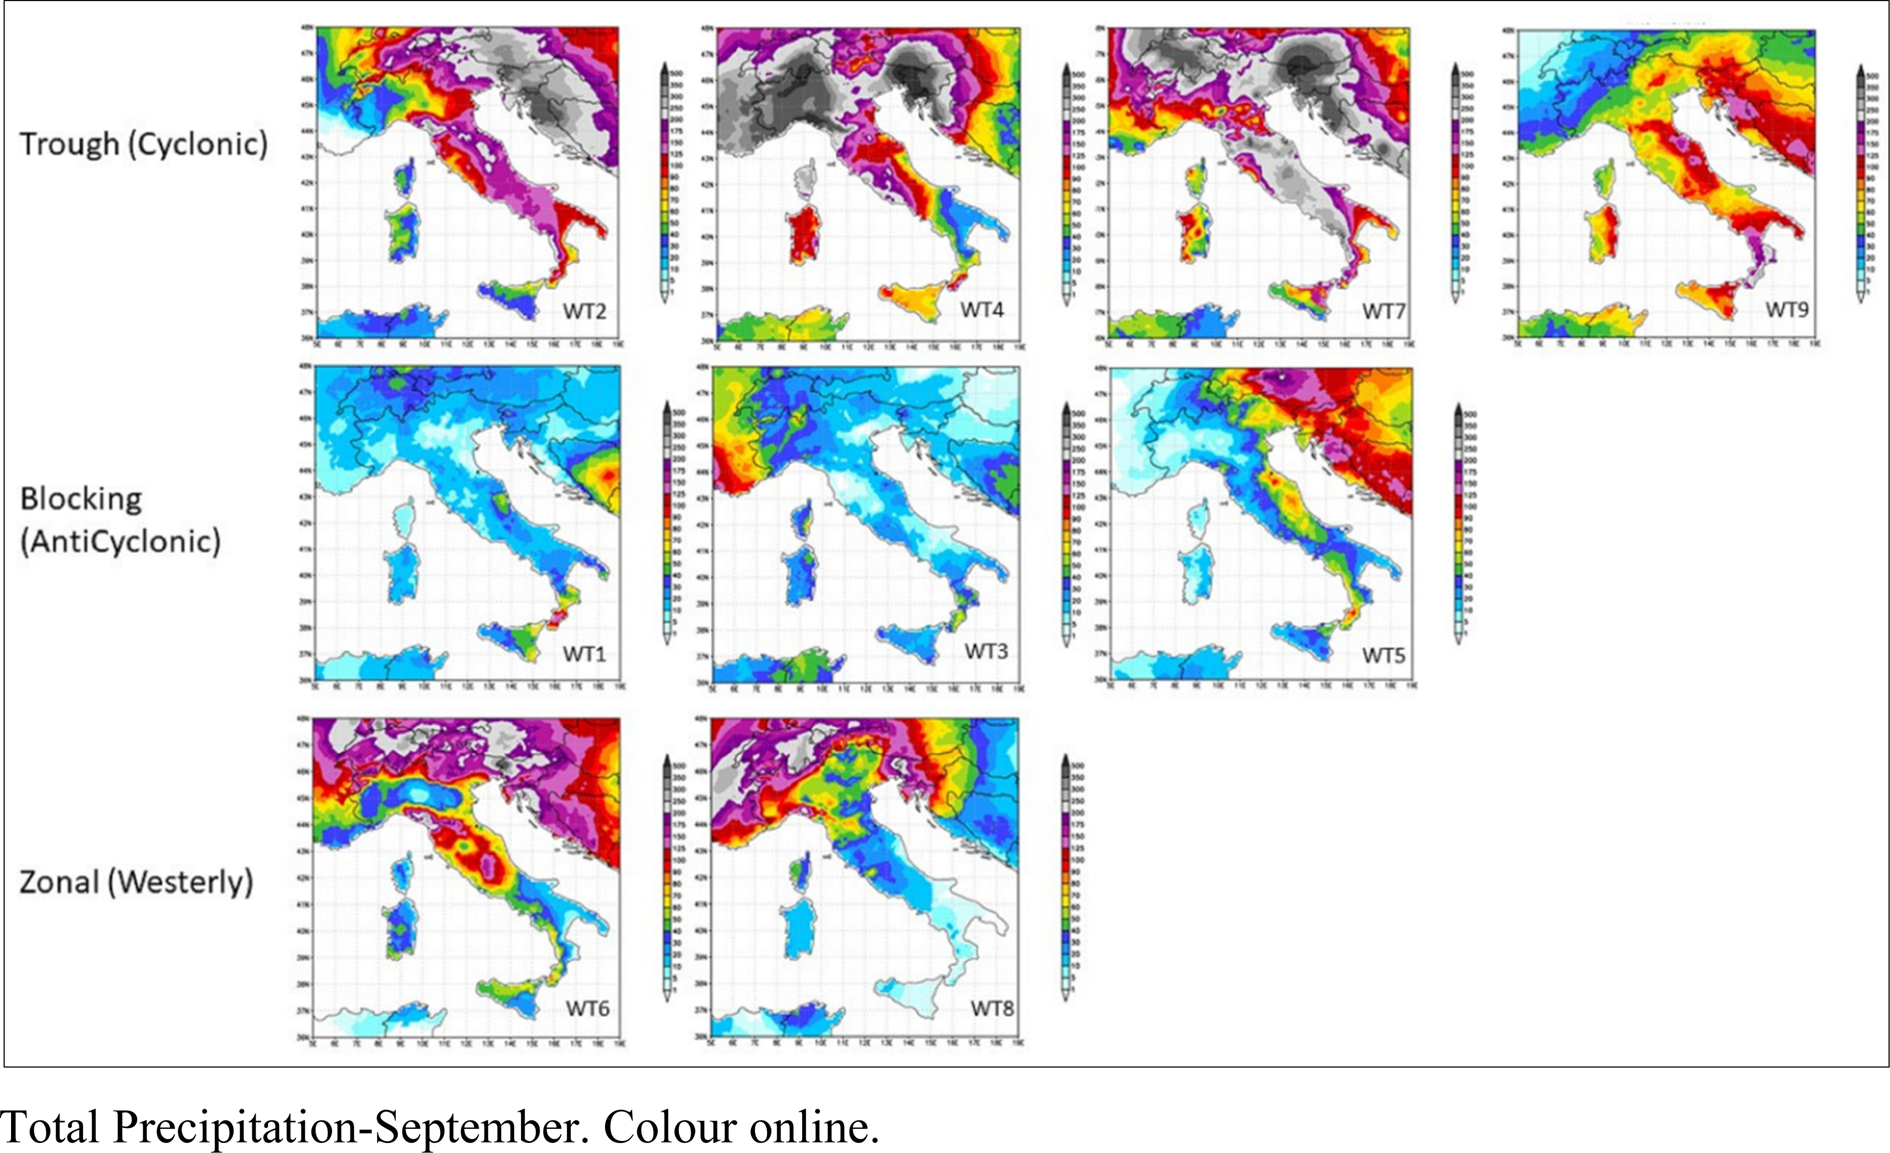
The ‘blocking’ weather types are characterized by precipitation lower than the climatological average throughout the March–October period. The ‘zonal’ regime has generally low rainfall with WT8 drier than WT6, particularly in September (Fig. 2). In most months, WT6 shows precipitation higher than the average limited to north-west areas; on the contrary, WT8 has negative anomalies. With cyclonic weather types (WT2, WT4, WT7 and WT9), positive anomalies prevail with few exceptions. During the sowing period or in the first phenological phase of barley, durum wheat and sunflower (March and April), the precipitation ranges between less than 20 mm up to 50 mm in the blocking regimes, from 20 mm up to 80 mm in the zonal, and from 30–40 mm up to 100 mm for the trough regime weather types (Figs 3 and 4). During the subsequent phenological phases and the harvest period (June, July, August, September and October), the precipitation ranges between 0 and 40 mm for blocking, 0 and 100 mm with the maximum values in October and September occurring with WT6. For trough types, the minimum values occurred in July with a few mm in WT4 (Fig. 5); in contrast, the maximum values occurred in October for WT4 and WT7 with more than 200 mm (Fig. 6). Additional maps for all months of the cropping year are available in Appendix 2.
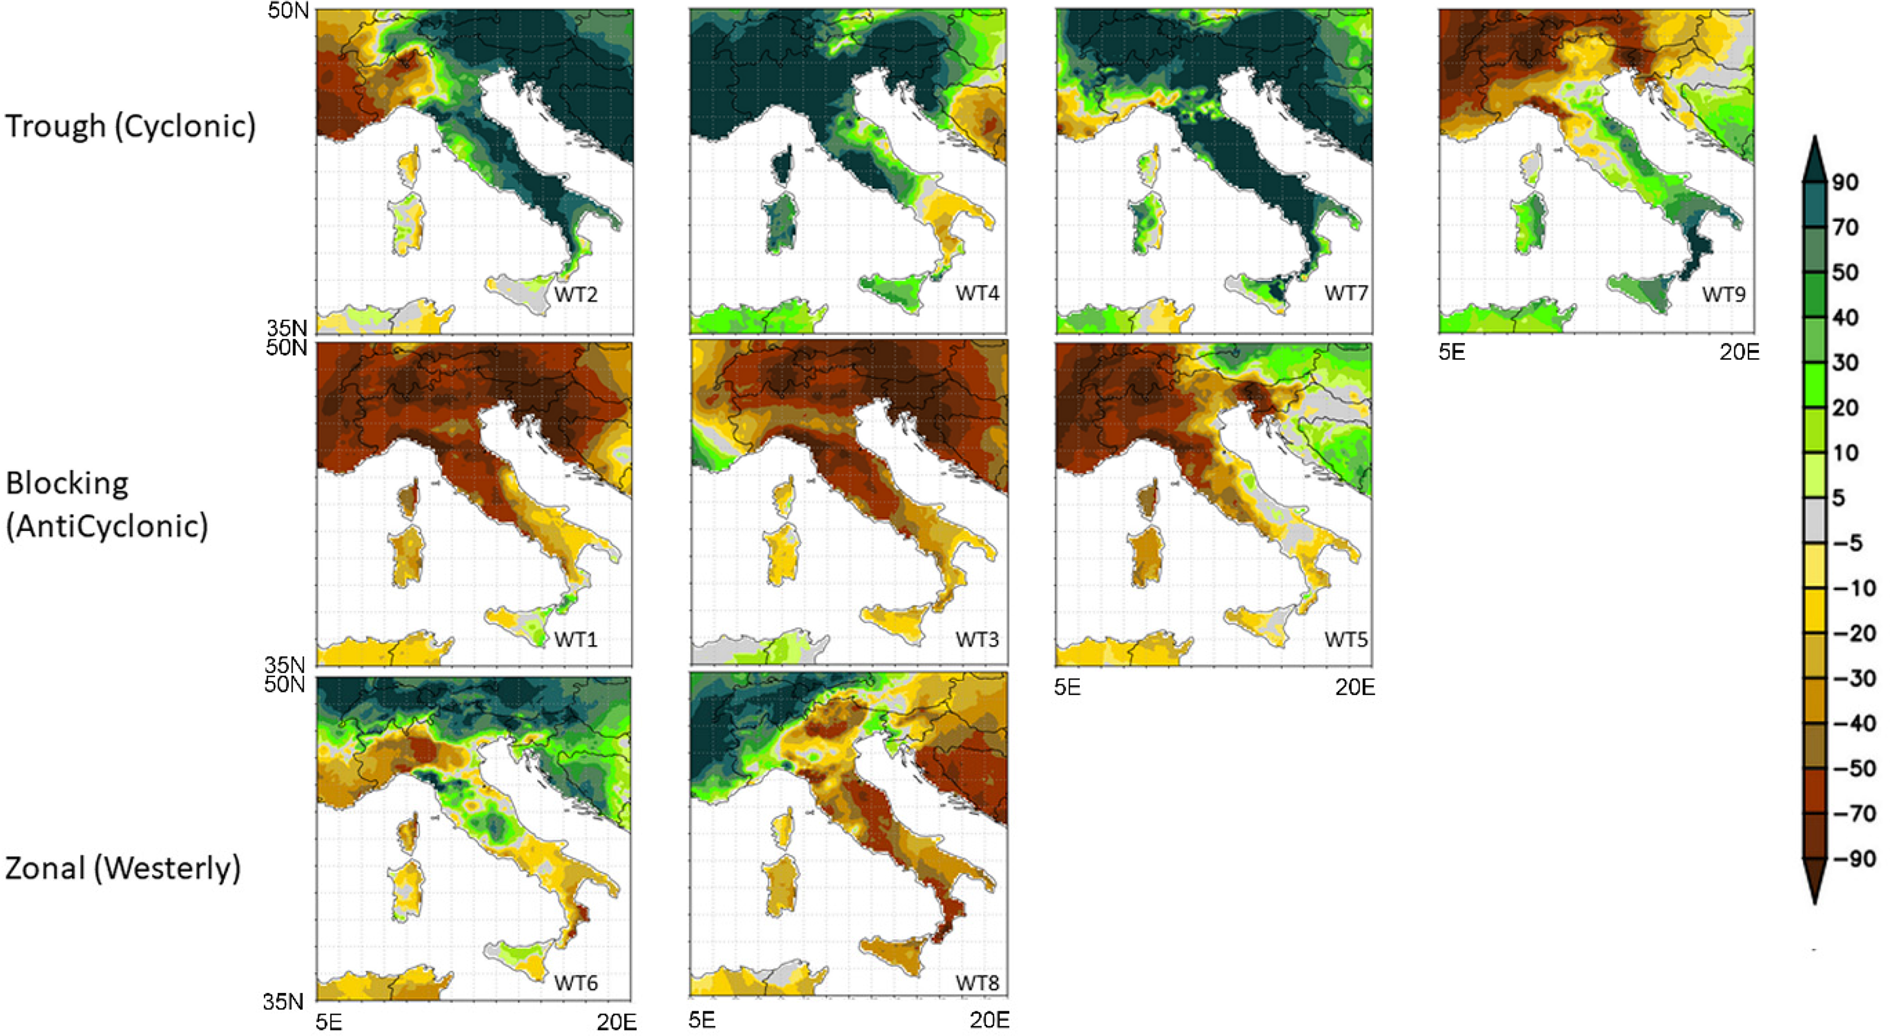
Fig. 2. Colour online. Precipitation anomalies of September for Italy produced by PCT circulation types with a resolution of 25 km. The anomalies refer to the 1981–2010 base period.
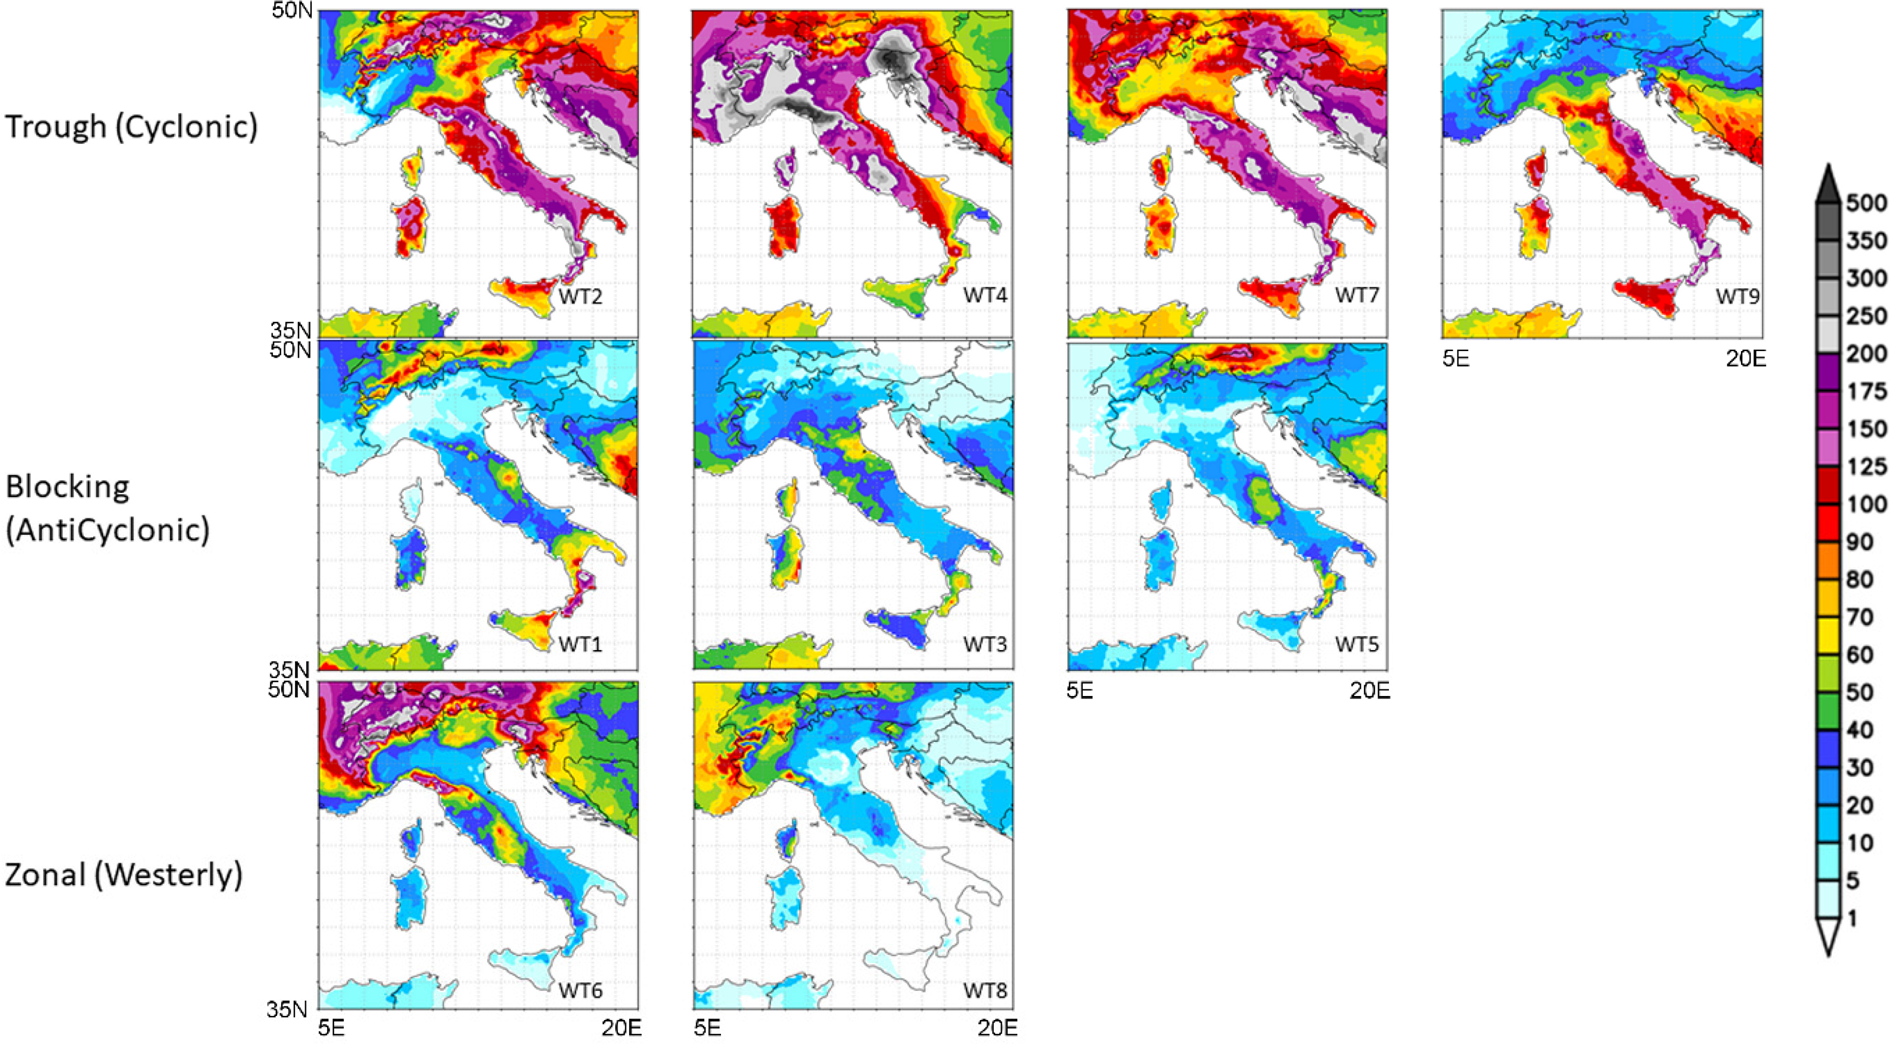
Fig. 3. Colour online. Total precipitation of March for Italy produced by PCT circulation types with a resolution of 25 km. The anomalies refer to the 1981–2010 base period.
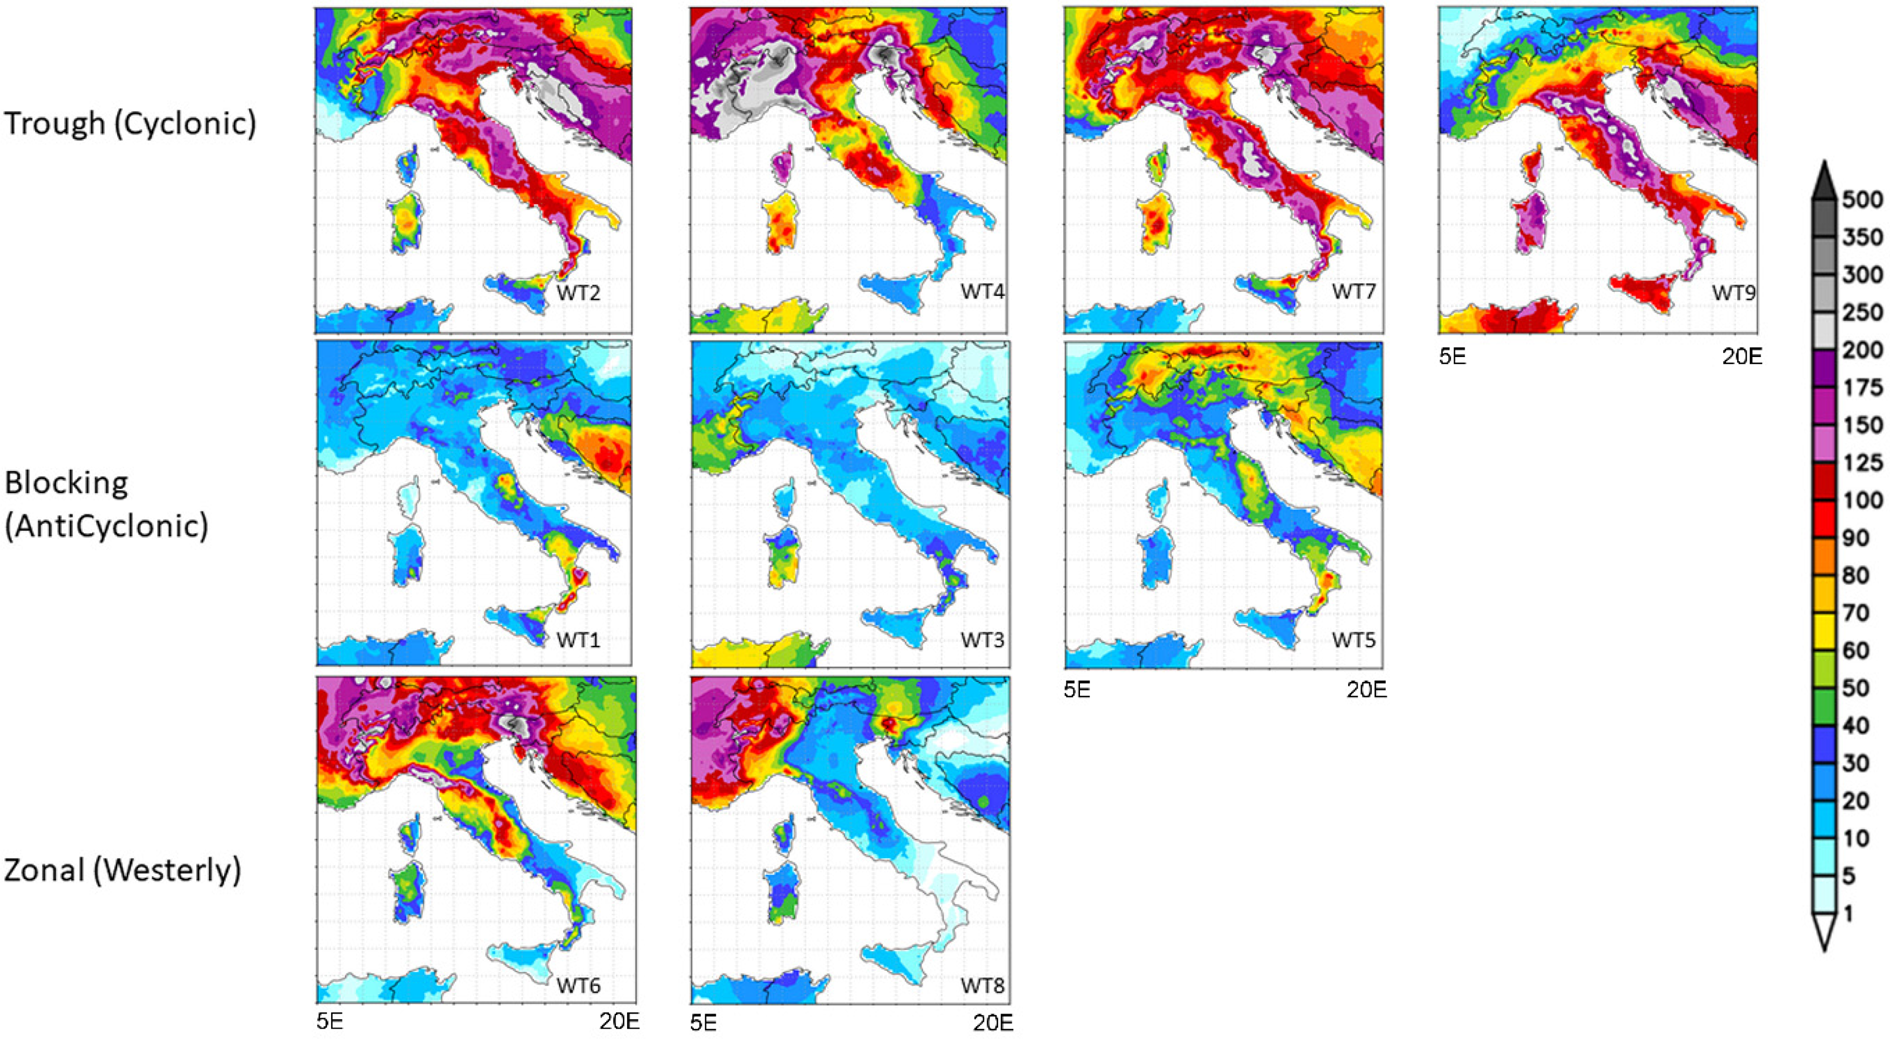
Fig. 4. Colour online. Total precipitation of April for Italy produced by PCT circulation types with a resolution of 25 km. The anomalies refer to the 1981–2010 base period.
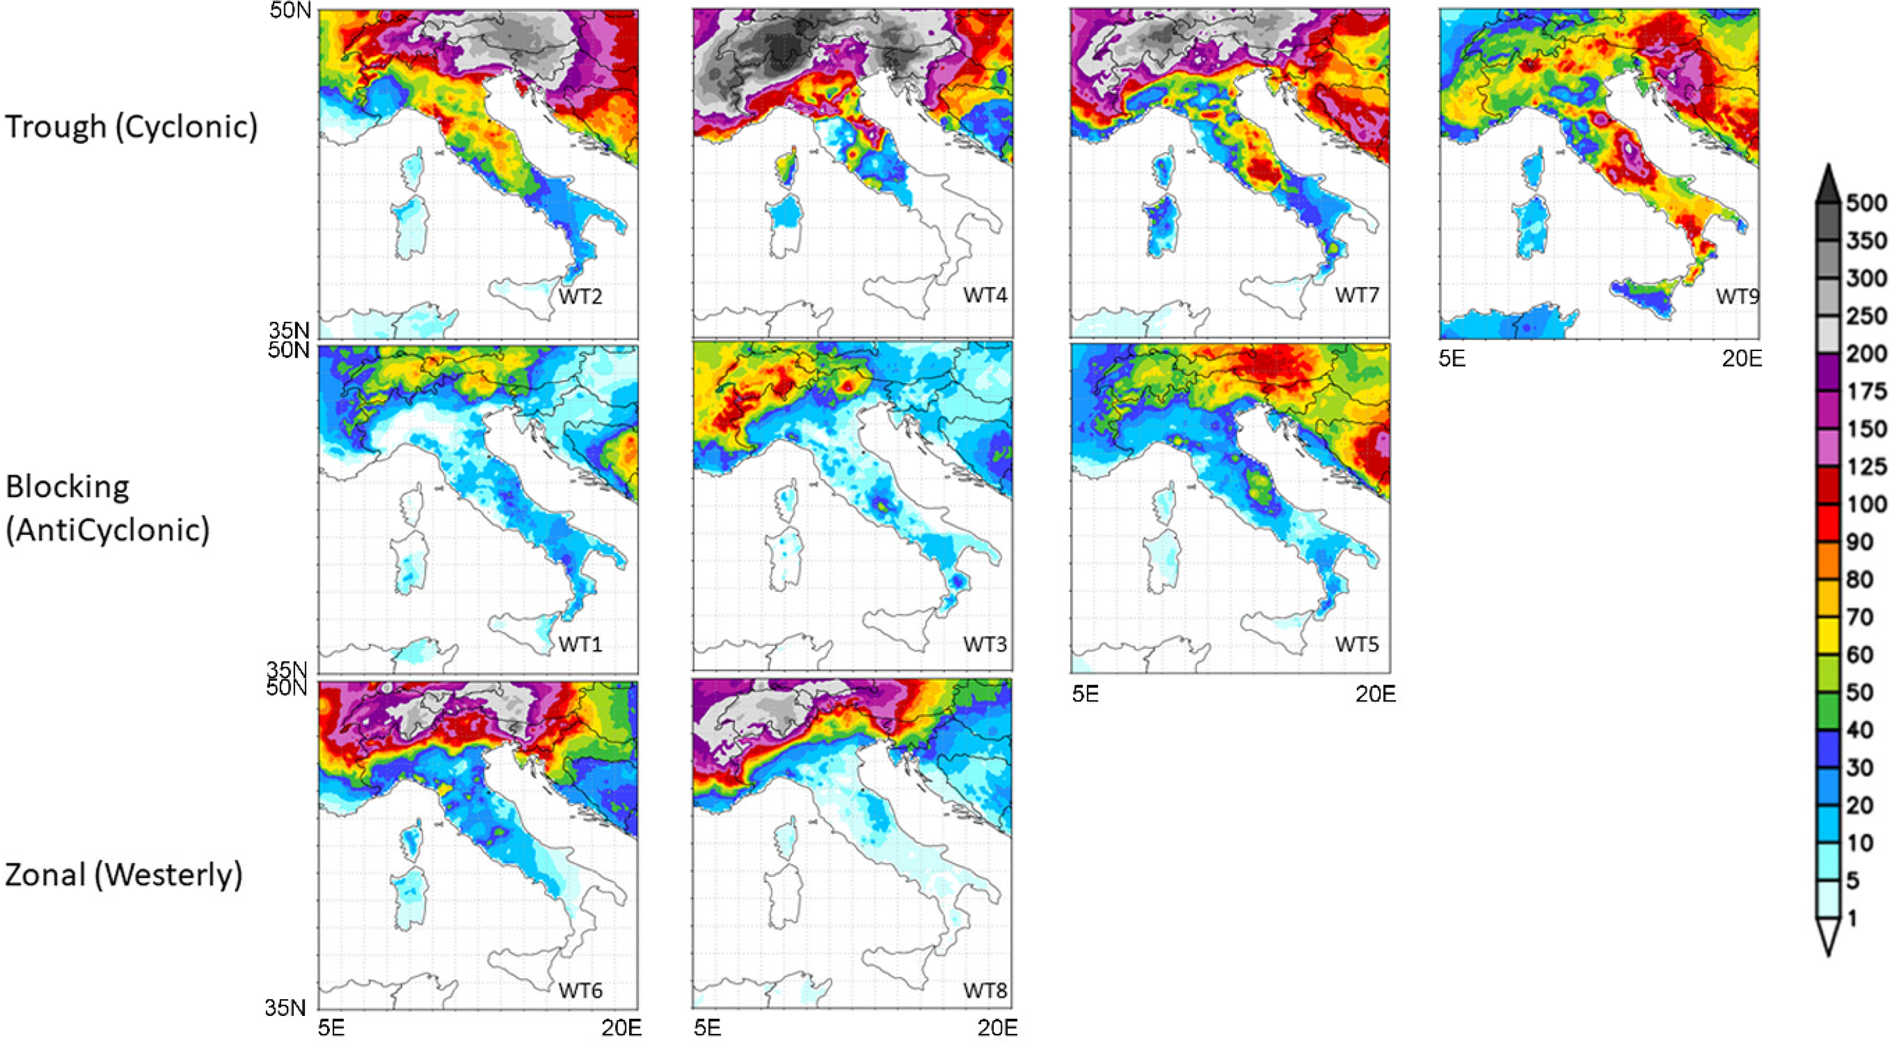
Fig. 5. Colour online. Total precipitation of July for Italy produced by PCT circulation types with a resolution of 25 km. The anomalies refer to the 1981–2010 base period.
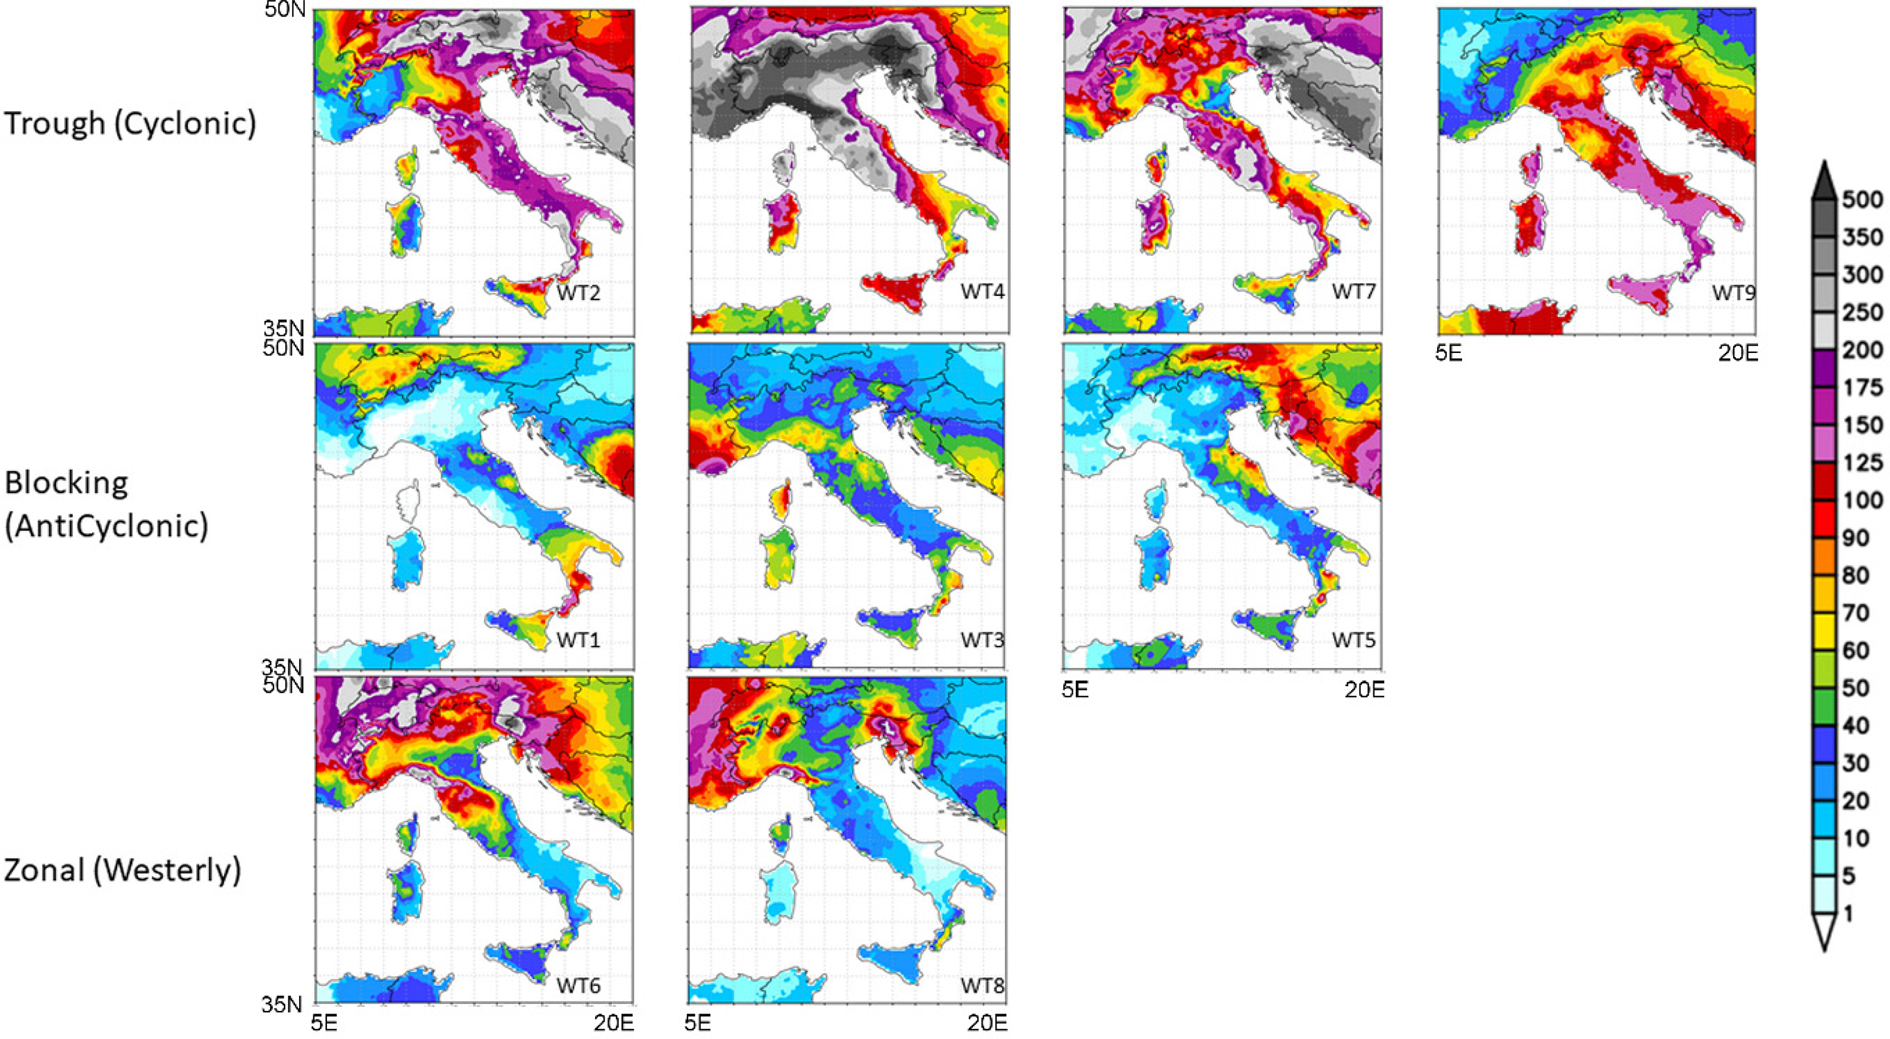
Fig. 6. Colour online. Total precipitation of October for Italy produced by PCT circulation types with a resolution of 25 km. The anomalies refer to the 1981–2010 base period.
Teleconnections between large-scale patterns of climate variability, circulation regimes and weather types
Large scale
For temperate variability, the NAO and SNAO were naturally correlated significantly (Table 2) for July, and July/August. In the tropics, both WAM and SHL contribute to the positioning of the ITF, with a major role played by SHL during the period 1979–2010. This is when the SHL intensity increased the temperature gradient between the Gulf of Guinea and the Sahara (Lavaysse et al., Reference Lavaysse, Flamant, Evan, Janicot and Gaetani2016). For temperate/tropical interactions, there is a very strong relationship between the July ITF position and the SNAO (1% significance). With a positive SNAO, the location of higher sea-level pressures over northern Europe allows a more northern location of the ITF, while there is almost no correlation between NAO and ITF.
Table 2. Teleconnections between the North Atlantic Oscillation (NAO), Summer North Atlantic Oscillation (SNAO), Intertropical Front (ITF) and the West African Monsoon (WAM)
Period: a June; b July; c August; d September; e July–August; f June–July–August; g July–August–September; h June–July–August–September.
P levels (*P < 0.05, **P < 0.01, ***P < 0.001).
Weather regimes and types
Circulation regimes and weather types reveal significant linkages (Table 3). Those with temperate modes of variability were strong. The links of NAO with blocking, especially over central Europe (WT5 and WT3) in June, July and August (JJA), were significantly high. Anticyclones over central Europe were prominent during positive NAO events, but not further west (WT1). Zonal westerlies (WT6) tended to be absent especially in the late summer of July, August and September (JAS). Similarly, with positive SNAO episodes, although lack of zonal flow (WT6) occurred with easterly circulation over the western central Mediterranean.
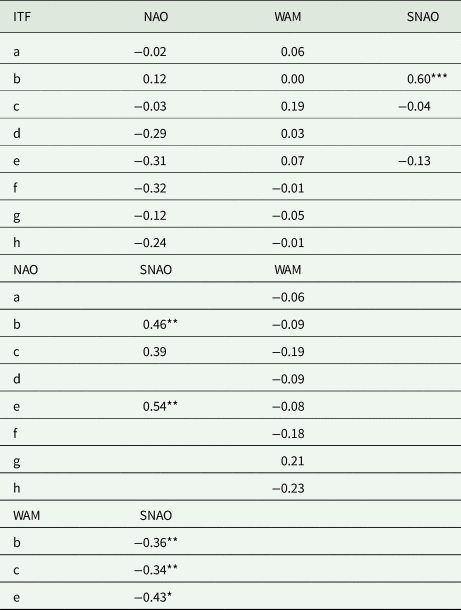
Table 3. Relationships between the NAO, SNAO, WAM and the ITF

Circulation regime: TR, trough; BL, block; Zo, zonal.
Period: a June; b July; c August; d September; e July–August; f June–July–August; g July–August–September; h June–July–August–September.
P levels (*P < 0.05, **P < 0.01, ***P < 0.001).
The tropical ITF teleconnections occurred only in late summer JAS. This was amazingly strong in August (r = 0.89) with WT7, when the ITF was at its northernmost position, indicating more cyclonic circulation regimes (troughing) over southern central Europe when the ITF was further south than normal. In this same month, WT1 was more prevalent when the ITF was displaced northward. For JJA, troughing had a tendency towards high frequencies when the ITF was displaced south. When the WAM was strong, blocking was prevalent over western central Europe (WT1) compared with central Europe (WT5), and sometimes more zonal flow in early summer (WT6).
Links between climate variability and crop yields
All the crops examined indicated a significant relationship between yield and large-scale circulation (Table 4). Barley yields are clearly linked to the latitude of the ITF. During summer, the further north (south) the ITF was, the lower (higher) the yield. In contrast, durum wheat yields were weakly associated with the latitude of the ITF.
Table 4. Relationships between crop yields and the North Atlantic Oscillation (NAO), West African Monsoon (WAM) and the Intertropical Front (ITF)

Period: a June; b July; c August; d September; e July–August; f June–July–August; g July–August–September; h June–July–August–September.
P levels (*P < 0.05, **P < 0.01, ***P < 0.001).
Olive crops had highly significant correlations (1%) with the latitude of the ITF – higher yields occurred when the ITF was further south (north). Sunflower yields displayed some teleconnections with the WAM. When this feature was more vigorous, yields were lower.
Effects of circulation regimes and weather types on crop yields
Depending on the time of year, the circulation regimes and weather types had impacts on winter and spring crop yields (Table 5). For barley yields, WT6 and WT9 during the crop maturation phase (May–June) were the most important types. WT6, zonal flow over Europe, produces lower precipitation over Tuscany (Fig. 2), whereas WT9 with summer troughs in the central Mediterranean give higher precipitation, increasing barley yields. For durum wheat, troughing during the ripening period was especially important (WT2) increasing moisture whilst blocking (WT5) led to lower yields. Troughing regime prevalence increased yields. For warm season crops (olives and sunflowers), the important regimes and types differed. The presence or absence throughout the season of WT2 was important – north easterlies overall, bringing cooler drier conditions in Tuscany favoured increased sunflower yields. Conversely, lack of WT8 and the zonal regime was detrimental between April and June, where there are very significant correlations (>1%). Easterly circulation tends to be warmer and drier.
Table 5. Relationships between crop yields and weather regimes and types
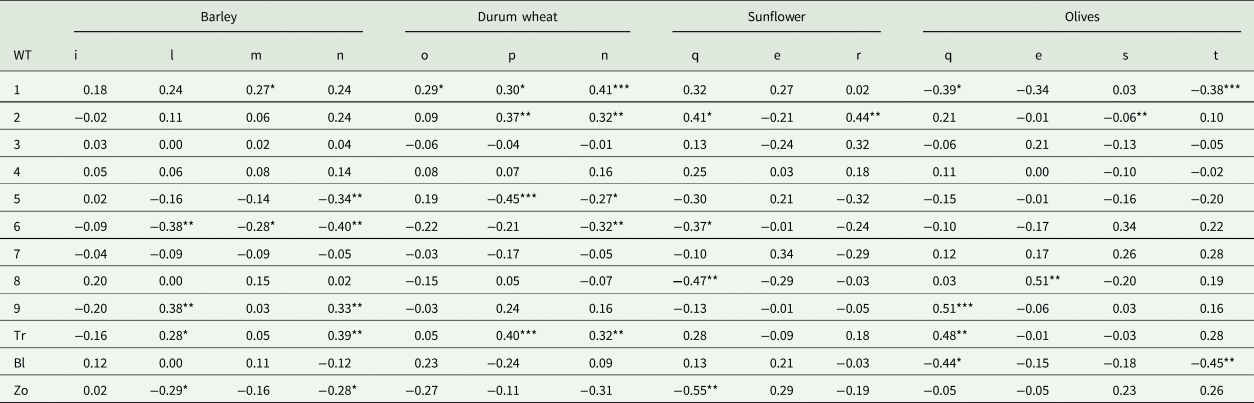
Circulation regime: TR, trough; BL, block; Zo, zonal.
Period: e July-August; i March and April; l May and June; m from March to June; n from March to July; o from March to May; p June and July; q from April to June; r from April to August; s from September to November; t from April to November.
P levels (*P < 0.05, **P < 0.01, ***P < 0.001).
Olive yields responded to more troughs, especially WT9 which produces above-normal precipitation between April and June. WT8 was important later during July and August. For the entire season, blocking circulation which produces warmer and drier conditions was detrimental to yield.
Discussion
Climate variability in the temperate and the subtropical parts of Europe and North Africa has significant effects on crop yields in Tuscany. Positive NAO leads to drier than normal winters in Tuscany, with the reverse when it is negative. Conversely, a positive (negative) SNAO produces above-normal JA precipitation. When ITF moves north, hot air masses are displaced from the Libyan Desert over Italy, bringing hot and dry conditions in Tuscany. In short, when the WAM is strong, the ITF reaches its northernmost position, and blocking is prevalent over north west (WT1) in contrast to central Europe (WT5), with a lack of troughing over Italy.
Both barley and olive oil yields decline significantly when the ITF is further north suggesting that this feature nudges the Libyan high over the central Mediterranean, producing warmer and drier conditions. Durum wheat is affected by the ITF to a lesser extent, probably because it is more drought-resistant. Sunflower production showed associations with the WAM, but the correlation is not statistically significant.
During JJA, blocking regimes WT5 and WT3 active over central Europe were highly significant. Anticyclones over central Europe were prominent during positive NAO events, but not further west (WT1). Zonal westerlies (WT6) tended to be absent, especially in JAS. Similar conditions prevail with negative SNAO episodes, with a lack of zonal flow (WT6), when easterly circulation occurs over the western central Mediterranean.
For both barley and durum wheat, warm dry conditions during the grain filling and ripening period decreased, whilst wetter conditions increased yields in Tuscany (see WT5 and through circulation precipitation anomaly in Appendix 2). According to Porter and Gawith (Reference Porter and Gawith1999), barley and winter wheat seed germination occurs under a wide range of temperatures (3.5–32.7°C), as well as flowering and grain filling stages (9.5–31 and 9.2–35.4°C, respectively), and consequently, an increase in global temperatures and changes in precipitation patterns can contribute to an increase of crop evapotranspiration, making water a potentially limiting factor for crop production in many areas, especially in the Mediterranean. Moore and Lobell (Reference Moore and Lobell2015) confirm that water is among the most important inputs in agriculture for enhancing and stabilizing crop production and is a limiting factor in warm areas such as the Mediterranean region where water resources are limited.
Anticyclones over central Europe induce a decrease in the yield of both crops, as a zonal flow does for barley. Conversely, the presence of troughs over southern Italy increases barley yields, as do, generally, the presence of a trough circulation for both crops. These results are confirmed by Dolferus et al. (Reference Dolferus, Ji and Richards2011) for barley and wheat which, like other cereal crops, are vulnerable to water stress depending on which phenological stages the stress occurs (Dolferus et al., Reference Dolferus, Ji and Richards2011). In particular, when water stress occurs before or at anthesis, it mainly affects the grain number by inducing pollen sterility, while stress at grain filling and ripening may reduce kernel weight and size (Labuschagne et al., Reference Labuschagne, Elago and Koen2009).
The effects of climate variability on sunflower crops were random, probably because of being a more drought-tolerant crop suitable for regions affected with water scarcity, and because of crop management and cultural practices (irrigation and pesticide application which is a common practice) (Debaeke et al., Reference Debaeke, Casadebaig, Flenet and Langlade2017). Many studies confirm that vulnerability to climate variability can significantly vary from crop to crop and, for example, summer crops have a physiological higher tolerance to warm climates (Gay et al., Reference Gay, Corbineau and Come1991; Najeeb et al., Reference Najeeb, Tan, Sarwar, Ali, Sarkar, Sensarma and vanLoon2019).
For olive crops, the blocking circulation over the entire season, with associated hot and dry conditions, decreased yields, thus confirming results from other studies showing that olive crops are affected by adverse environmental factors (i.e. water scarcity, heat and high irradiance). For example, despite olives having a strong tolerance to drought (Baldi et al., Reference Baldi, Brandani, Petralli, Messeri, Cecchi, Vivoli and Mancini2019), some experiments performed in Spain observed as crop water demand for olive range between 485 and 600 mm per growing season (Palomo et al., Reference Palomo, Moreno, Fernández, Díaz-Espejo and Girón2002). Consequently, the cultivation of olive tree crops in the Mediterranean area can be challenging during the extremely dry summers expected to be more frequent due to climate change (Brito et al., Reference Brito, Dinis, Moutinho-Pereira and Correia2019). Troughing circulation, especially in southern Italy (WT9), was most important in late spring, likely due to the positive anomaly precipitation in April and June as well as the zonal flow (WT8) in early summer (Appendix 2).
Conclusion
The weather types and circulation regimes approach leads to good results in explaining the alternation of crop yields in Tuscany both for winter crops (barley, durum wheat) and for warm season crops (olives and sunflower), and in particular, the effects proved to be different according to the crop phenological phases. The study highlights that blocking circulation during the growing season, with associated hot and dry conditions, decreases yield for olive crops, barley and durum wheat. For this reason, the extension of this study to other crops and other geographical areas could allow the creation of a useful database to predict the crop yields according to the prevailing forecast weather types (i.e. by using seasonal forecasts). Finally, this study focused on the impact of climate on crops but other factors, such as diseases and pests, variability of cultivated areas, soil variability, variability of agronomic practices and crop management, are also important. Their impact can be investigated in future work.
Acknowledgements
A particular thanks to Nicola Gambaro who provided support in the creation of the circulation regime datasets.
Financial support
This research received no specific grant from any funding agency, commercial or not-for-profit sectors.
Conflict of interest
None.
Ethical standards
Not applicable.
Appendix 1
Total precipitation for Tuscany during the period 1981–2010 (Cornes et al., Reference Cornes, Van der Schrier, Van den Besselaar and Jones2018). Colour online
.
Appendix 2
Precipitation anomalies and total precipitation for Italy produced by PCT circulation types (resolution of 25 km) for the months not discussed in the text. The anomalies refer to the 1981–2010 base period.


 Open access