Vitamin D is an essential nutrient required for maintenance of normal bone metabolism(Reference Ebeling, Eisman, Feldman, Pike and Adams1) and regulation of ageing by controlling the activity of a number of ageing processes(Reference Berridge2). Accordingly, vitamin D deficiency leads to skeletal defects that increase the risk of osteoporosis, as well as to non-skeletal effects that increase the risk of age-related chronic diseases including cancer, CVD and type 2 diabetes(Reference Mondul, Weinstein and Layne3–Reference Lucato, Solmi and Maggi6). Vitamin D deficiency is becoming a global health problem(Reference Aspell, Laird and Healy7,Reference Carvalho, Santos and Portugal-Nunes8) . When vitamin D deficiency is defined as a blood 25-hydroxyvitamin D (25(OH)D) concentration <50 nmol/l (20 ng/ml), more than half of the adult populations worldwide are considered to be vitamin D deficient(Reference Aspell, Laird and Healy7,Reference Carvalho, Santos and Portugal-Nunes8) .
Against this backdrop, researchers have tried to identify predictors of vitamin D deficiency that would prevent such a disorder, and a number of factors including low ambient UV radiation, inadequate sun exposure, low vitamin D intake and physiological factors have been reported(Reference Carvalho, Santos and Portugal-Nunes8). Lifestyle is also reported to play a role(Reference Nakamura, Kitamura and Takachi9). To date, most epidemiological studies on predictors of vitamin D levels have been conducted using a cross-sectional design, and only a few longitudinal studies have clarified predictors of natural changes in vitamin D levels in healthy middle-aged(Reference Skaaby, Husemoen and Thuesen10,Reference Mirfakhraee, Ayers and McGuire11) and older people(Reference Yoshimura, Muraki and Oka12,Reference van Schoor and Knol13) . Among these, three studies(Reference Mirfakhraee, Ayers and McGuire11–Reference van Schoor and Knol13) aimed to identify demographic factors, BMI and season in relation to changes in blood 25(OH)D. Skaaby et al.(Reference Skaaby, Husemoen and Thuesen10) explored lifestyle factors associated with longitudinal changes in blood 25(OH)D in participants of a lifestyle-modification-based randomised controlled trial. However, because their findings were obtained in a randomised controlled trial setting, blood 25(OH)D concentrations had increased by the end of follow-up, and predictors of vitamin D decline in vitamin D status (hereafter, ‘vitamin D decline’) could not be analysed.
The main purpose of the Murakami Cohort Study, a population-based cohort study, was to investigate the effects of vitamin D on age-related chronic diseases(Reference Nakamura, Kitamura and Takachi9,Reference Nakamura, Takachi and Kitamura14) . In the baseline study, our cross-sectional data indicated that a number of socio-demographic and lifestyle factors were associated with low vitamin D levels(Reference Nakamura, Kitamura and Takachi9). In this framework, blood 25(OH)D concentrations of participants have been assessed at baseline and 5-year follow-up, that enabled us to evaluate changes in vitamin D levels. One difficulty of examining predictors of change in 25(OH)D concentrations relates to the date of blood collection, because seasonal variation in blood 25(OH)D concentrations is large(Reference Nakamura, Kitamura and Takachi9,Reference Mirfakhraee, Ayers and McGuire11) . Notably, previous studies did not accurately control for seasonal effects on changes in blood 25(OH)D concentrations(Reference Yoshimura, Muraki and Oka12,Reference van Schoor and Knol13) . To address this issue, we only used follow-up blood samples date-matched to the baseline samples to measure follow-up blood 25(OH)D concentrations. The purpose of the present study was to determine predictive factors of vitamin D decline over 5 years in middle-aged to elderly individuals. In addition, we compared blood 25(OH)D concentrations at baseline with those 5 years later.
Methods
Study design and participants
The present study analysed longitudinal data from a population-based cohort study of age-related musculoskeletal diseases in the Murakami region of Niigata, Japan, specifically targeting individuals aged between 40 and 74 years (Murakami Cohort Study(Reference Nakamura, Takachi and Kitamura14)). At baseline, 8497 individuals agreed to participate in the blood examination. Of these, 2736 who participated in the community-based health check examination provided by the local government were selected to form the study population for long-term follow-up, which included biochemical sampling and analysis. Of the 2736, 2341 participated in the health check examination 5 years later and provided a blood sample. Of the 2341, we were limited to 1053 blood samples that were taken between May and July near the date of the baseline examination (±14 d) to use for the biochemical analysis of 25(OH)D, because the season and month when a blood sample is collected can be strong determinants of blood 25(OH)D concentrations(Reference Nakamura, Kitamura and Takachi9). Two men (0·5 %) and seven women (1·1 %) used vitamin D supplements, and these individuals were excluded because amounts of supplements were not determined. Ultimately, 1044 participants were analysed. Informed consent was obtained from all participants of the Murakami Cohort Study. The Ethics Committee of Niigata University approved the study protocol.
Baseline examination
In 2011–2013, we conducted a baseline investigation of the Murakami Cohort Study, in which participants completed a self-administered questionnaire about their lifestyle information and we took measurements of their 25(OH)D concentrations. Non-fasting blood specimens were obtained using EDTA-2Na-containing tubes, and plasma 25(OH)D concentrations were determined with the Liaison® 25OH Vitamin D Total Assay (DiaSorin Inc.). Intra- and inter-assay CV values at baseline were 3·2–8·1 and 6·9–12·7 %, respectively. Details of 25(OH)D measurement were described previously(Reference Nakamura, Kitamura and Takachi9). Serum creatinine concentrations were measured by the enzymatic method in the health check examination in 909 of 1044 participants, and we estimated glomerular filtration rate (ml/kg per 1·73 m2) using the Japanese equation as follows: 194 × (serum creatinine)-1·094 × age (years)-0·287 (×0·739 (for women))(Reference Matsuo, Imai and Horio15).
The self-administered questionnaire asked about participant demographic characteristics, height, weight and lifestyles. Demographic characteristics included age, sex, occupation (outdoor job such as farmer/fisherman or others), education level and vitamin D supplement use. BMI was calculated by dividing weight (kg) by height squared (m2). Physical activity levels were assessed by determining participant metabolic equivalent (MET) score (MET-h/d), obtained by multiplying the time score spent with activities by its MET intensity(Reference Fujii, Yamamoto and Takeda-Imai16). Time spent outdoors per d in the last week (<20, 20–39, 40–59, 60–179 and ≥180 min/d) and sunscreen use were determined. Vitamin D intake and Ca intake were assessed with a validated FFQ(Reference Yokoyama, Takachi and Ishihara17). Smoker status was classified as non-smoker, past smoker, current smoker <20 cigarettes/d or current smoker ≥20 cigarettes/d. Alcohol consumption was classified into five categories: (1) non- or rare drinkers, (2) 1–149, (3) 150–299, (4) 300–449 or (5) ≥450 g ethanol per week. Consumption of green tea and coffee was classified as (1) <1 cup/week, (2) 1–6 cups/week, (3) 1–3 cups/d and (4) ≥4 cups/d. Details of the questionnaire survey are described elsewhere(Reference Nakamura, Takachi and Kitamura14).
Determination of 25-hydroxyvitamin D concentrations at the 5-year follow-up examination
The 5-year follow-up examination was conducted as an annual health check examination provided by the local government in 2016 and 2017. Non-fasting blood (serum) was collected, and serum 25(OH)D concentrations were determined with the Liaison® 25OH Vitamin D Total Assay. Intra- and inter-assay CV values were 5·1–6·9 and 6·3–7·3 %, respectively. Although plasma and serum 25(OH)D concentrations were very highly correlated, the absolute values differed slightly. Using our subsamples at baseline (n 77), Spearman’s correlation coefficient between the two was calculated to be 0·960, and its regression equation was (plasma 25(OH)D at baseline) = 0·88 × (serum 25(OH)D 5 years later) + 2·79. In this equation, serum 25(OH)D concentrations measured at the 5-year follow-up were adjusted to plasma value equivalents. In the present study, we aimed to determine characteristics of individuals exhibiting apparent vitamin D decline, which was defined as the lowest tertile of 5-year changes in blood 25(OH)D (Δ25(OH)D) concentration (<–6·8 nmol/l). Mean Δ25(OH)D concentration in the lowest tertile was –15·0 (sd 7·3) nmol/l (n 348), and that in the other tertiles combined was 4·5 (sd 8·3) nmol/l (n 691).
Statistical analysis
All continuous variables were assessed for normality. Because MET scores, vitamin D intake, Ca intake and estimated glomerular filtration rate were skewed to higher values, they were logarithmically transformed when statistical tests were conducted. Regarding BMI, MET score, vitamin D intake, Ca intake and estimated glomerular filtration rate, values exceeding ±3 sd were considered outliers and excluded. A statistical difference in mean values between two groups was evaluated by t test. Strength of correlation and agreement between baseline and follow-up blood 25(OH)D concentrations were assessed with Pearson’s correlation coefficient and weighted κ coefficient, respectively. Linear associations between predictor variables at baseline and 5-year changes in blood 25(OH)D (Δ25(OH)D) concentrations were assessed by linear regression analysis, adjusting for baseline 25(OH)D concentrations, because baseline 25(OH)D was the strongest predictor of Δ25(OH)D (β = –0·42, R 2 0·320, P < 0·0001). Associations between predictor variables at baseline and vitamin D decline were assessed with OR calculated by multiple logistic regression analyses, adjusting for all other predictor variables (age (continuous), BMI (continuous), education level, MET score (continuous), vitamin D intake (continuous), outdoor occupation (dummy variable), time spent outdoors, sunscreen use (dummy variable), smoking, alcohol consumption, green tea consumption, coffee consumption and baseline 25(OH)D concentrations. P for trend values were calculated with multiple logistic regression analysis. SAS (release 9.13; SAS Institute Inc.) was used for statistical analyses. P < 0·05 was considered statistically significant.
Results
Baseline participant characteristics are shown by sex in Table 1. A significant sex-dependent difference was found in all variables, except for estimated glomerular filtration rate. Mean blood 25(OH)D concentrations at the 5-year follow-up were 52·1 (sd 15·7) nmol/l in men and 44·7 (sd 12·9) nmol/l in women (P < 0·0001), and mean Δ25(OH)D concentrations were –4·0 (sd 15·2) nmol/l in men and –0·4 (sd 12·4) nmol/l in women (P < 0·0001). Mean Δ25(OH)D concentrations according to age group by sex are shown in online Supplementary Table S1. Proportions of those showing vitamin D decline (Δ25(OH)D < –6·7 nmol/l) during the 5 years were 182/438 (41·6 %) in men and 166/606 (27·4 %) in women (P < 0·0001). Changes in body weight in 970 of 1044 participants, measured by a precise method in the health check examination, are shown in online Supplementary Table S2.
Table 1. Participant baseline characteristics by sex
(Mean values and standard deviations; numbers of participants and percentages)

MET, metabolic equivalent; 25(OH)D, 25-hydroxyvitamin D.
* Values were log-transformed when conducting the t test.
25(OH)D concentrations at the 5-year follow-up were significantly correlated with baseline 25(OH)D concentrations (P < 0·0001, r 0·621). Agreement of quartiles of blood 25(OH)D concentrations at baseline and 5 years later is shown in Table 2. Simple and weighted κ coefficients were 0·31 (95 % CI 0·27, 0·35) and 0·47 (95 % CI 0·43, 0·51), respectively.
Table 2. Quartiles of blood 25-hydroxyvitamin D (25(OH)D) concentrations at baseline and 5 years laterFootnote *
(Numbers of participants)

* Weighted κ coefficient was 0·47 (95 % CI 0·43, 0·51).
Baseline 25(OH)D concentrations were robustly associated with Δ25(OH)D concentrations (β = –0·46, P < 0·0001, R 2 = 0·306). Table 3 shows the associations between baseline variables and Δ25(OH)D concentrations adjusted for baseline 25(OH)D concentrations by sex. Higher MET scores, an outdoor occupation, and time spent outdoors in men and higher vitamin D intake and higher green tea consumption in women were significantly associated with higher Δ25(OH)D concentrations.
Table 3. Linear association between baseline characteristics and 5-year changes in blood 25-hydroxyvitamin D concentrations (nmol/l) analysed by linear regression analyses adjusted for baseline 25-hydroxyvitamin D concentrations

MET, metabolic equivalent.
* Values were log-transformed when conducting linear regression analysis.
† Outdoor occupation includes farmers and fishermen.
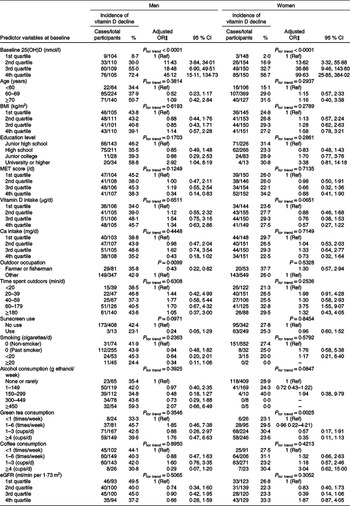
Sex-stratified incidence and adjusted OR for vitamin D decline according to levels of baseline variables are shown in Table 4. In men, risk of vitamin D decline was significantly lower in those with an outdoor occupation and the highest quartile of MET score and was higher in those with a ‘university or higher’ level of education. In women, risk of vitamin D decline was significantly lower among those with higher vitamin D intake (marginal significance, P for trend = 0·0651) and green tea consumption.
Table 4. Incidence and risk for vitamin D decline* according to levels of potential predictor variables at baseline by sex†
(Number of cases divided by number of total participants and percentages for incidence; adjusted odds ratios and 95 % confidence intervals)

25(OH)D, 25-hydroxyvitamin D; MET, metabolic equivalent; eGFR, estimated glomerular filtration rate.
* 5-year changes in blood 25(OH)D concentration <6·7 nmol/l.
† Quartile cut-off values of baseline 25(OH)D: 43·4, 55·4 and 67·6 for men, 34·4, 44·1 and 53·4 for women; BMI: 21·6, 23·3 and 25·2 for men, 20·8, 22·3 and 24·2 for women; MET score: 40·0, 43·3 and 48·9 for men, 39·5, 42·1 and 47·3 for women; vitamin D intake: 4·7, 8·4 and 13·0 for men, 5·6, 8·9 and 14·2 for women; Ca intake: 351, 504 and 649 for men, 442, 604 and 850 for women; eGFR: 64·9, 74·4 and 84·7 for men, 64·2, 74·7 and 80·7 for women.
‡ Adjusted for other predictor variables, including 25(OH)D, age, BMI, education level, MET score, vitamin D intake, outdoor occupation, time spent outdoors, sunscreen use, smoking, alcohol consumption, green tea consumption and coffee consumption.
Regarding sex differences, multiple linear regression analysis revealed that Δ25(OH)D concentrations were not significantly different after adjusting for all covariates (P = 0·1516). Multiple logistic regression analysis revealed no significant sex-dependent differences in vitamin D decline after adjusting for all covariates (adjusted men’s OR = 0·76, P = 0·3098).
Discussion
Theoretically, vitamin D decline primarily occurs due to a decrease in vitamin D biosynthesis in the skin following sunlight exposure, intake of vitamin D-containing foods or both. With this in mind, the present study aimed to determine predictors of 5-year vitamin D decline. As behaviours differ between men and women, our statistical analysis was stratified by sex. We determined that vitamin D decline was primarily explained by baseline blood 25(OH)D concentrations in both sexes.
The highest level of physical activity and having an outdoor occupation were associated with a lower risk of vitamin D decline in men. Men with these characteristics are likely to have higher exposure to sunlight and thus produce vitamin D in the skin. Physical activity levels were not associated with risk of vitamin D decline in women. This may be explained by the fact that women are more likely to cover their skin and use sunscreen to avoid sun exposure.
We also found a higher risk of vitamin D decline among men with a university or higher education (OR 2·84), with a similar trend observed in women (OR 3·29). Cross-sectional data from our baseline study have indicated an association between higher levels of education and low vitamin D levels in women(Reference Nakamura, Kitamura and Takachi9); the same finding was reported by another study in Taiwan(Reference Lee, Hsu and Wu18). This may be explained by the fact that those with higher education levels are more likely to have indoor occupations and/or behaviours in which they avoid sunlight exposure. Considering the above, individuals with higher education levels represent the population facing the highest risk of vitamin D decline.
The present study revealed that lower vitamin D intake was a predictor of vitamin D decline in women only. Vitamin D in the diet of Japanese people comes primarily from fish(Reference Nakamura, Nashimoto and Okuda19), and dietary intake of vitamin D can help maintain the low levels synthesised in the skin in winter, when sun exposure is low(Reference Nakamura20). As women tend to have lower vitamin D levels specifically because they avoid sunlight exposure(Reference Nakamura, Kitamura and Takachi9), intake of dietary vitamin D may play an important role in the long-term maintenance of vitamin D levels in women.
Green tea, a common drink in Japan, has been reported to have favourable effects on health due to its high content of antioxidant catechins(Reference Cabrera, Artacho and Giménez21). The present study found that higher green tea consumption was associated with a lower risk of vitamin D decline, consistent with the results of our cross-sectional study, which showed a positive association between green tea consumption and blood 25(OH)D concentrations(Reference Nakamura, Kitamura and Takachi9). A cross-sectional study conducted in Taiwan also found that lower tea consumption was associated with vitamin D deficiency(Reference Lee, Hsu and Wu18). Two mechanisms may explain these findings. First, there may be a chemical substance in green tea that affects vitamin D metabolism, but this has not been reported so far. Second, green tea drinkers may also share behavioural traits with individuals with high vitamin D levels, such as ensuring sufficient sunlight exposure. Both vitamin D and catechins have potentially beneficial effects on human health, and thus the interaction between these should be examined.
The present study revealed strong agreement in blood 25(OH)D concentrations at baseline and those 5 years later using date-matched blood samples. These yielded a correlation coefficient of 0·604 and agreement for weighted κ coefficient of 0·47, indicating a moderate association. This information is useful for evaluating long-term changes in vitamin D levels in older adults.
One strength of the present study is that it is the first to determine predictors of vitamin D decline in community-dwelling middle-aged and elderly individuals. In particular, we eliminated seasonal effects of sunlight exposure, a major determinant of vitamin D levels, allowing for a sensitive evaluation of lifestyle and behavioural predictors of vitamin D decline.
Our study also has several limitations. First, the definition of vitamin D decline in the present study is tentative and should be discussed further. In addition, little evidence is available concerning the magnitude of vitamin D decline in relation to disease occurrence. Finally, as information on lifestyle was self-reported, non-differential misclassification bias was likely to be introduced, which can reduce the strength of the observed associations.
Conclusion
The present study first revealed predictors of 5-year decline in vitamin D status, while controlling sufficiently for seasonal effects of sunlight exposure in middle-aged and elderly individuals. Identified predictors of vitamin D decline in men are a high education level, low physical activity and a non-outdoor occupation. In women, lower vitamin D intake and green tea consumption were identified as predictors. This suggests that a sex-dependent intervention may be useful for the maintenance of long-term vitamin D levels.
Acknowledgements
We are indebted to Kyowa Medex Co., Ltd and DiaSorin, Inc. for providing the 25(OH)D assay. We also thank the following institutions for their help in blood sample collection: Murakami City Government, Sekikawa Village Government, Awashimaura Village Government, the Medical Association of Murakami City and Iwafune District, Murakami General Hospital, Niigata Prefectural Sakamachi Hospital, Sampoku Tokushukai Hospital, Murakami Memorial Hospital, Senami Hospital, Sakanamachi Hospital, Aoki Clinic, Arakawa Chuo Clinic, Anzai Clinic, Hatori Clinic, Homma Clinic, Iga Clinic, Otabe Clinic, Sakura Clinic of Internal Medicine, Sano Clinic, Sato Clinic, Sato Clinic of Internal Medicine, Sato Clinic of Internal Medicine and Paediatrics, Sawada Clinic, Sega Clinic, Sekikawa Medical Office, Suzuki Clinic (Murakami City), Suzuki Clinic (Tainai City), Shibata Comprehensive Health Care Service Centre, Kenko-Igaku-Yobo-Kyokai, Niigata Association of Occupational Health, Niigata Health Care Association, BML, Inc. and Kotobiken Medical Laboratories, Inc.
This work was supported by JSPS KAKENHI Grants (nos. JP23249035, JP40339958 and JP16K09078) and the National Cancer Center Research and Development Fund (23-A31[toku]) (since 2010).
Authors’ contributions were as follows: study concept and design: K. N., K. Ki., Y. W., T. S. and K. Ka; data collection: K. N., K. Ki., T. S., A. T., R. K., R. O., R. T. and A. S.; data analysis and validation: K. N., K. Ki. and Y. W.; data interpretation: K. N., K. Ki., Y. W., K. Ka., S. T., M. I. and K. W.; writing – original draft: K. N.; writing – review and editing: all authors; approval for the final version of manuscript: all authors.
The authors declare that there are no conflicts of interest.
Supplementary material
For supplementary material referred to in this article, please visit https://doi.org/10.1017/S0007114520001580