


Introduction
Glacier surges are flow instabilities that affect ~1% of the global glacier population (Jiskoot and others, Reference Jiskoot, Murray and Boyle2000; Sevestre and Benn, Reference Sevestre and Benn2015). The traditional surge cycle is characterised by a long (between ~10 to 100+ years) quiescent phase of low ice flow velocities and gradual mass build-up in the glacier accumulation area, punctuated by a shorter (months to years) active or surge phase of enhanced ice velocities and mass redistribution from higher to lower elevations, typically accompanied by a period of glacier terminus advance (Meier and Post, Reference Meier and Post1969; Copland and others, Reference Copland, Sharp and Dowdeswell2003; Murray and others, Reference Murray, Strozzi, Luckman, Jiskoot and Christakos2003; Benn and others, Reference Benn, Fowler, Hewitt and Sevestre2019a, Reference Benn2019b). The oscillation between slow and fast ice flow experienced by surge-type glaciers makes them valuable sources of information on glacier processes, flow dynamics and instabilities (Benn and others, Reference Benn, Fowler, Hewitt and Sevestre2019a). For example, surges have been shown to cause rapid destabilisation and collapse of large marine-terminating glacier systems and ice cap outlet glaciers in the Arctic (McMillan and others, Reference McMillan2014; Sund and others, Reference Sund, Lauknes and Eiken2014; Dunse and others, Reference Dunse2015; Strozzi and others, Reference Strozzi, Kääb and Schellenberger2017; Willis and others, Reference Willis2018; Nuth and others, Reference Nuth2019; Haga and others, Reference Haga2020). At a typically much smaller scale, sudden mountain glacier detachments have been suggested to form part of the continuum of glacier instabilities that includes glacier surges (Kääb and others, Reference Kääb2021).
Switches between slow and fast ice flow during surges have traditionally been viewed as an internal glaciological phenomenon, independent of external (e.g. climatic) forcing (Meier and Post, Reference Meier and Post1969; Kamb and others, Reference Kamb1985; Murray and others, Reference Murray, Strozzi, Luckman, Jiskoot and Christakos2003). However, a close relationship between the distribution of surge-type glaciers and defined climatic envelopes has been established (Harrison and Post, Reference Harrison and Post2003; Sevestre and Benn, Reference Sevestre and Benn2015) and a changing climate is altering the behaviour and distribution of surge-type glaciers (Benn and others, Reference Benn, Fowler, Hewitt and Sevestre2019a). Most theories of surging relate the velocity switches to changes in basal hydrological or thermal conditions (e.g. Kamb and others, Reference Kamb1985; Fowler and others, Reference Fowler, Murray and Ng2001), which Benn and others (Reference Benn, Fowler, Hewitt and Sevestre2019a) combine in their enthalpy cycle model. This theory states that a glacier's enthalpy budget (thermal energy and water gains and losses at the glacier bed) takes the form of geothermal heating plus frictional heating due to ice flow (gains) and heat conduction and meltwater discharge (losses). For steady state flow, a glacier's mass and enthalpy budgets need to simultaneously balance, and surge cycles occur where they are out-of-phase (Benn and others, Reference Benn, Fowler, Hewitt and Sevestre2019a). In both temperate and polythermal glacier surges, enthalpy gains at the glacier bed result in more meltwater being produced than can be evacuated by the basal drainage system (Sevestre and others, Reference Sevestre and Benn2015; Benn and others, Reference Benn, Hewitt and Luckman2023). The accumulation of water at the bed reduces basal friction, increases sliding speeds and draws down mass from the accumulation area. Surges terminate once basal water storage reaches a high enough level for an efficient drainage system to develop, allowing basal water to be evacuated (Benn and others, Reference Benn, Hewitt and Luckman2023). The main distinction between temperate and polythermal surges is that some smaller polythermal surge-type glaciers will only have limited areas of warm-based ice in the quiescent phase. Low ice fluxes result in glacier thickening, with the associated enthalpy gains at the bed leading to progressive basal warming. As the bed warms, the volume of stored water increases, basal friction reduces and the ice accelerates (Fowler and others, Reference Fowler, Murray and Ng2001; Benn and others, Reference Benn, Hewitt and Luckman2023). Larger polythermal glacier surge-type glaciers have been shown to be mainly warm-based apart from a frozen frontal margin, even in quiescence, so thermal switching does not explain surge initiation (Sevestre and others, Reference Sevestre, Benn, Hulton and Bælum2015). However, progressive warming of the frozen frontal zone once the surge is already underway may lead to further acceleration phases (Nuth and others, Reference Nuth2019; Benn and others, Reference Benn2019b; Haga and others, Reference Haga2020).
The Benn and others (Reference Benn, Fowler, Hewitt and Sevestre2019a) general theory of surges helps to reconcile both the distinct geographical clustering of surge-type glaciers within defined climatic envelopes (Jiskoot and others, Reference Jiskoot, Murray and Boyle2000; Sevestre and Benn, Reference Sevestre and Benn2015) and the large diversity in surge characteristics (Benn and others, Reference Benn, Hewitt and Luckman2023). Most surge-type glaciers are found in a few dense regional groupings, which can be broadly categorised into (1) a circum-Arctic population (termed ‘Arctic Ring’ in Sevestre and Benn (Reference Sevestre and Benn2015)), including Alaska-Yukon (Clarke and others, Reference Clarke, Schmok, Ommanney and Collins1986; Harrison and Post, Reference Harrison and Post2003), the Canadian Arctic Archipelago (Copland and others, Reference Copland, Sharp and Dowdeswell2003; Lauzon and others, Reference Lauzon2023), west and east Greenland (Jiskoot and others, Reference Jiskoot, Murray and Luckman2003; Yde and Knudsen, Reference Yde and Knudsen2007), Iceland (Björnsson and others, Reference Björnsson, Pálsson, Sigurđsson and Flowers2003), Svalbard (Jiskoot and others, Reference Jiskoot, Murray and Boyle2000) and the Russian High Arctic (Grant and others, Reference Grant, Stokes and Evans2009; Wytiahlowsky and others, Reference Wytiahlowsky, Stokes and Evans2023); (2) a High Mountain Asia population (Guillet and others, Reference Guillet2022), including the Karakoram (Hewitt, Reference Hewitt1969; Quincey and others, Reference Quincey2011; Bhambri and others, Reference Bhambri, Hewitt, Kawishwar and Pratap2017), Pamirs (Lv and others, Reference Lv2019; Goerlich and others, Reference Goerlich, Bolch and Paul2020), Tien Shan (Mukherjee and others, Reference Mukherjee2017) and the Tibetan Plateau (King and others, Reference King, Bhattacharya and Bolch2021); and (3) a small population in the Andes (Lliboutry, Reference Lliboutry, Williams and Ferrigno1998; Falaschi and others, Reference Falaschi2018). Surges occur in continental and maritime environments, in land-terminating and marine-terminating glaciers, under temperate and polythermal glacier regimes and in all glacier sizes from ice sheet outlet glaciers to mountain glaciers.
Compared to surge clusters in other locations (e.g. Alaska-Yukon, Iceland, Svalbard, Karakoram), the distribution, characteristics and timing of surges in Greenland remain poorly documented (Jiskoot and others, Reference Jiskoot, Murray and Luckman2003). Significant advances have been made over the past few decades, with studies generally focused on a detailed assessment of surging at one or two glaciers (e.g. Colvill, Reference Colvill and Miller1984; Jiskoot and others, Reference Jiskoot, Pedersen and Murray2001; Murray and others, Reference Murray, Strozzi, Luckman, Pritchard and Jiskoot2002; Pritchard and others, Reference Pritchard, Murray, Strozzi, Barr and Luckman2003, Reference Pritchard, Murray, Luckman, Strozzi and Barr2005; Yde and Knudsen, Reference Yde and Knudsen2005; Jiskoot and Juhlin, Reference Jiskoot and Juhlin2009; Mouginot and others, Reference Mouginot, Bjørk, Millan, Scheuchl and Rignot2018; Yde and others, Reference Yde2019; Solgaard and others, Reference Solgaard2020) or inventories of individual clusters (west and east Greenland) or groupings (northern Greenland) of surge-type glaciers (e.g. Jiskoot and others, Reference Jiskoot, Murray and Luckman2003; Yde and Knudsen, Reference Yde and Knudsen2007; Hill and others, Reference Hill, Carr and Stokes2017). Sevestre and Benn (Reference Sevestre and Benn2015) represent the most-comprehensive attempt at a Greenland-wide assessment of surge-type glacier distribution since Weidick (Reference Weidick1988), albeit as part of a global investigation into surge-type glaciers and thus limited to published reports of surging. In particular, quantitative data on spatio-temporal patterns of surge behaviour are notably lacking in previous work. Newly available and accessible multi-temporal remote sensing datasets present an opportunity to explore the distribution and characteristics of surge-type glaciers across Greenland in more detail. A better understanding of surge-type glaciers in Greenland can, therefore, provide important information on glacier instabilities in a region that has been experiencing warming air temperatures (e.g. Abermann and others, Reference Abermann2017; Hanna and others, Reference Hanna2021), warming ocean waters (e.g. Murray and others, Reference Murray2010; Straneo and others, Reference Straneo2012), increasing precipitation (Mernild and others, Reference Mernild2015) and accelerating glacier change (e.g. Khan and others, Reference Khan2022; Carrivick and others, Reference Carrivick2023a).
Our study aims to: (1) produce an updated surge-type glacier inventory for Greenland; (2) provide the first analysis of spatio-temporal patterns of surging in Greenland; and (3) explore the association of glacier geometric properties and regional climate conditions with surge-type glacier distribution.
Surge-type glaciers in Greenland
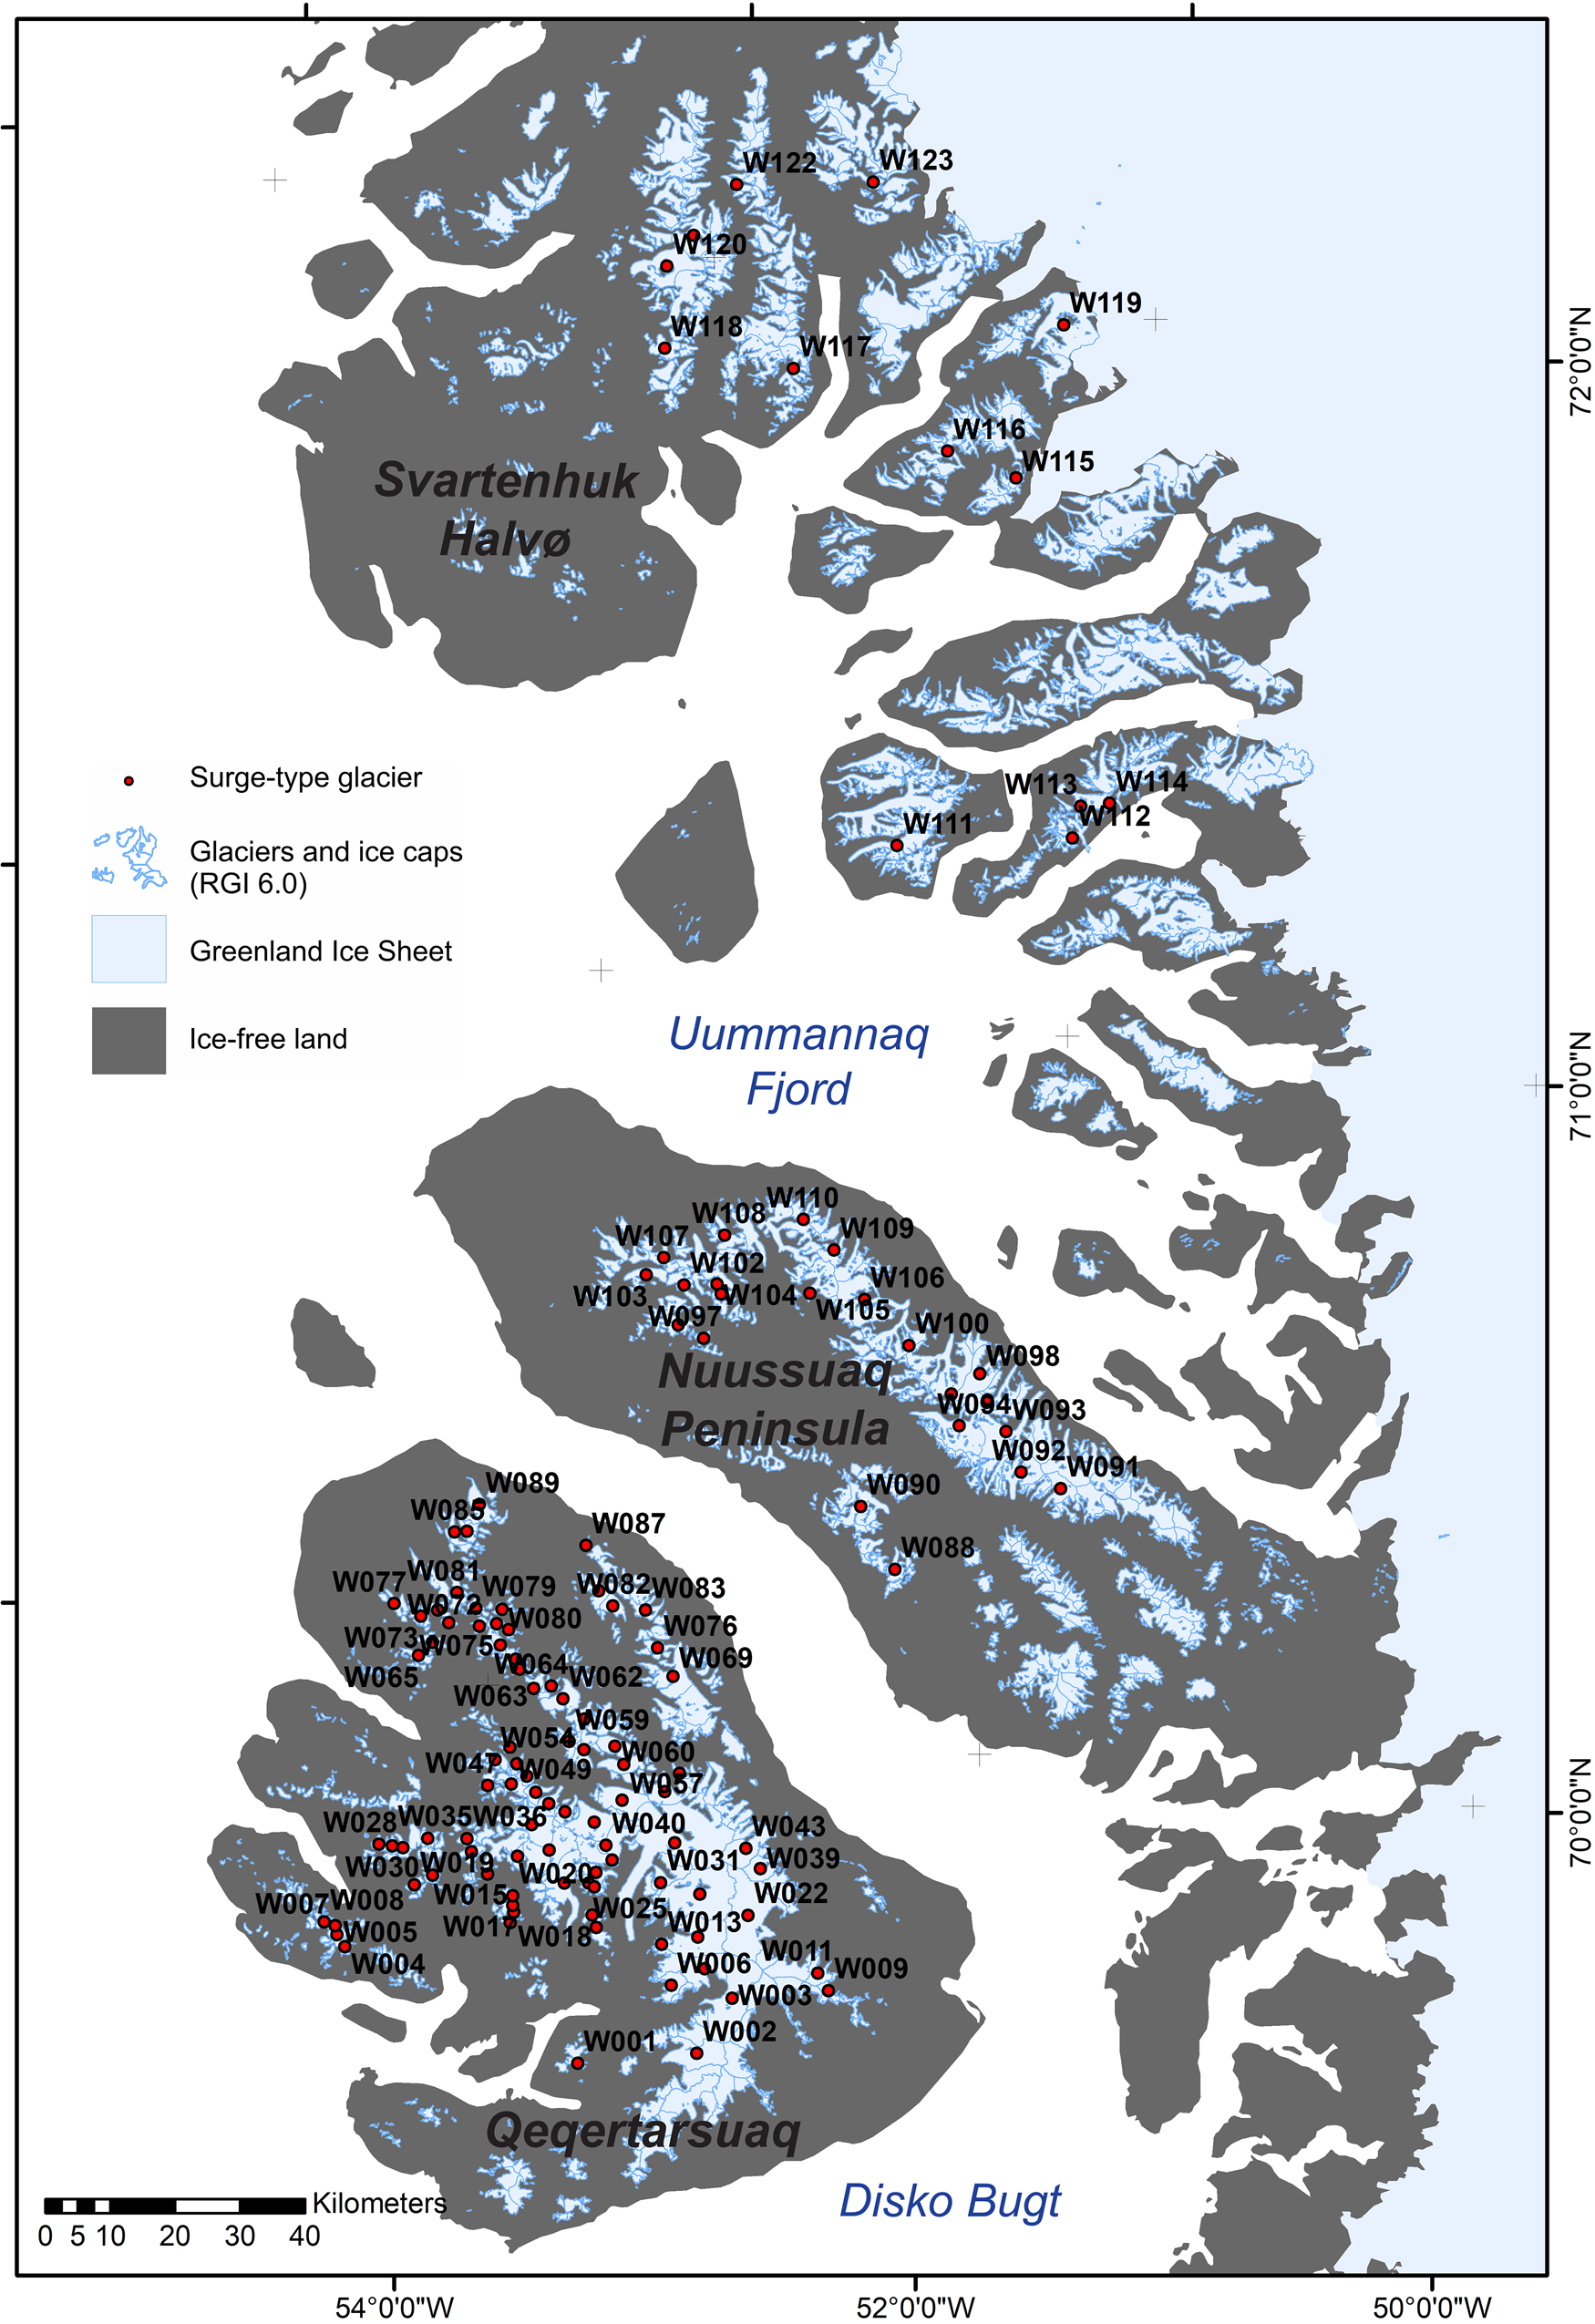
Surge-type glaciers are predominantly found within the west cluster (Yde and Knudsen, Reference Yde and Knudsen2007) and the east cluster (Jiskoot and others, Reference Jiskoot, Murray and Luckman2003), with a small number also located in the southern and northern sectors of the Greenland Ice Sheet (Sevestre and Benn, Reference Sevestre and Benn2015; Hill and others, Reference Hill, Carr and Stokes2017) (Fig. 1). Surges have been observed in glaciers and ice caps at the periphery of the Greenland Ice Sheet and large outlet glaciers of the Greenland Ice Sheet itself.
Distribution of surge-type glaciers in Greenland. The symbol for each glacier indicates the references that reported them as a surge-type glacier. See Supplementary Material for the full surge-type glacier inventory.

Previous studies identified 89 surge-type glaciers in the west cluster, which extends from 69° N to 71° N and is centred on Qeqertarsuaq (also formerly known as Disko Island) and the Nuussuaq Peninsula (Weidick and others, Reference Weidick, Bøggild and Knudsen1992; Gilbert and others, Reference Gilbert, Nielsen, Möller, Desloges and Rasch2002; Yde and Knudsen, Reference Yde and Knudsen2007; Citterio and others, Reference Citterio, Paul, Ahlstrøm, Jepsen and Weidick2009; Huber and others, Reference Huber, McNabb and Zemp2020) (Fig. 1). All surge-type glaciers in the west cluster were land-terminating and most were identified on the basis of glaciological (e.g. looped medial moraines, pitted glacier surfaces) or geomorphological (e.g. large moraine complexes) evidence of past surging (Weidick and others, Reference Weidick, Bøggild and Knudsen1992; Yde and Knudsen, Reference Yde and Knudsen2007). The east cluster covers 68° N to 72° N and the Blosseville Kyst, Geikie Plateau and Scoresby Land/Stauning Alper regions (Friese-Greene and Pert, Reference Friese-Greene and Pert1965; Henriksen and Watt, Reference Henriksen and Watt1968; Smart, Reference Smart1968; Olesen and Reeh, Reference Olesen and Reeh1969; Rutishauser, Reference Rutishauser1971; Colvill, Reference Colvill and Miller1984; Weidick, Reference Weidick1988, Reference Weidick1995; Woodward and others, Reference Woodward, Carver, Kunzendorf and Bennike2002; Jiskoot and others, Reference Jiskoot, Murray and Luckman2003; Walsh and others, Reference Walsh, Howat, Ahn and Enderlin2012) (Fig. 1). The Jiskoot and others (Reference Jiskoot, Murray and Luckman2003) inventory identified 71 glaciers that have been observed to surge or display glaciological evidence for past surge behaviour in the form of looped medial moraines and other diagnostic morphological evidence. Outside of the two main clusters, 18 surge-type glaciers have been reported in the north, south and southwest sectors of the Greenland Ice Sheet (e.g. Koch and Wegener, Reference Koch and Wegener1930; Mock, Reference Mock1966; Weidick, Reference Weidick1988; Higgins, Reference Higgins1991; Weidick and others, Reference Weidick, Bøggild and Knudsen1992; Joughin and others, Reference Joughin, Tulaczyk, Fahnestock and Kwok1996; Rignot and others, Reference Rignot, Gogineni, Joughin and Krabill2001; Palmer and others, Reference Palmer, Shepherd, Sundal, Rinne and Nienow2010; Murray and others, Reference Murray2015; Hill and others, Reference Hill, Carr and Stokes2017; Mouginot and others, Reference Mouginot, Bjørk, Millan, Scheuchl and Rignot2018; Solgaard and others, Reference Solgaard2020; Leclercq and others, Reference Leclercq, Kääb and Altena2021; Möller and others, Reference Möller, Friedl, Palmer and Marzeion2022) (Fig. 1). The majority are large marine-terminating outlet glaciers, including eight surge-type glaciers draining from the northern sector of the Greenland Ice Sheet between 76° N and 81° N (Hill and others, Reference Hill, Carr and Stokes2017).
The few studies that have recorded surge characteristics in Greenland indicate significant diversity in the style of surging, with comparisons drawn to the traditional (but restrictive: see Benn and others, Reference Benn, Hewitt and Luckman2023) definitions of both ‘Alaskan-style’ (e.g. Kamb and others, Reference Kamb1985) and ‘Svalbard-style’ (e.g. Murray and others, Reference Murray, Strozzi, Luckman, Jiskoot and Christakos2003) surges. Information on Greenland surge characteristics (e.g. active phase duration, size of terminus advance, active phase flow velocities, surge cycle length) exists for Kuannersuit Glacier in the west cluster (e.g. Yde and Knudsen, Reference Yde and Knudsen2005; Yde and others, Reference Yde2019), Sortebræ and Sermeq Peqippoq in the east cluster (Jiskoot and others, Reference Jiskoot, Pedersen and Murray2001; Pritchard and others, Reference Pritchard, Murray, Luckman, Strozzi and Barr2005; Jiskoot and Juhlin, Reference Jiskoot and Juhlin2009), and Hagen Bræ, L. Bistrup Bræ and Storstrømmen in northern Greenland (Reeh and others, Reference Reeh, Bøggild and Oerter1994, Reference Reeh, Mohr, Madsen, Oerter and Gundestrup2003; Mouginot and others, Reference Mouginot, Bjørk, Millan, Scheuchl and Rignot2018; Solgaard and others, Reference Solgaard2020). Based on observations at these glaciers, surge active phase lengths vary from ~3 years (e.g. Jiskoot and others, Reference Jiskoot, Pedersen and Murray2001; Yde and Knudsen, Reference Yde and Knudsen2005) to up to 10 years (e.g. Rutishauser, Reference Rutishauser1971; Colvill, Reference Colvill and Miller1984; Weidick, Reference Weidick1988; Jiskoot and Juhlin, Reference Jiskoot and Juhlin2009; Mouginot and others, Reference Mouginot, Bjørk, Millan, Scheuchl and Rignot2018; Solgaard and others, Reference Solgaard2020). Recorded surge terminus advances ranged from ~3 km (e.g. Jiskoot and Juhlin, Reference Jiskoot and Juhlin2009; Solgaard and others, Reference Solgaard2020) to over 10 km (Reeh and others, Reference Reeh, Bøggild and Oerter1994; Jiskoot and others, Reference Jiskoot, Pedersen and Murray2001; Yde and Knudsen, Reference Yde and Knudsen2005). Measured maximum ice velocities/surge propagation rates during the active phase ranged from <10 m d−1 (e.g. Jiskoot and Juhlin, Reference Jiskoot and Juhlin2009; Mouginot and others, Reference Mouginot, Bjørk, Millan, Scheuchl and Rignot2018; Solgaard and others, Reference Solgaard2020) to 24 m d−1 (Pritchard and others, Reference Pritchard, Murray, Luckman, Strozzi and Barr2005). Calculated or estimated surge cycle lengths include 20–30 years at Hagen Bræ (Solgaard and others, Reference Solgaard2020), 30–50 years at L. Bistrup Bræ (Mouginot and others, Reference Mouginot, Bjørk, Millan, Scheuchl and Rignot2018), 40–50 years at Sortebræ (Jiskoot and others, Reference Jiskoot, Pedersen and Murray2001) and 70 years at Storstrømmen (Reeh and others, Reference Reeh, Bøggild and Oerter1994). These few examples of surge characteristics indicate both (1) rapid onset of the surge active phase (Pritchard and others, Reference Pritchard, Murray, Luckman, Strozzi and Barr2005; Solgaard and others, Reference Solgaard2020), short surge duration and high ice velocities (Jiskoot and others, Reference Jiskoot, Pedersen and Murray2001; Pritchard and others, Reference Pritchard, Murray, Luckman, Strozzi and Barr2005), reminiscent of the traditional definition of ‘Alaskan-style’ surges (e.g. Kamb and others, Reference Kamb1985); and (2) years-long acceleration and deceleration phases, long overall surge duration and lower ice velocities (Jiskoot and Juhlin, Reference Jiskoot and Juhlin2009; Solgaard and others, Reference Solgaard2020; Möller and others, Reference Möller, Friedl, Palmer and Marzeion2022), commonly associated with ‘Svalbard-style’ surges (e.g. Murray and others, Reference Murray, Strozzi, Luckman, Jiskoot and Christakos2003; Sund and others, Reference Sund, Lauknes and Eiken2014). This demonstrates a wide diversity in Greenland surge behaviour that is consistent with the broad spectrum of glacier surging observed across the other main surge clusters (Benn and others, Reference Benn, Hewitt and Luckman2023).
Datasets and methods
Identification of surge-type glaciers
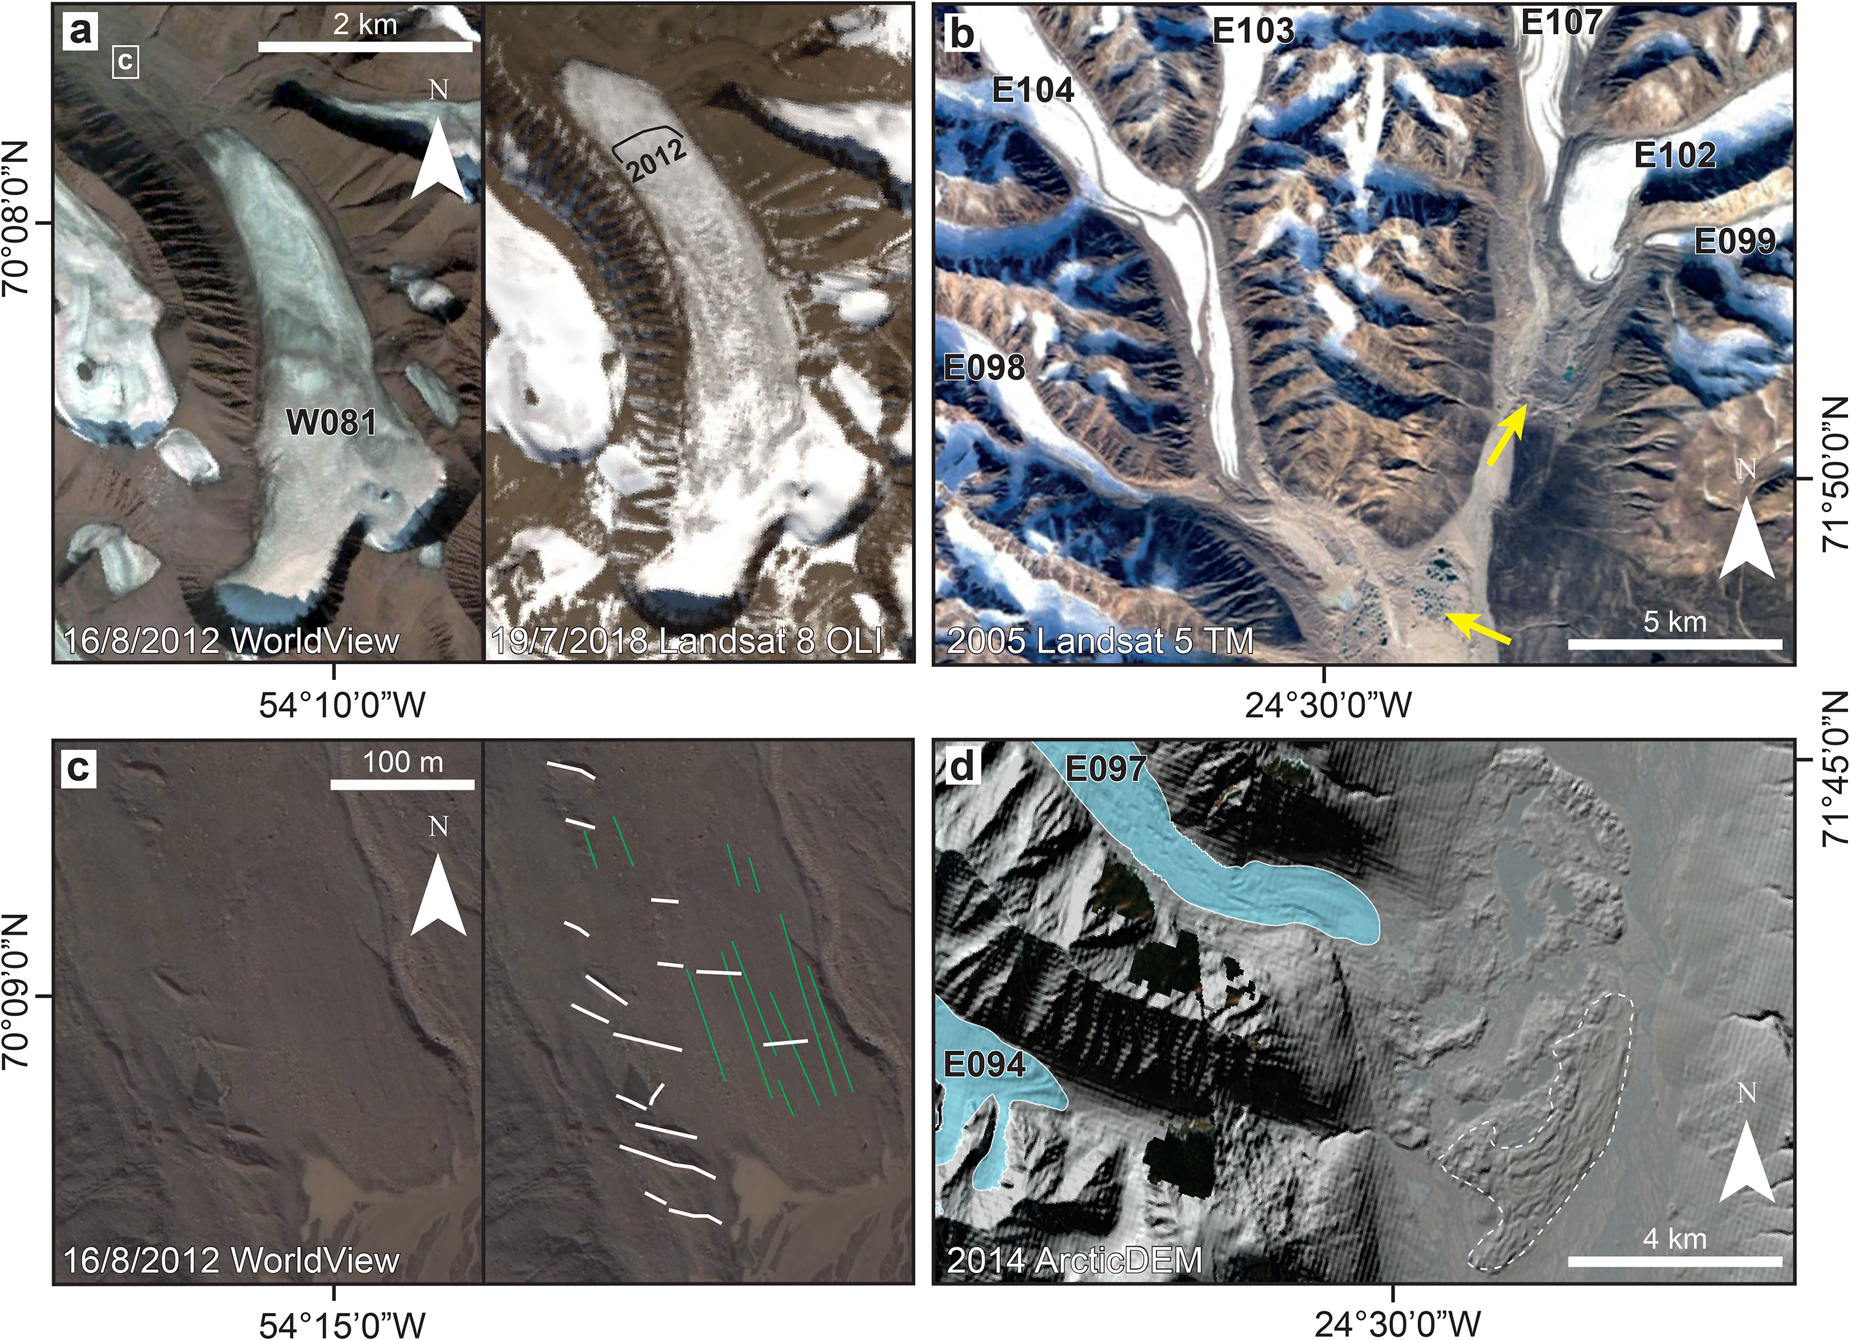
We identified surge-type glaciers in three ways: (1) from details provided in previously published inventories and studies; (2) by visually reviewing optical satellite imagery (Landsat 5 TM, 7 ETM+ and 8 OLI; WorldView via Google Earth; Planet; Esri ArcGIS Pro imagery basemap) for evidence of the surge active phase and glaciological and geomorphological surge features (e.g. Copland and others, Reference Copland, Sharp and Dowdeswell2003; Grant and others, Reference Grant, Stokes and Evans2009) (Fig. 2); and (3) by using multitemporal difference DEMs (dDEMs) to identify ice surface elevation gains that are substantial and spatially consistent with surge-related mass redistribution (e.g. Lovell and others, Reference Lovell, Carr and Stokes2018; King and others, Reference King, Bhattacharya and Bolch2021; Guillet and others, Reference Guillet2022) (Fig. 3). An adapted version of the established three-class surge index (Table 1) was used to categorise glaciers. Surge-type glaciers were given a surge index of 3: observed surge-type glacier (direct evidence of surging, such as an observed surge active phase), 2: probable surge-type glacier (indirect evidence diagnostic of surging, such as looped medial moraines and crevasse-squeeze ridges) or 1: possible surge-type glacier (indirect evidence consistent with surging, such as a pitted glacier surface). All evidence of surging was corroborated by multiple analysts.
Examples of glaciological and geomorphological evidence used to identify surge-type glaciers. See Supplementary Material, Table S1 for a full list of the surge-type glacier IDs labelled here and more details on each glacier. (a) Terminus advance of glacier W081 (our inventory ID; 1HE11013 in Weidick and others, Reference Weidick, Bøggild and Knudsen1992) during its 2013 to 2018 surge. Left shows the pre-surge WorldView image accessed via Google Earth (16 August 2012) and right shows the surge maximum Landsat 8 OLI image (19 July 2018) with the August 2012 frontal position overlain (black line). (b) Looped and deformed medial moraines on the surface of E104 (Storgletsjer), E107 (Schuchert Gletsjer) and E102 (Sirius Gletsjer). Also shown are surge-type glaciers E098 (Gannochy Gletsjer), E099 (Aldebaran Gletsjer) and E103 (unnamed). Yellow arrows identify prominent proglacial moraine complexes associated with the surge-type glaciers. (c) Crevasse-squeeze ridges (white lines in right panel) and flutes (green lines in right panel) on the foreland of W081 (1HE11013 in Weidick and others, Reference Weidick, Bøggild and Knudsen1992). (d) Glaciotectonic moraine complex (within dashed white line) in front of E097 (Roslin Gletsjer). Also shown is the surge-type glacier E094 (unnamed).
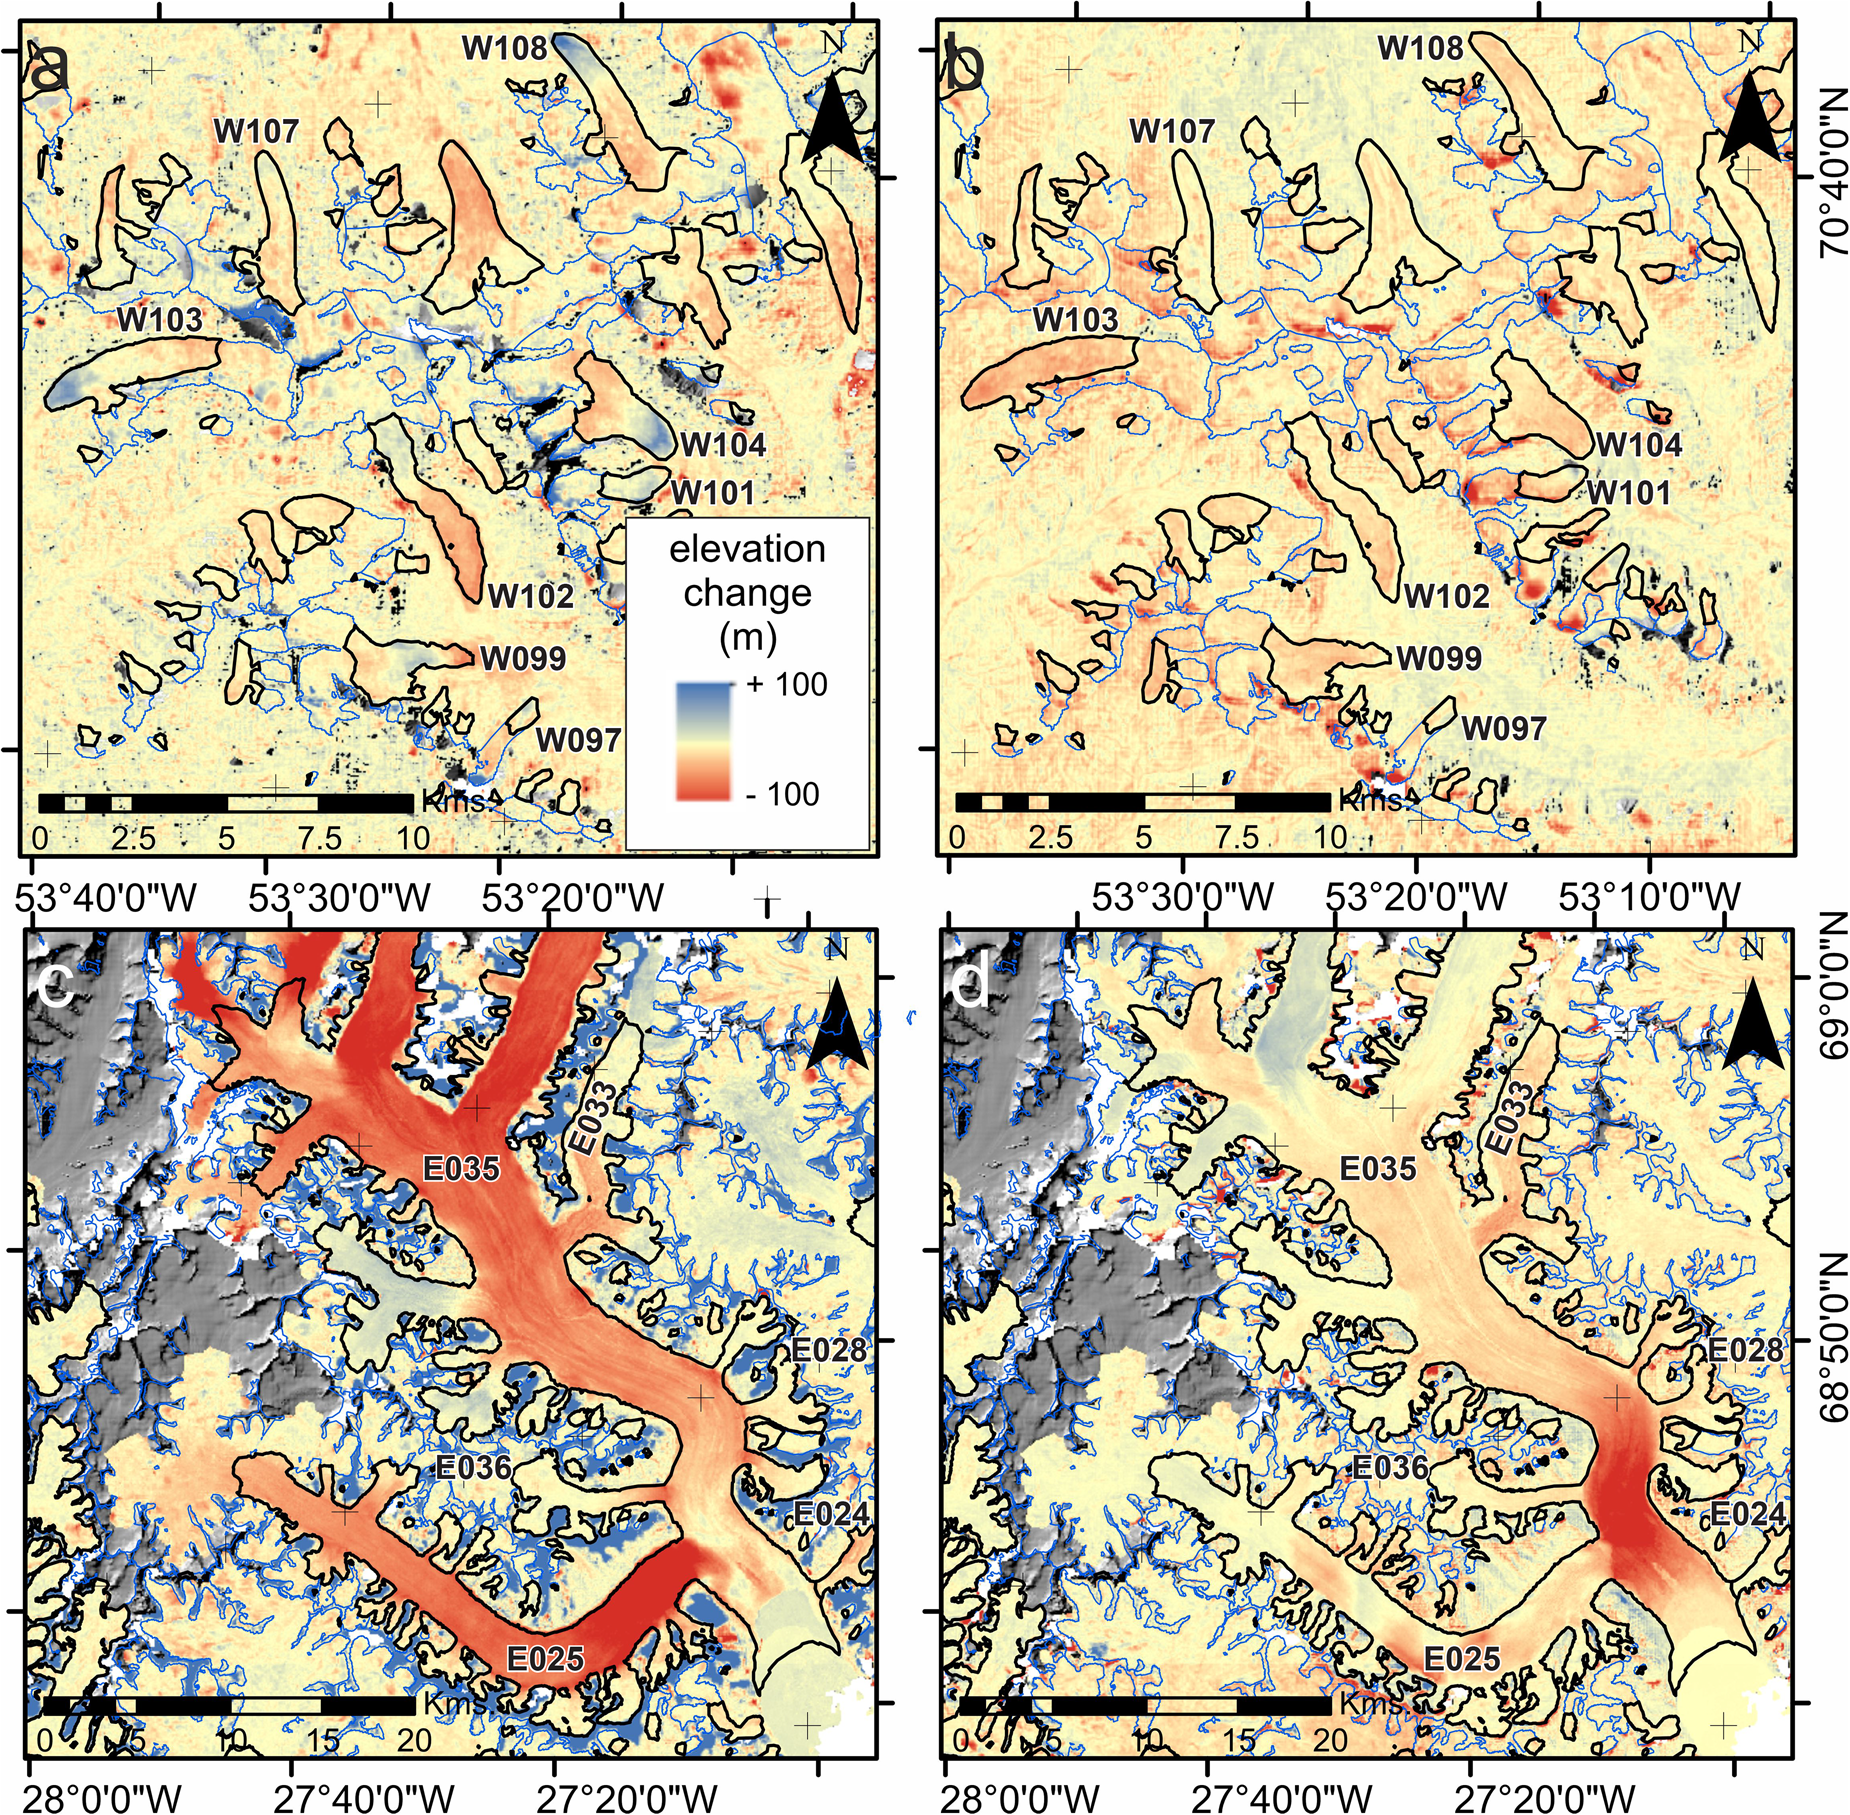
Examples of surges detected using difference DEMs. Surge-type glaciers in our inventory are labelled. (a) Elevation changes of glaciers in western Nuussuaq Peninsula, west cluster, in time one (T1; AeroDEM-GrIMP) and (b) time two (T2; GrIMP-ArcticDEM). (c) Elevation changes within tributary glaciers of Sortebræ, east cluster, in T1 (AeroDEM-GrIMP) and (d) T2 (GrIMP-ArcticDEM). Blue lines are Randolph Glacier Inventory (RGI) 6.0 glacier outlines (RGI Consortium, 2017). Black lines are ablation area outlines. See Supplementary Material, Table S1 for more information on the surge-type glaciers labelled here. Legend in (a) also applies to (b) to (d).
Surge index used to categorise surge-type glaciers in the inventory.
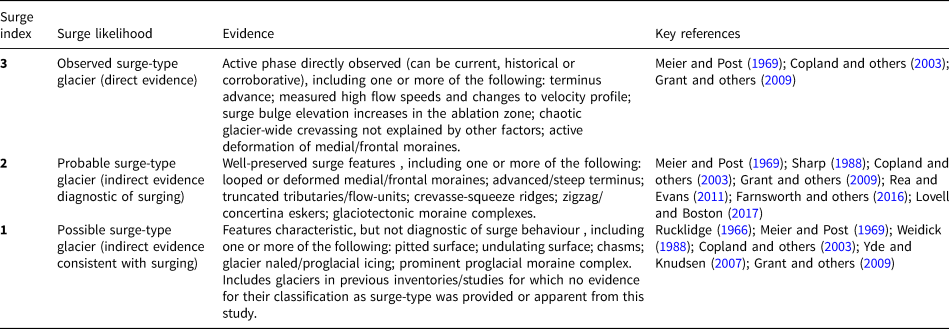
Adapted from established surge classifications (e.g. Clarke and others, Reference Clarke, Schmok, Ommanney and Collins1986; Hamilton and Dowdeswell, Reference Hamilton and Dowdeswell1996; Jiskoot and others, Reference Jiskoot, Murray and Boyle2000, Reference Jiskoot, Murray and Luckman2003; Copland and others, Reference Copland, Sharp and Dowdeswell2003; Sevestre and Benn, Reference Sevestre and Benn2015).
Previous surge-type glacier inventories and studies
We established the locations of surge-type glaciers included in previous regional and global inventories (e.g. Weidick, Reference Weidick1988; Weidick and others, Reference Weidick, Bøggild and Knudsen1992; Jiskoot and others, Reference Jiskoot, Murray and Luckman2003; Yde and Knudsen, Reference Yde and Knudsen2007; Sevestre and Benn, Reference Sevestre and Benn2015; Hill and others, Reference Hill, Carr and Stokes2017; Leclercq and others, Reference Leclercq, Kääb and Altena2021; Kääb and others, Reference Kääb, Bazilova, Leclercq, Mannerfelt and Strozzi2023) and site-specific studies (e.g. Henriksen and Watt, Reference Henriksen and Watt1968; Rutishauser, Reference Rutishauser1971; Weidick, Reference Weidick1984; Jiskoot and others, Reference Jiskoot, Pedersen and Murray2001; Murray and others, Reference Murray, Strozzi, Luckman, Pritchard and Jiskoot2002; Pritchard and others, Reference Pritchard, Murray, Luckman, Strozzi and Barr2005; Jiskoot and Juhlin, Reference Jiskoot and Juhlin2009; Mouginot and others, Reference Mouginot, Bjørk, Millan, Scheuchl and Rignot2018; Solgaard and others, Reference Solgaard2020; Möller and others, Reference Möller, Friedl, Palmer and Marzeion2022). The reported evidence for surge behaviour was assessed and cross-referenced with our own review of satellite imagery and dDEMs and a surge index was assigned (Table 1).
Satellite images
Investigation was primarily focused on the west and east surge clusters (Fig. 1). We visually compared multitemporal Landsat images captured in the 1990s (west Greenland: 1993, 1998, 2000; east Greenland: 1994, 1997, 1998) with recent images (west Greenland: 2017, 2018; east Greenland: 2017, 2018, 2019). Unequivocal surge-related changes (e.g. terminus advance, active deformation of medial moraines) that occurred during this 20–25-year period were recorded, in addition to evidence for past glacier behaviour (e.g. looped medial moraines). Beyond the two main surge clusters, we also reviewed glaciers and ice caps at the periphery of the Greenland Ice Sheet and major outlet glaciers using recent WorldView (accessed via Google Earth), Planet and Landsat 5 TM, 7 ETM+ and 8 OLI (accessed via Google Earth and Esri ArcGIS Pro basemap) imagery.
Digital elevation models (DEMs)
Multitemporal dDEMs covering two time periods were generated for the west and east surge clusters using three DEM datasets: AeroDEM (dated to 1985 in west Greenland, 1987 in east Greenland), Greenland Ice Mapping Project (GrIMP, based on merged datasets acquired from 2000–2009) and ArcticDEM (2015/2016). AeroDEM (https://www.ncei.noaa.gov/archive/archive-management-system/OAS/bin/prd/jquery/accession/download/145405) is a 25 m horizontal resolution digital elevation model derived from aerial photographs (Korsgaard and others, Reference Korsgaard2016). GrIMP V1 (https://nsidc.org/data/nsidc-0645/versions/1) is a 30 m horizontal resolution DEM generated by the integration and enhancement of existing DEM datasets (Howat and others, Reference Howat, Negrete and Smith2014). ArcticDEM (https://www.pgc.umn.edu/data/arcticdem/) is a 2 m horizontal resolution DEM derived using the Surface Extraction with TIN-based Search-space Minimization (SETSM) algorithm applied to WorldView satellite images (Noh and Howat, Reference Noh and Howat2015; Porter and others, Reference Porter2018). In this work we have used the merged ArcticDEM elevation dataset and take it as a representation of glacier surface topography around 2015, which is the most predominant acquisition date of individual DEM strips. We also used the Hugonnet and others (Reference Hugonnet2021) ASTER dDEM time series (2000 to 2009 and 2009 to 2019), which have a 100 m horizontal resolution, to extend our time series towards the present day and provide maximum coverage.
As our study areas cover ~ 185 000 km2, DEMs were resampled to a 35 m grid size to streamline processing. The different DEMs were generated from imagery acquired by different sensors and mismatches in their geolocation were evident and required correction. The methods of Nuth and Kääb (Reference Nuth and Kääb2011) were followed to co-register stable (off-glacier) areas and resolve DEM misalignment. Each DEM was split into 5 × 3 km subsets for this process to allow for the better correction of spatially variable aspect and elevation related biases.
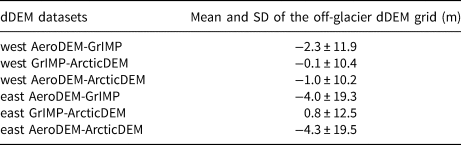
Once co-registered, DEMs were subtracted from one another to derive surface elevation change estimates for the two study areas. We discarded dDEM data above an elevation of 1550 m in the west cluster study area as blunders in DEMs (owing to poor surface contrast in imagery) were prevalent above this elevation. We followed the same approach above an elevation of 1700 m for the east cluster study area. Given most of the glaciers in the study areas sit below these two elevations, this approach did not result in substantial loss of coverage. We also removed estimates of elevation change outside of the range ± 150 m under the assumption that these values represented anomalies, rather than real surface elevation change. While some large surges of peripheral Greenland glaciers have resulted in elevation changes greater than this ± 150 m range (e.g. Huber and others, Reference Huber, McNabb and Zemp2020), a sufficient portion of each glacier's surge-related elevation gain (thickening) signal was still preserved to allow identification. To establish a suitable level of detection, outside of which we examined the characteristics of elevation changes over glacier surfaces, we firstly examined elevation changes over stable ground surfaces. We generated a mask of stable ground by removing glacier areas (provided by Randolph Glacier Inventory (RGI) 6.0) and glacial lake surfaces in the DEM, and the coastline. We removed elevation differences over stable ground outside of the range ± 100 m under the assumption that these data were the result of DEM errors. The standard deviation of remaining stable ground pixels (n = 17–53 million depending on study site and time period) was used as a guide of the remaining variance in elevation data (Table 2), outside of which were robust changes in glacier surface elevation.
Characteristics of off-glacier surface elevation change estimates following DEM and dDEM post-processing.
Surge-type glacier identification using the dDEM datasets focused on the assessment of surface thickening in glacier ablation areas (Fig. 3). We chose to focus primarily on elevation gain in ablation areas because (1) thickening in the lower reaches of a glacier in a region experiencing long-term glacier mass loss, and in established surge clusters, is evidence of the surge active phase (e.g. Citterio and others, Reference Citterio, Paul, Ahlstrøm, Jepsen and Weidick2009; Bolch and others, Reference Bolch2013; Gardner and others, Reference Gardner2013; Carrivick and others, Reference Carrivick, Tweed, James and Jóhannesson2017, Reference Carrivick2019; Huber and others, Reference Huber, McNabb and Zemp2020); and (2) attributing elevation changes in glacier accumulation areas to surges can be very problematic due to DEM artefacts caused by snow cover in the source satellite or aerial images. Glacier ablation areas were determined by DEM hypsometric analysis using a modification of the Pellitero and others (Reference Pellitero2015) tool to output a glacier-specific ablation area (as a polygon) (Fig. 3). We specified an area-altitude balance ratio (AABR) of 2.2 for the ablation area analysis following that determined for Arctic glaciers by Rea (Reference Rea2009). In a test on a subset of glaciers, we determined the sensitivity of the ablation zone to the AABR value, finding that a value of 2.3 or 2.1 only altered the ablation area by <5%. We consider the AABR approach to be the best option for providing simple and standardised glacier ablation areas compared to alternative methods that use climate and mass balance conditions. It is possible that ablation areas derived using our approach may be under- or overestimated in cases where the glacier geometry (as defined by RGI 6.0) captures the glacier size at either the start or end of a particular surge cycle. However, given we are only using ablation areas as a simple way to ensure we do not consider elevation changes in the upper parts of glaciers where DEM errors may be larger, we do not think this decision has a major impact on our overall analysis.
Our approach to identifying surge active phases means it is possible we may have failed to identify some surge-type glaciers using dDEMs, in particular (1) glaciers in the quiescent phase of the surge cycle, characterised by substantial thickening in the accumulation area (e.g. Melvold and Hagen, Reference Melvold and Hagen1998; Guillet and others, Reference Guillet2022); and (2) marine-terminating glacier surges, where increased mass flux to the ablation area has been compensated by increased frontal ablation, and therefore the elevation gain signature may be muted. However, it is important to note that dDEM signatures are only part of the evidence for surging that we considered in our analysis. For example, marine-terminating glacier behaviour in east Greenland has been extensively studied since the 1980s (e.g. Jiskoot and others, Reference Jiskoot, Juhlin, St Pierre and Citterio2012; Walsh and others, Reference Walsh, Howat, Ahn and Enderlin2012; Brough and others, Reference Brough, Carr, Ross and Lea2023), providing a detailed alternative source of information on potential surging in the region.
Inventory compilation
The locations of surge-type glaciers in the inventory are represented as glacier outlines (from RGI 6.0) and points (based on Global Land Ice Measurement from Space (GLIMS) points and typically located at the centre point of RGI outlines). In cases where independent surge activity has been identified in a tributary or flow-unit within glaciers captured as a single outline in RGI 6.0, we have manually edited the glacier outlines. All glaciers in the inventory have been assigned a unique inventory ID, an RGI ID and a GLIMS ID (Supplementary Materials, Table S1), with the exception of some large ice sheet outlet glaciers (n = 20) that do not have an RGI outline (and therefore could not be assigned an RGI ID). Our unique inventory ID contains the cluster name (e.g. ‘W’ for west) followed by three digits organised by increasing latitude within each cluster (e.g. ‘W001’ is the southernmost surge-type glacier in the west cluster). Where RGI outlines have been edited into separate tributaries/flow-units, the original RGI ID is used with the addition of ‘part of’. In cases where GLIMS IDs were absent or could not be identified (e.g. for some large ice sheet outlet glaciers or edited RGI outlines), we have added new GLIMS IDs at appropriate locations following the naming conventions stipulated by RGI Consortium (2017) and adopted by others (e.g. Jiskoot and others, Reference Jiskoot, Juhlin, St Pierre and Citterio2012). Glacier names are taken from the Bjørk and others (Reference Bjørk, Kruse and Michaelsen2015) database and from previous inventories and studies. Where surge activity is identified within tributaries/flow-units of a larger named trunk glacier, the main glacier name is used followed by an appropriate locational identifier (e.g. ‘Glacier name W tributary’ for tributaries or ‘Glacier name W’ for major flow-units). Glacier type and terminus type have been manually assessed using GLIMS glacier classification terms (Rau and others, Reference Rau, Mauz, Vogt, Khalsa and Raup2005), with the addition of a subdivision of outlet glaciers into ice sheet (IS) and ice cap/field (IC/F). Glacier areas are derived from the RGI glacier outlines (original and edited) or published sources where there are no RGI outlines (e.g. Weidick and others, Reference Weidick, Bøggild and Knudsen1992; Palmer and others, Reference Palmer, Shepherd, Sundal, Rinne and Nienow2010; Hill and others, Reference Hill, Carr and Stokes2017; Krieger and others, Reference Krieger, Floricioiu and Neckel2020). The reported evidence for surging and the source of this information is provided for each glacier in the inventory (see Supplementary Materials, Table S1 and GIS files). Here, our surge index (Table 1) is reported alongside the RGI surging status (1 = possible, 2 = probable 3 = observed, 9 = not assigned), which is based on data used in Sevestre and Benn (Reference Sevestre and Benn2015).
Assessment of spatio-temporal patterns of surging
Information on surge timing fits two categories: (1) well-constrained dates for a surge active phase, either from the literature or observed on satellite images (e.g. dates of terminus advance phases; Fig. 2a); and (2) broadly constrained evidence of a surge active phase, e.g. identification of ablation area elevation gains in dDEM datasets (Fig. 3) or terminus advance between two image acquisitions (but without exact years of the start and end of the surge active phase). Hereafter we summarise these together as surge activity for ease of reporting, which we define as evidence that a glacier is undergoing/has undergone a surge active phase during the period of observation (since ~1985). Surge-type glaciers were then organised into two generalised time periods of approximately the same length based on the dDEM datasets: T1, encompassing the AeroDEM-GrIMP time period (~1985 to 2000; ~15 years); and T2, encompassing the GrIMP-ArcticDEM and ASTER time periods (~2000 to 2019; ~19 years). These time periods are deliberately crude for the purposes of data simplification; for example, we acknowledge that using 2000 for the end/start point of the GrIMP dataset ignores that this is a composite dataset spanning several years (likely 2000 to 2009; Howat and others, Reference Howat, Negrete and Smith2014). Where surge activity occurs in or spans both periods, the glacier has been counted in each. These generalised time periods allow us to explore spatio-temporal patterns of surging at the scale of the entire surge-type glacier population.
Climate analysis using ERA5-land reanalysis data
To better understand the link between climate and the distribution of surge-type glaciers, we generalised the climate over Greenland and compared our surge inventory to the surface variables from the ERA5-Land dataset generated using a regional climate model (Muñoz-Sabater, Reference Muñoz-Sabater2019) and forced with reanalysis data (Hersbach and others, Reference Hersbach2020). The reanalysis product is obtained by combining model data with observations to generate a globally consistent set of meteorological variables that is gap free in space and time. We generated climate variables covering the whole period of study (1981–2020) and for the time periods approximately corresponding to T1 (1981–2000) and T2 (2001–2020) used in the assessment of spatio-temporal patterns of surging. Monthly averaged 2 m air temperature and total precipitation were extracted from ERA5-Land data at 0.1° × 0.1° horizontal grid resolution and processed to compute decadal averages, and for decadal summer and decadal winter means where those seasons were defined for Greenland following Berdahl and others (Reference Berdahl2018) using June–August (JJA) and December–February (DJF), respectively. We specifically considered mean summer air temperature (Ts) and mean winter precipitation (Pw) in our analyses since these two meteorological variables are important drivers of glacier mass balance (e.g. Mernild and others, Reference Mernild2011). Our climate analyses show positive trends in mean annual air temperature (Ta) and a minor increase in mean annual precipitation (Pa) over the 40-year time period across Greenland, which is consistent with other previous assessments of long-term climate records showing widespread warming and stochastic precipitation patterns (Mernild and others, Reference Mernild, Hanna, Yde, Cappelen and Malmros2014, Reference Mernild2015; Wong and others, Reference Wong2015; Westergaard-Nielsen and others, Reference Westergaard-Nielsen, Karami, Hansen, Westermann and Elberling2018; Finger Higgens and others, Reference Finger Higgens2019; Lewis and others, Reference Lewis2019). In our data, Pa increased by approximately 29.62 mm a−1 between T1 and T2 at a rate of 7.4 mm per decade (for context, Pa ranges from ~200 to ~2500 mm a−1 in the period 1981–2020). Ta increased by approximately 2.4°C between T1 and T2 at a rate of 0.6°C per decade. These trends are consistent with Wong and others (Reference Wong2015), who state that mean annual temperatures have increased 1.5°C since weather observations in northwest Greenland began in 1952, with a greater increase of 2.7°C from 1981–2012. This pattern was found to be consistent across the whole of Greenland. Statistical analysis of the climate data was performed using Mann–Whitney U tests applied to the west and east clusters at the 95% confidence level.
Results
Greenland surge-type glacier inventory
Our inventory contains 274 surge-type glaciers (Figs 1, 4 and 5, Table 3 and Supplementary Materials, Table S1). This equates to ~1.2% of all glaciers in Greenland, of which there are >22 000 glaciers and ice caps at the periphery of the Greenland Ice Sheet in RGI 6.0 (Rastner and others, Reference Rastner2012; RGI Consortium, 2017) and >200 major marine-terminating outlet glaciers of the Greenland Ice Sheet (Moon and others, Reference Moon, Joughin, Smith and Howat2012). We have added 74 (+37%) surge-type glaciers not reported in previous inventories or studies: 37 in the west cluster, 36 in the east cluster and 1 in southern Greenland (Table 3 and Supplementary Materials, Table S1). Of the 74 newly identified surge-type glaciers, 52 have a surge index of 3 (observed surge-type glacier) and 22 have a surge index of 2 (probable surge-type glacier).
West Greenland surge cluster. See Figure 1 for cluster locations and full surge-type glacier distribution. More information on the surge-type glaciers labelled here can be found in the Supplementary Materials, Table S1.
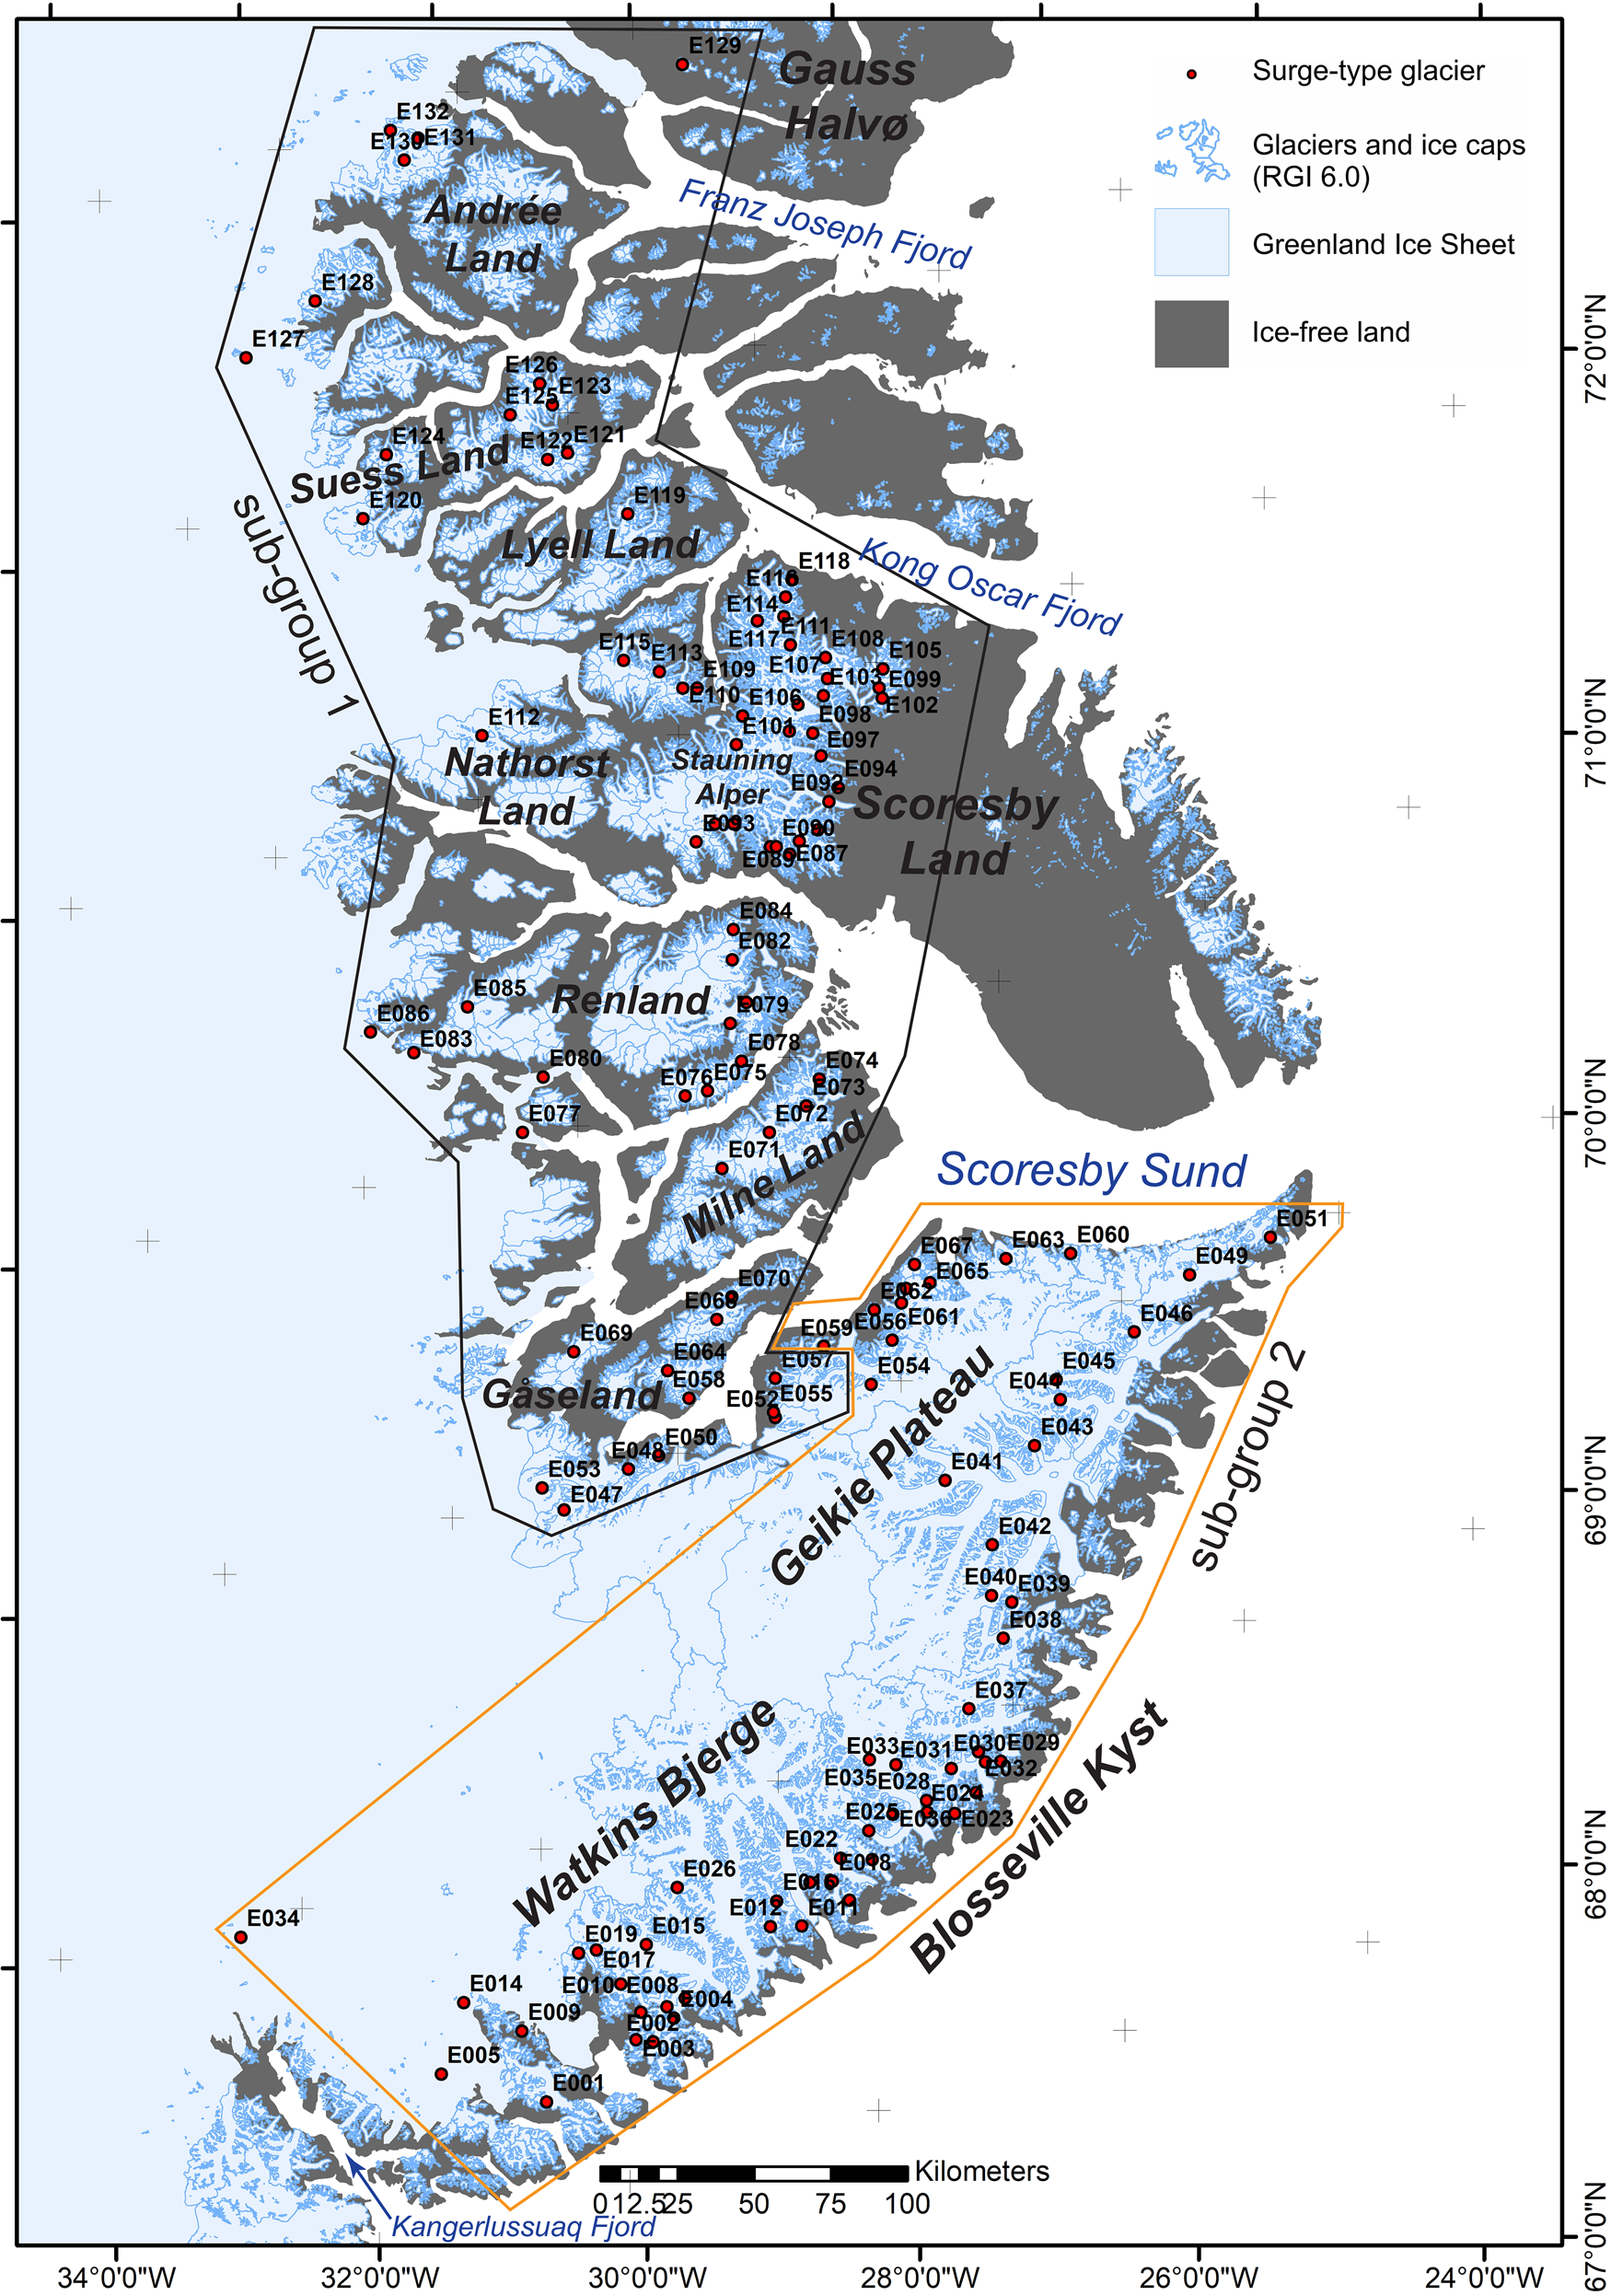
East Greenland surge cluster. See text for reference to east cluster sub-group 1 (black outline) and sub-group 2 (orange outline). See Figure 1 for cluster locations and full surge-type glacier distribution. More information on the surge-type glaciers labelled here can be found in the Supplementary Materials, Table S1.
Summary of all Greenland surge-type glaciers in our inventory (surge index of 1, 2 and 3)

Most of the surge-type glaciers are in the west cluster (n = 123; 45% of the inventory) (Fig. 4) and the east cluster (n = 132; 48% of the inventory) (Fig. 5). Surge-type glaciers are predominantly valley glaciers or outlet glaciers from ice caps or icefields (n = 229; 84%), with very few mountain glaciers identified as being of surge-type (n = 12; 4%). The surge-type glaciers we have identified mainly terminate on land (n = 220; 80%), including all surge-type glaciers in the west cluster and 71% of surge-type glaciers in the east cluster (Table 3). We identify two geographical sub-groups within the east cluster (Fig. 5): sub-group 1 surge-type glaciers are mostly located to the north of Scoresby Sund (e.g. Henriksen and Watt, Reference Henriksen and Watt1968; Rutishauser, Reference Rutishauser1971; Woodward and others, Reference Woodward, Carver, Kunzendorf and Bennike2002) and sub-group 2 surge-type glaciers are found in the Blosseville Kyst/Geikie Plateau region (e.g. Jiskoot and others, Reference Jiskoot, Pedersen and Murray2001, Reference Jiskoot, Murray and Luckman2003). The majority of the surge-type glaciers in the east cluster sub-group 1 terminate on land (n = 66; 88% of surge-type glaciers in the sub-group). By contrast, most (n = 29; 83%) of the marine-terminating surge-type glaciers in the east cluster are found in sub-group 2. Of the 19 surge-type glaciers in southern and northern Greenland, which comprise 7% of the total inventory, 13 are marine-terminating outlet glaciers of the Greenland Ice Sheet (Fig. 1; Table 3). In northern Greenland, over a third (n = 8) of the 21 major marine-terminating Greenland Ice Sheet outlet glaciers in the region are surge-type glaciers (Hill and others, Reference Hill, Carr and Stokes2017). Overall, 130 (47.4% of the inventory) surge-type glaciers have a surge index of 3, 105 (38.3% of the inventory) have a surge index of 2 and 39 (14.2% of the inventory) have a surge index of 1 (Tables 1 and 3).
Newly identified surge-type glaciers show that the west cluster extends northwards onto Svartenhuk Halvø at 72° N (Fig. 4) and the east cluster extends up to Franz Joseph Fjord and Gauss Halvø at 73° N (Fig. 5). A larger proportion of the total number of glaciers in the west cluster are surge-type glaciers (5.2%) than in the east cluster (1.9%). The east cluster also contains 17 ice sheet outlet glaciers and 35 marine-terminating glaciers (13 and 27% of all surge-type glaciers in the east cluster, respectively), largely on the Blosseville Kyst (Fig. 5). Surges typically impact a large portion of an individual glacier's area in the west cluster (e.g. Figs 3a and b), where most glaciers have simple configurations characterised by single trunks fed by at most two to three basins. By comparison, in the larger, often multi-branched glaciers in the east cluster, independent surges can occur in several different tributaries or flow-units of the same glacier system (e.g. Figs 3c and d). In these cases, we have identified each surging tributary/flow-unit as a separate surge-type glacier in our inventory to reflect independent surge behaviour. For example, Sortebræ is a large multi-branched surge-type glacier system within which we identify six independent surge-type tributaries or flow-units (E024, E025, E028, E033, E035, E036) (Fig. 5 and Supplementary Materials, Table S1). Similarly, we identify four independent flow-units within Dendritgletsjer (E040, E041, E042, E043) (Fig. 5 and Supplementary Materials, Table S1). In the few examples like these, we calculate that we have identified 12 additional surge-type glaciers that are recognised as being part of other surge-type glacier systems as mapped by Jiskoot and others (Reference Jiskoot, Murray and Luckman2003) – one-third of the additional surge-type glaciers we have identified in the east cluster (+36) compared to previous work.
Geometric attributes
Compared to the nonsurge-type glaciers (hereafter ‘other’) in the west and east clusters, surge-type glaciers have larger median areas (west: surge-type glaciers = 7.8 km2, other = 0.4 km2; east: surge-type glaciers = 51.8 km2, other = 0.5 km2) and greater median lengths (west: surge-type glaciers = 5556 m, other = 774 km; east: surge-type glaciers = 15 418 m, other = 965 km) (Figs 6a and b). Surge-type glaciers also have larger median elevation ranges (west: surge-type glaciers = 861 m, other = 327 m; east: surge-type glaciers = 1700 m, other = 398 m) than other glaciers (Fig. 6c). Surge-type glaciers generally have shallower slopes than other glaciers in both clusters (west medians: surge-type glaciers = 15.6°, other = 19.6°; east medians: surge-type glaciers = 14.4°, other = 20.6°) (Fig. 6d). Using the same geometric data to compare between the two clusters, surge-type glaciers in the east cluster have larger areas, are longer, and have larger elevation ranges than surge-type glaciers in the west cluster (Fig. 6). We find that this is not simply a function of regional differences in glacier size: While there are certainly many more large, multi-branched glaciers in the east compared to the west, there are also many more glaciers overall (west = 2382 glaciers, east = 6863 glaciers), and many of these are very small. This makes the overall glacier size distribution in the east very similar to that in the west, with slightly larger glaciers in the east (reported here as median (interquartile range)): area = 0.4 km2 (1.6 km2) in the west; 0.5 km2 (2.1 km2) in the east; length = 826 m (1561 m) in the west, 988 m (1879 m) in the east; elevation range = 348 m (474 m) in the west, 408 m (555 m) in the east. Surface slopes of surge-type glaciers (medians = 15.6° and 14.4° in west and east, respectively) and all glaciers (medians = 19.2° and 20.5° in west and east, respectively) are similar in both clusters.
Geometric attributes of all surge-type and nonsurge-type (other) glaciers in the west and east clusters. (a) Area. (b) Length. (c) Elevation range. (d) Slope. Common logarithm (log10) values are used for area, length and elevation range in order to compare the wide range in values. Geometric attributes are derived from RGI 6.0 (RGI Consortium, 2017), the GLIMS glacier database (Jiskoot, Reference Jiskoot2002; used for glacier areas of some large glaciers in east Greenland not found in RGI 6.0) or Brough and others, Reference Brough, Carr, Ross and Lea2023 (used for glacier areas of some large glaciers in east Greenland where no RGI 6.0 or GLIMS outlines exist). The area plot contains all surge-type glaciers in the west (n = 123) and east (n = 132) clusters. The length, elevation range and slope plots only show surge-type glaciers with RGI 6.0 outlines (west: n = 119; east: n = 99). We include all categories of surge-type glaciers (surge index of 1, 2 and 3; see Table 1) in our analysis and note that the glacier geometric attributes may not be representative of the conditions at each glacier at the time it surged.

Spatio-temporal patterns
The overall number of glaciers displaying surge activity (evidence of the surge active phase) was broadly similar in T1 (n = 77) and T2 (n = 85) (Fig. 7a). However, some disparity between T1 and T2 is apparent in the west cluster, where the number of glaciers displaying surge activity is lower in T2 (n = 25) than in T1 (n = 30). This reduction in surge activity appears particularly clear once the counts of the number of glaciers displaying surge activity are normalised by the differing lengths of the time periods (15 years for T1, 19 years for T2) (Fig. 7b). To explore whether this reduction could be biased by our approach of using the uneven time periods defined by our dDEM datasets, we also adjusted the lengths of the time periods (and the count of surge activity accordingly) to an even 17 years (e.g. 1985–2002 and 2002–2019). This returns a similar reduction in the number of glaciers surging in T2 compared to T1 in the west cluster.
Temporal analysis of surge activity for glaciers with a surge index of 3 (observed surge-type glacier). We define surge activity here as evidence that a glacier experienced a surge active phase during the period of observation. Where surge-type glacier activity spans T1 (AeroDEM to GrIMP, ~1985–2000) and T2 (GrIMP to ArcticDEM, plus ASTER, ~2000–2019) the glacier has been counted in both (e.g. a glacier with surge activity observed in both 1999 and 2001 is counted in both T1 and T2). (a) Count of surge activity in T1 and T2 organised by cluster/region. (b) Surge activity in west and east clusters normalised by duration of T1 (15 years) and T2 (19 years). (c) Latitudinal range of surge activity in T1 and T2 for west and east clusters. (d) Count of surge activity in T1 and T2 organised by glacier type.

The latitudinal range of surge activity in T1 and T2 was fairly similar, with a slightly smaller latitudinal range in T2 in the west cluster and surge activity extending slightly further north in T2 in the east cluster (Fig. 7c). Across all surge-type glaciers, from T1 to T2 the number of ice sheet outlet glaciers (+7) and ice cap/icefield outlet glaciers (+7) showing surge activity increased, while the number of valley glaciers (−8) showing surge activity decreased (Fig. 7c).
Climatic distribution
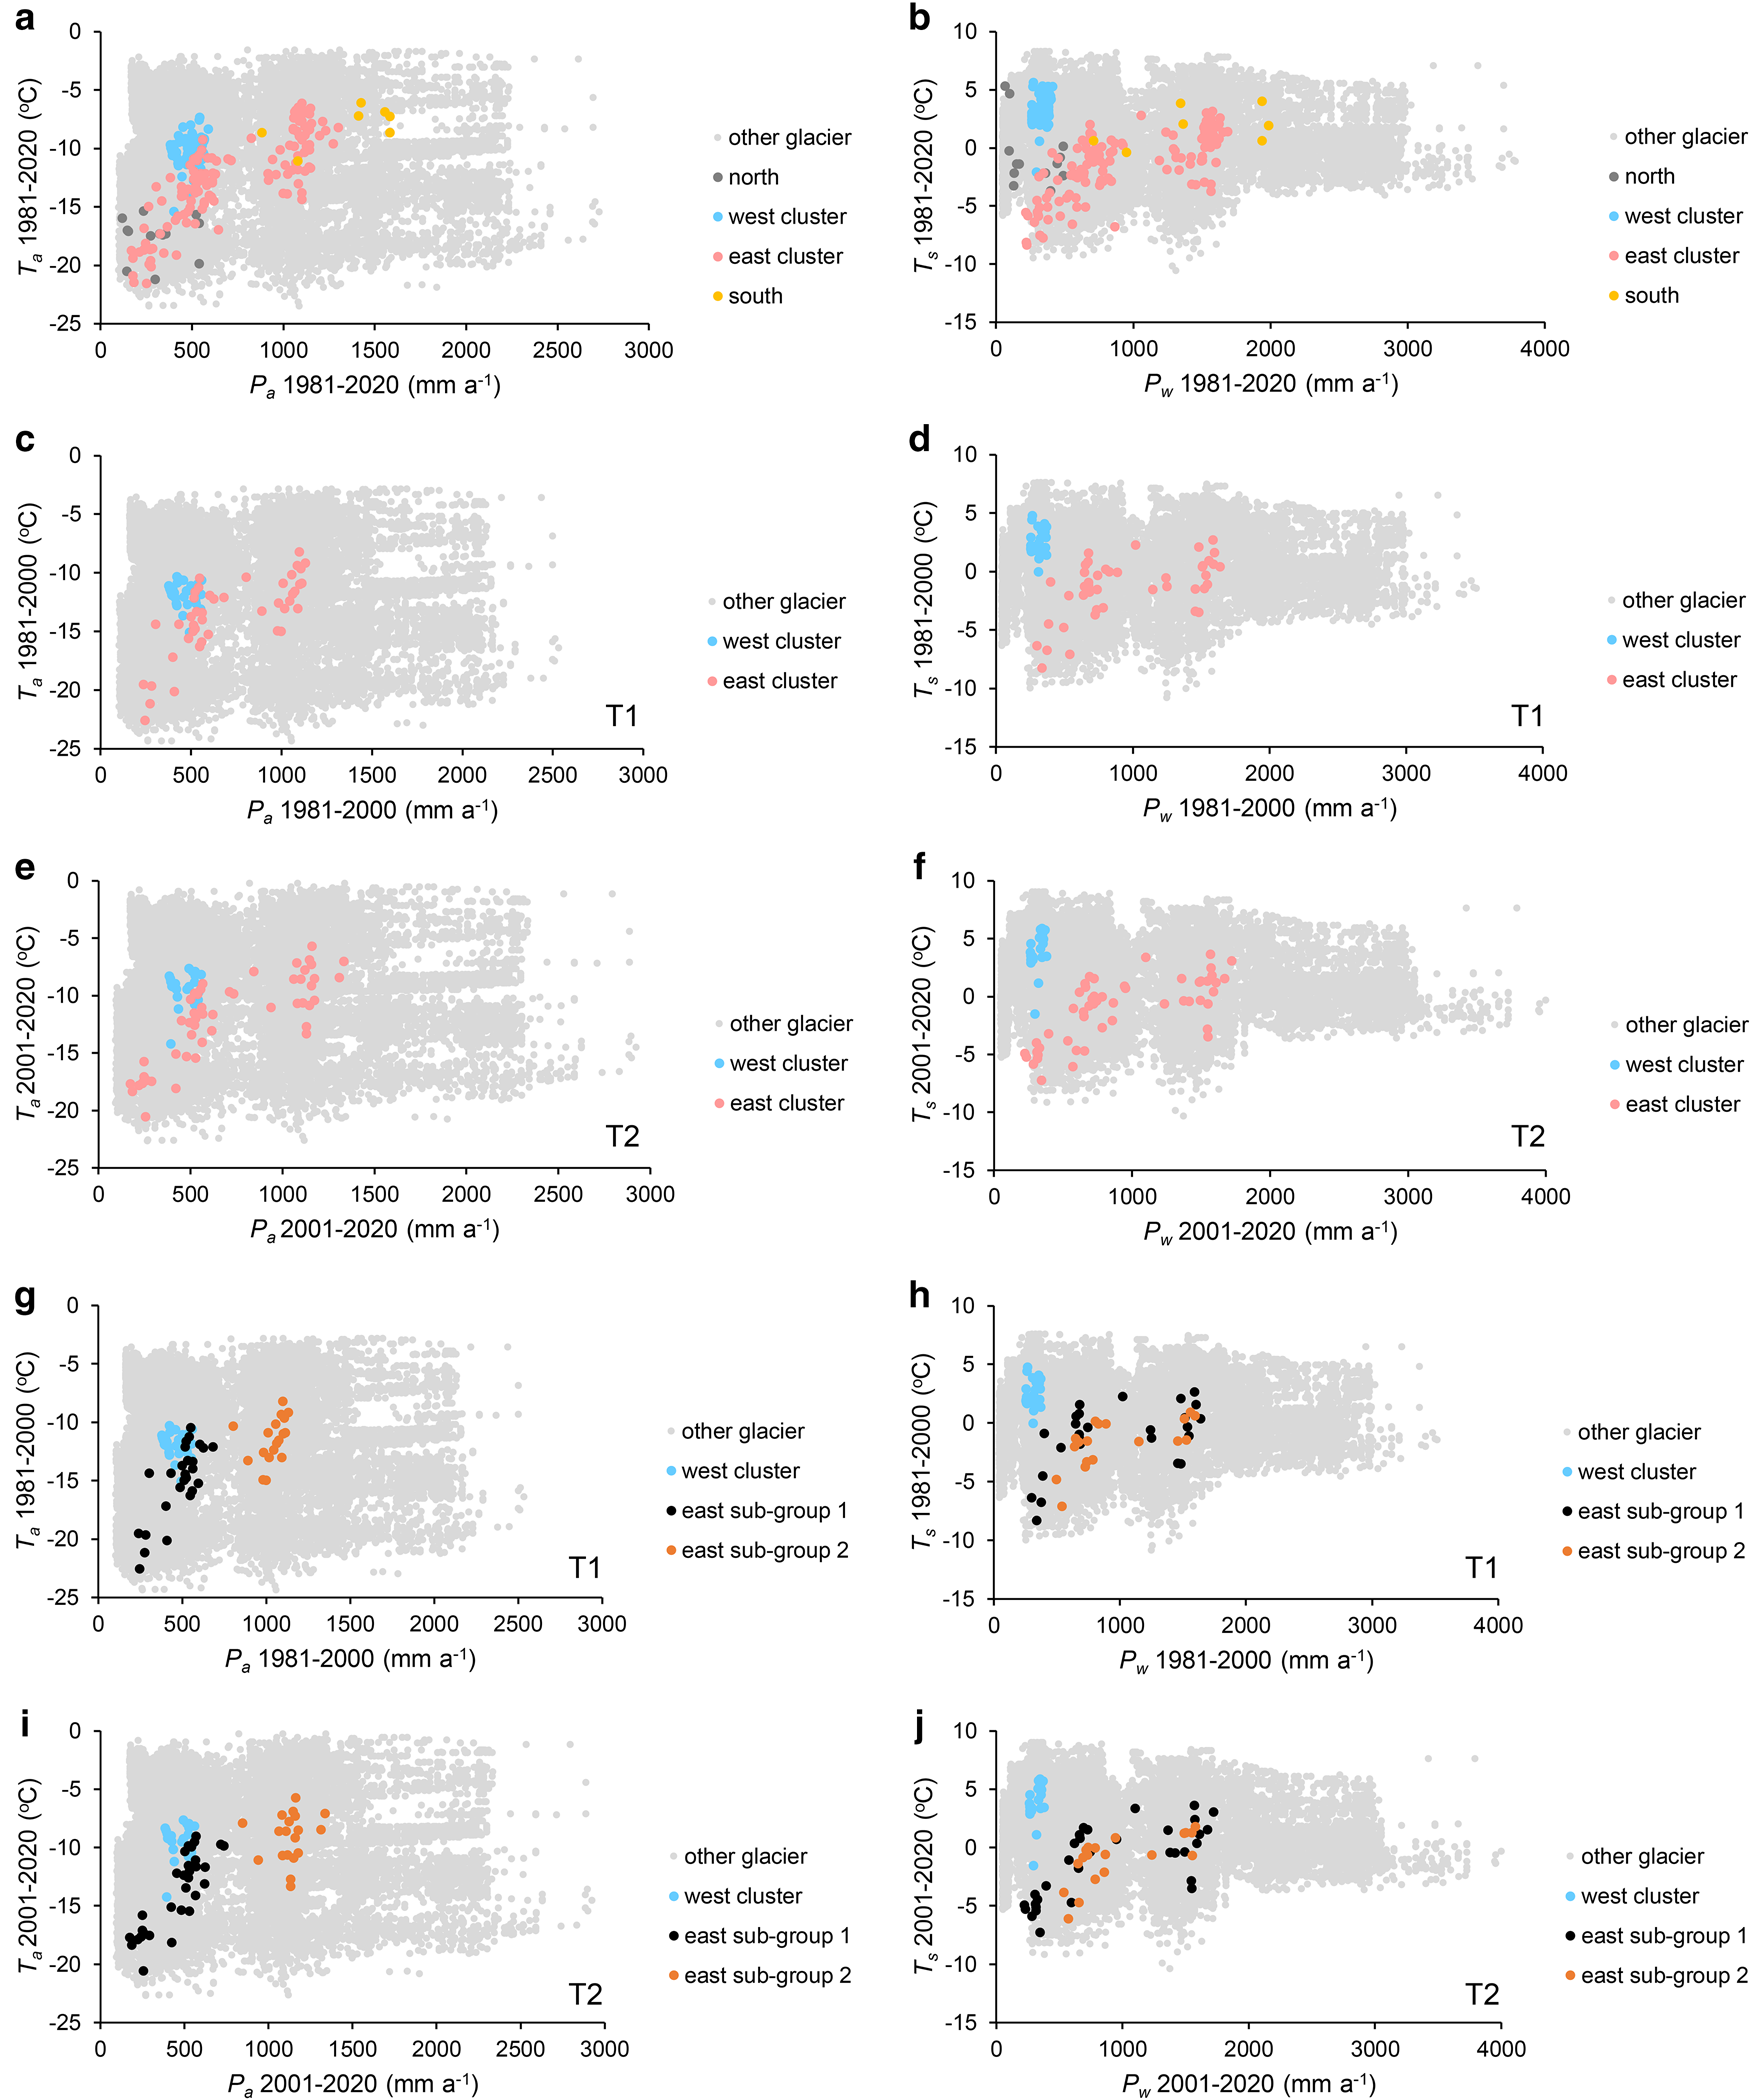
Most surge-type glaciers in Greenland are found within a climatic envelope defined by Ta of −5 to −20°C and Pa of ~200–1200 mm (Fig. 8a). The only surge-type glaciers found where the climate is warmer and wetter are in the south (n = 5). No surge-type glaciers are found where Ta is >−5°C and Pa is >~1700 mm (Fig. 8a). The geographical groupings of surge-type glaciers in Greenland can be resolved into climatic envelopes (Figs 8a and b). The west and east cluster form well-defined climatic envelopes (Figs 8a–f) that are distinct from each other at a statistically significant level for all climate variables (Table 4). West cluster surge-type glaciers are found in a narrow Pa and Pw range ~400–500 mm and between −13 and −6°C Ta and 0 and 5°C Ts (Figs 8a and b). The east cluster surge-type glaciers cover a larger range in climate conditions than the west cluster and the identified geographical sub-groups (Fig. 5) are distinct from each other at a statistically significant level for all climate variables in the period 1981–2020 (Figs 8a and b), and for Pa and Ta (Figs 8g and i) but not Pw and Ts (Figs 8h and j) when the data are broken down into T1 and T2 (Table 4). An examination of the climate data by time periods also reveals that between T1 and T2 the west cluster surge-type glaciers experienced statistically significant warming of ~1°C for both Ta and Ts (Table 4). Statistically significant Ta warming between T1 and T2 is also found in the east cluster. No statistically significant changes in precipitation (Pa or Pw) between T1 and T2 are found in either cluster (Table 4).
Climatic distribution of surge-type glaciers and nonsurge-type (other) glaciers. Table 4 presents statistical analysis that compares the west and east cluster climate distributions plotted here. (a) Mean annual air temperature (Ta) against mean annual precipitation (Pa), 1981–2020 for all surge-type glaciers in our inventory (surge index of 1, 2 and 3). (b) Mean summer (JJA) air temperature (Ts) against mean winter (DJF) precipitation (Pw), 1981–2020 for all surge-type glaciers in our inventory (surge index of 1, 2 and 3). (c) Ta against Pa, 1981–2000 (T1) for all glaciers with a surge index of 3 in T1 in the west and east clusters. (d) Ts against Pw, 1981–2000 (T1) for all glaciers with a surge index of 3 in T1 in the west and east clusters. (e) Ta against Pa, 2001–2020 (T2) for all glaciers with a surge index of 3 in T2 in the west and east clusters. (f) Ts against Pw, 2001–2020 (T2) for all glaciers with a surge index of 3 in T2 in the west and east clusters. (g) Ta against Pa, 1981–2000 (T1) for all glaciers with a surge index of 3 in T1 in the west cluster and east cluster sub-groups 1 and 2. (h) Ts against Pw, 1981–2000 (T1) for all glaciers with a surge index of 3 in T1 in the west cluster and east cluster sub-groups 1 and 2. (i) Ta against Pa, 2001–2020 (T2) for all glaciers with a surge index of 3 in T2 in the west cluster and east cluster sub-groups 1 and 2. (j) Ts against Pw, 2001–2020 (T2) for all glaciers with a surge index of 3 in T2 in the west cluster and east cluster sub-groups 1 and 2. Temperature and precipitation data are from the monthly averaged ERA5-Land reanalysis dataset (Muñoz-Sabater, Reference Muñoz-Sabater2019). See text for references to east sub-groups 1 and 2 and Figure 5 for their geographical coverage. See Table 1 for surge index definition.
Statistical analysis (Mann–Whitney U tests) comparing the climatic distribution of surge-type glaciers in the west and east clusters.
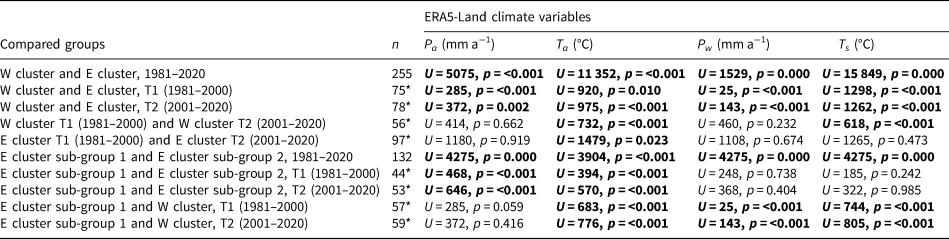
Values in bold indicate there is a statistically significant difference (p < 0.05) in climate conditions between groups. U = Mann–Whitney U test statistic; Pa = mean annual precipitation; Ta = mean annual air temperature; Pw = mean winter precipitation; Ts = mean summer air temperature. n = all surge-type glaciers, n* = surge-type glaciers with a surge index of 3 (observed surge-type glacier). See Table 1 for surge index definition and Figure 8 for plots of the climatic distribution.
Discussion
Distribution and characteristics of Greenland surge-type glaciers
Surge-type glaciers represent ~1.2% of all glaciers in Greenland, which is similar to estimates for the global population of surge-type glaciers (~1%; Jiskoot and others, Reference Jiskoot, Murray and Boyle2000; Sevestre and Benn, Reference Sevestre and Benn2015). At individual cluster level, surge-type glaciers comprise 5.2% of all glaciers in the west cluster and 1.9% of all glaciers in the east cluster. These proportions are comparable to similar calculations (surge-type glaciers reported as a percentage of all glaciers) from other regional clusters, including the Canadian Arctic Archipelago (0.7%) (Copland and others, Reference Copland, Sharp and Dowdeswell2003); the Karakoram (1.9%), western Pamir (1.9%) and eastern Pamir (2.9%) (Guillet and others, Reference Guillet2022); the Russian High Arctic (4.6%) (Grant and others, Reference Grant, Stokes and Evans2009); and Iceland (4.7%) (Björnsson and others, Reference Björnsson, Pálsson, Sigurđsson and Flowers2003). All the above are markedly lower than estimates of the proportion of surge-type glaciers in the Svalbard cluster (e.g. Jiskoot and others, Reference Jiskoot, Murray and Boyle2000; Bouchayer and others, Reference Bouchayer, Aiken, Thøgersen, Renard and Schuler2022), where as high as 32.6% of all glaciers are suggested to be of surge-type (Farnsworth and others, Reference Farnsworth, Ingólfsson, Retelle and Schomacker2016; Lovell and Boston, Reference Lovell and Boston2017).
Our inventory shows that the west and east surge clusters cover a larger geographical area than investigated in prior work. The west cluster was previously shown to be focused on Qeqertarsuaq and the Nuussuaq Peninsula (Weidick and others, Reference Weidick, Bøggild and Knudsen1992; Yde and Knudsen, Reference Yde and Knudsen2007; Huber and others, Reference Huber, McNabb and Zemp2020), but for the first time we have also identified surge-type glaciers on Svartenhuk Halvø at up to 72° N (Fig. 4). We also record more surge-type glaciers on the Nuussuaq Peninsula (n = 22; +17) than previously identified. The two main locations where surge-type glaciers are found in the east cluster are the Blosseville Kyst/Geikie Plateau area (e.g. Weidick, Reference Weidick1988; Jiskoot and others, Reference Jiskoot, Murray and Luckman2003) and the Scoresby Land/Stauning Alper area (Henriksen and Watt, Reference Henriksen and Watt1968; Rutishauser, Reference Rutishauser1971; Woodward and others, Reference Woodward, Carver, Kunzendorf and Bennike2002; Jiskoot and others, Reference Jiskoot, Murray and Luckman2003) (Fig. 5). These two geographical areas form statistically significant sub-groups within the cluster based on Pa and Ta variables (Figs 8g and i; Table 4). The east cluster also extends further north (up to 73° N) than investigated in previous inventories (Weidick, Reference Weidick1988; Jiskoot and others, Reference Jiskoot, Murray and Luckman2003).
A major difference between the west and east clusters is the size and configuration of surge-type glaciers. Surges in the west cluster tend to impact a large proportion of individual glaciers, with the downglacier propagation of the surge front resulting in the redistribution of significant volumes of ice to the glacier terminus (e.g. Fig. 3a). This expansion of the ablation area exposes a large percentage of the glacier's volume to post-surge melting, as observed at Kuannersuit Glacier, where it was estimated that 80–90% of the glacier's area was in the ablation area immediately following surge termination in 1998 (Yde and Knudsen, Reference Yde and Knudsen2007). By contrast, surges of tributaries and flow-units within large multi-branched glaciers in the east cluster do not always propagate the full length of the glacier system (e.g. Figs 3c and d) or into adjacent flow-units. Similar individual surge behaviour within complex glacier systems has been observed in Svalbard (e.g. Benn and others, Reference Benn, Kristensen and Gulley2009; Lovell and Fleming, Reference Lovell and Fleming2022).
Beyond the west and east clusters, the large marine-terminating surge-type glaciers in the north are likely to be of particular interest in the future. Surges affect 38% of the 21 major outlet glaciers and drain 36% of the northern sector of the Greenland Ice Sheet (Hill and others, Reference Hill, Carr and Stokes2017). While there is presently low ice discharge from this region (Mankoff and others, Reference Mankoff2019; Mouginot and others, Reference Mouginot2019), the surging behaviour of marine-terminating outlets across the Arctic region indicates the potential for rapid collapse (e.g. Jiskoot and others, Reference Jiskoot, Juhlin, St Pierre and Citterio2012; McMillan and others, Reference McMillan2014; Willis and others, Reference Willis2018; Nuth and others, Reference Nuth2019; Solgaard and others, Reference Solgaard2020). In addition, increased iceberg production during marine-terminating glacier surges (e.g. Jiskoot and others, Reference Jiskoot, Pedersen and Murray2001; Truffer and others, Reference Truffer, Haeberli, Whiteman and Shroder2021) presents a potential hazard for shipping (e.g. Bigg and others, Reference Bigg, Wadley, Stevens and Johnson1996) offshore of the east cluster and in north and south Greenland (where all the marine-terminating surge-type glaciers are found), but not in the west cluster, where the surge-type glaciers all terminate on land.
Controls on surging
The enthalpy cycle model for surging asserts that climate exerts a first-order global control on the distribution of surge-type glaciers, and glacier geometry exerts a regional second-order control (Sevestre and Benn, Reference Sevestre and Benn2015; Benn and others, Reference Benn, Fowler, Hewitt and Sevestre2019a). These suggestions hold true for Greenland, with the additional insight that climate variables can also be used to differentiate statistically significant geographical sub-groups of surge-type glaciers within regional groupings (i.e. separate groups and clusters within Greenland) and within clusters (i.e. sub-groups 1 and 2 within the east cluster) (Fig. 8; Table 4). The climate thresholds for surging in Greenland can be broadly defined as −20 to −5°C Ta and 100 to 1250 mm Pa (Fig. 8a). Compared to the Sevestre and Benn (Reference Sevestre and Benn2015) climatic envelopes, the identified climate thresholds suggest most Greenland surge-type glaciers would plot in the overlap between their ‘Arctic Ring’ and Canadian High Arctic clusters. Our Ts ranges for Greenland (Fig. 8b) are towards the cooler end of the ‘Arctic Ring’ envelope as shown in Sevestre and Benn (Reference Sevestre and Benn2015), which probably reflects our inclusion of additional surge-type glaciers in northern Greenland and the northern parts of the west and east clusters that were not in the Sevestre and Benn (Reference Sevestre and Benn2015) dataset. In particular, the cooler, drier climate of the northern surge-type glaciers, west cluster and east cluster sub-group 1 (glaciers mostly located to the north of Scoresby Sund; Fig. 5) shares similarities with the Canadian High Arctic climatic envelope, whereas the warmer, wetter east cluster sub-group 2 (Blosseville Kyst/Geikie Plateau glaciers; Fig. 5) and southern surge-type glaciers fit better within the Sevestre and Benn (Reference Sevestre and Benn2015) ‘Arctic Ring’ envelope.
The geometric attributes of surge-type glaciers provide evidence for the second-order control on surging. Surge-type glaciers in both the west and east clusters are larger, longer, cover a greater elevation range and generally have shallower slopes than other glaciers (Fig. 6). These characteristics agree with similar data from the global database of surge-type glaciers (Sevestre and Benn, Reference Sevestre and Benn2015) and that reported from the surge clusters in Alaska (Clarke, Reference Clarke1991), east Greenland (Jiskoot and others, Reference Jiskoot, Murray and Luckman2003), Iceland (Björnsson and others, Reference Björnsson, Pálsson, Sigurđsson and Flowers2003), Svalbard (Jiskoot and others, Reference Jiskoot, Boyle and Murray1998), the Russian High Arctic (Grant and others, Reference Grant, Stokes and Evans2009) and High Mountain Asia (Guillet and others, Reference Guillet2022).
We have not explored the role of underlying geology in controlling surge-type glacier distribution (e.g. Post, Reference Post1969; Crompton and Flowers, Reference Crompton and Flowers2016). It has been noted in previous work that both the west and east Greenland surge-type glacier clusters are in basalt-dominated regions (Weidick, Reference Weidick1988; Weidick and others, Reference Weidick, Bøggild and Knudsen1992), although no clear relationship between bedrock lithology and surge-type glaciers was identified by Jiskoot and others (Reference Jiskoot, Murray and Luckman2003) in the east cluster. However, Jiskoot and others (Reference Jiskoot, Murray and Luckman2003) did find that glaciers overlying bedrock that was younger than Precambrian in age had increased surge potential in east Greenland. The relationship between surging and bedrock lithology appears to be particularly strong in the Svalbard cluster, where it has been established that surge-type glaciers tend to be underlain by fine-grained sedimentary lithologies (Hamilton and Dowdeswell, Reference Hamilton and Dowdeswell1996; Jiskoot and others, Reference Jiskoot, Boyle and Murray1998, Reference Jiskoot, Murray and Boyle2000).
Changing surge behaviour over time
Our temporal analysis of surge activity appears to suggest that fewer glaciers were surging in T2 compared to T1 in the west cluster, indicating that there has been a reduction in surge activity between the time periods (Fig. 7b). We suggest that this apparent reduction in surging could be controlled by glacier thinning as the climate warms in the region. Western Greenland has experienced very strong warming since the 1980s (Hanna and others, Reference Hanna, Mernild, Cappelen and Steffen2012, Reference Hanna2021; Abermann and others, Reference Abermann2017) and the glaciers in the west cluster are estimated to have experienced an annual mass change of −1.7 ± 0.6 Gt yr−1 over approximately this same period (Huber and others, Reference Huber, McNabb and Zemp2020). Our climate analysis demonstrates that surge-type glaciers in the west cluster experienced statistically significant warming of ~1°C for both Ta and Ts between T1 and T2 (Table 4). The impact of such warming on glacier mass balance can be enhanced for surge-type glaciers, which have been shown to undergo greater recession than other (nonsurge-type) glaciers in the immediate post-surge quiescent phase, typically because of the large mass redistribution to lower elevations associated with the surge active phase (Yde and Knudsen, Reference Yde and Knudsen2007; Bhattacharya and others, Reference Bhattacharya2021; Guillet and others, Reference Guillet2022). We suggest that the post-surge thinning effect is especially strong in the west cluster, where most glaciers have been receding and losing mass in recent decades (Yde and Knudsen, Reference Yde and Knudsen2007; Leclercq and others, Reference Leclercq2012; Huber and others, Reference Huber, McNabb and Zemp2020). Surge-type glaciers here are typically small valley glaciers or icefield outlet glaciers with simple configurations (i.e. single trunk glaciers). When surges occur, they impact most of the glacier, resulting in a large proportion of the overall glacier mass being transferred to the ablation area. This likely accounts for the long surge return periods in the west cluster (Yde and Knudsen, Reference Yde and Knudsen2007), as the post-surge recovery takes longer. Our data also suggests that across all surge-type glaciers in Greenland, fewer valley glaciers surged in T2 compared to outlet glaciers (Fig. 7d). This is consistent with the impact of surges, post-surge thinning and overall negative mass balance being greater on valley glaciers (generally smaller and simple configurations) than on larger multi-branched outlet glaciers.
For surge-type glaciers to continue the surge cycle following surge termination, they have to build-up sufficient mass in the accumulation area during the quiescent phase. This becomes difficult if the regional mass balance conditions are strongly negative (e.g. Małecki and others, Reference Małecki, Faucherre and Strzelecki2013). Glacier thinning can also result in a switch in glacier thermal regime from polythermal to a largely cold-based, inactive state (e.g. Sevestre and others, Reference Sevestre and Benn2015; Carrivick and others, Reference Carrivick, Smith, Sutherland and Grimes2023b). Cold air waves in winter can penetrate to the bed of thinner glaciers more easily, reducing pressure melting and the production of basal meltwater (Björnsson and others, Reference Björnsson1996; Lovell and others, Reference Lovell2015), and thus limiting basal sliding. In a region where surge-type glaciers are likely to be polythermal (e.g. Roberts and others, Reference Roberts, Yde, Knudsen, Long and Lloyd2009), a switch to a cold-based thermal regime may mean that some surge-type glaciers in the west cluster will be unable to surge under present climate conditions, as has been observed in Svalbard (Hansen, Reference Hansen2003; Małecki and others, Reference Małecki, Faucherre and Strzelecki2013; Lovell and others, Reference Lovell2015; Sevestre and others, Reference Sevestre and Benn2015; Benn and others, Reference Benn, Fowler, Hewitt and Sevestre2019a).
The suggestion that a warmer climate is struggling to support surges of the typically small, land-terminating glaciers in the west cluster is consistent with the growing body of evidence on the importance of mass balance, and thus ultimately climate, in controlling glacier surges (e.g. Dowdeswell and others, Reference Dowdeswell, Hodgkins, Nuttall, Hagen and Hamilton1995; Eisen and others, Reference Eisen, Harrison and Raymond2001; Flowers and others, Reference Flowers, Roux, Pimentel and Schoof2011; Bevington and Copland, Reference Bevington and Copland2014; Sevestre and Benn, Reference Sevestre and Benn2015; Kochtitzky and others, Reference Kochtitzky2020). If climatic envelopes conducive to surging shift away from previously optimal conditions in recognised surge clusters, we might expect some surge-type glaciers to be removed from the surge cycle entirely (e.g. Hansen, Reference Hansen2003; Małecki and others, Reference Małecki, Faucherre and Strzelecki2013).
Summary and conclusions
We present the first systematic inventory of surge-type glaciers in Greenland, compiled from previous studies and the analysis of multitemporal satellite images and difference digital elevation models (dDEMs). We identify 274 surge-type glaciers, representing an increase of 37% compared to previous work. The majority of the 74 newly identified surge-type glaciers are found in the west and east clusters, extending both clusters approximately one degree of latitude further north into areas that were unexplored in previous inventories. Surge-type glaciers are larger in the east cluster than the west cluster, despite overall glacier size distributions being similar in both regions. Surges tend to impact the whole glacier trunk in the west, whereas individual tributaries or flow-units of large multi-branched glaciers in the east can show individual surge behaviour.
Analysis of ERA5-Land climate data show that surge-type glaciers in the different geographical groups occur in well-defined and statistically significant climatic envelopes. The east cluster resolves into two sub-groups with statistically distinct climate conditions: the group of surge-type glaciers mostly located to the north of Scoresby Sund (cooler and drier) and the Blosseville Kyst/Geikie Plateau group (warmer and wetter). We provide the first analysis of spatio-temporal patterns of surging in Greenland by summarising surge activity (defined as the number of glaciers observed to be in the surge active phase) during the time periods T1 (~1985 to 2000) and T2 (~2000 to 2019). Overall surge activity was similar in both T1 and T2, but there appears to be a reduction in surge activity in the west cluster in T2. This is coincident with statistically significant warming of ~1°C in the cluster between the two time periods. Reduced surge activity in the west cluster could potentially indicate the start of a process whereby the climate is shifting away from the optimal climatic envelope for surging in the region, with the possible outcome that the west cluster will continue to experience less surging over time.
Future work on surges and climate should focus on: ongoing updates of regional and global surge-type glacier inventories, which could be achieved using emerging automated methods for detecting surge behaviour (e.g. Herreid and Truffer, Reference Herreid and Truffer2016; Leclercq and others, Reference Leclercq, Kääb and Altena2021; Kääb and others, Reference Kääb, Bazilova, Leclercq, Mannerfelt and Strozzi2023; Li and others, Reference Li2023); further exploration of spatial and temporal trends in regional surge behaviour and their relationship to climate; and a better understanding of the underlying processes that control the spectrum of glacier dynamics that encompasses surging.
Supplementary material
The supplementary material for this article can be found at https://doi.org/10.1017/jog.2023.61.
Data
GIS files of the Greenland surge-type glacier inventory are available at https://doi.org/10.17029/ca8a3d97-536a-4f09-9c86-895ed54f6918.
Acknowledgements
Paul Carter is thanked for his help formatting GIS files of previous surge-type glacier inventories. We thank two anonymous reviewers and the Scientific Editor, Hester Jiskoot, for their helpful comments for improving the work presented here.


 Open access