


1. Introduction
The key responsibility of a mechanical design engineer is to embody the overall product and all individual components, such that the product fulfils all the technical and customer requirements (Pahl et al. Reference Pahl, Beitz, Feldhusen and Grote2007). This task usually includes the definition of suitable product configurations, geometries, dimensions, materials, manufacturing information (type and tolerances) and assembly instructions. In this process, robust design (RD) offers a development approach that aims at improving safety economically by solving variation-related issues upstream by an improved product design (Taguchi, Chowdhury, & Wu Reference Taguchi, Chowdhury and Wu2007), instead of relying on the widespread, and costly use of design margins and overengineering (Eckert, Isaksson, & Earl Reference Eckert, Isaksson and Earl2019) or excessive quality control. The goal is to choose optimal parameter combinations in order to achieve consistently high product quality and performance despite variation related to production or assembly tolerances, varying load scenarios or ambient conditions of use (Taguchi, Chowdhury, & Wu Reference Taguchi, Chowdhury and Wu2007). In general, RD is a well-researched field, and fundamental ideas are widely accepted among researchers and practitioners. At the same time, many companies struggle with implementing a consistent RD strategy in practice (Gremyr, Arvidsson, & Johansson Reference Gremyr, Arvidsson and Johansson2003; Krogstie, Ebro, & Howard Reference Krogstie, Ebro and Howard2015), particularly in light of the ever-increasing possibilities for simulation-driven design. Despite the opportunities of commercially available, high-end software for finite element analysis (FEA), there remains a gap in most engineering industries when it comes to the systematic application of FEA to evaluate the effect of geometrical, material and load variations (Coleman Reference Coleman2012; Will Reference Will2015), hereinafter referred to as FEA-based variation simulation. Instead, FEA is used mainly on nominal designs and often in late development phases, leading to products with a high safety factor or overly optimistic designs prone to failure as variation occurs. The latter is typically not discovered before production ramp-up or after launch when the true distribution of variation reveals itself.
The present research explores the underlying reasons and possible solutions for the low uptake of FEA-based variation simulations in industrial development practice. The corresponding aim is to address the gap between current RD research that usually focuses on the details of advanced experimental designs (Jin, Chen, & Sudjianto Reference Jin, Chen and Sudjianto2003; Lehman, Santner, & Notz Reference Lehman, Santner and Notz2004; Joseph et al. Reference Joseph, Gu, Ba and Myers2019) and algorithms for robustness optimization (Du & Chen Reference Du and Chen2004; Raza & Liang Reference Raza and Liang2012; Xie et al. Reference Xie, Jiang, Zhou, Shu, Zhang, Meng and Wei2018; Kriegesmann Reference Kriegesmann2020; Li, Gao, & Xiao Reference Li, Gao and Xiao2020) and wider industrial implementation of these tools. The research focuses explicitly on applying FEA-based variation simulation for new designs in the early embodiment phase, rather than incremental design improvements supported by vast legacy knowledge and the reuse of existing models.
The paper is structured as follows. After Section 2, Section 3 outlines the twofold research approach based on performed interviews and an industrial case study. The interview results are briefly reviewed in Section 4, which, combined with the case study, creates the foundation for exploring and evaluating the existing industrial barriers. Finally, the Discussion of results is presented, before the main Conclusions are summarized.
2. Related literature
Despite its low uptake in the industry, RD is well-researched (Göhler, Ebro, & Howard Reference Göhler, Ebro and Howard2018). Park et al. (Reference Park, Lee, Lee and Hwang2006) provide a general overview of RD methods and suggest three categories of approaches: axiomatic design (Suh Reference Suh1995), the Taguchi method (Taguchi, Chowdhury, & Wu Reference Taguchi, Chowdhury and Wu2007) and robust design optimization (RDO; Capiez-Lernout & Soize Reference Capiez-Lernout and Soize2008). Although several authors have addressed the first category, that is, the evaluation of early product solutions in terms of robustness (Suh Reference Suh1995; Eifler & Howard Reference Eifler and Howard2018), the following focuses on the two latter approaches concerning the management of variation and uncertainty in mechanical product design and its vital role for a virtual robustness assessment based on FEA.
In his seminal work, Taguchi promotes the essential idea of off-line quality, that is, the frontloading of all cost and quality control ideas to the product design stage. Based on crossed array experiments, the objective is to choose optimal parameter combinations that will minimize the variation of the product’s quality characteristics, measured by the quality loss function (Taguchi, Chowdhury, & Wu Reference Taguchi, Chowdhury and Wu2007). Statisticians have appreciated Taguchi’s work (Logothetis & Wynn Reference Logothetis and Wynn1990; Laycock, Atkinson, & Donev Reference Laycock, Atkinson and Donev1995; Hamada, Wu, & Jeff Reference Hamada, Wu and Jeff2000; Draper & George Reference Draper and George2007), but it has also received critique, because the practical implications can make the experimental designs inefficient and unnecessarily complicated (Box, Bisgaard, & Fung Reference Box, Bisgaard and Fung1988). More recent reviews have evaluated the current status of this research direction (see, e.g., the review by Robinson, Borror, & Myers (Reference Robinson, Borror and Myers2004)) and also proposed new research areas in the field of RD and uncertainty management (Parnianifard et al. Reference Parnianifard, Azfanizam, Ariffin and Ismail2018).
Despite existing for decades and despite being well-researched from an academic perspective, there remains a gap in most engineering industries when it comes to the systematic use of FEA-based robustness analyses (Coleman Reference Coleman2012; Will Reference Will2015). This gap particularly holds true for industries that predominantly face the challenge of exploring new design ideas and product configurations in their development work, thus cannot benefit from using incremental design patterns such as available legacy knowledge or the reuse of simulation models. For these cases, it seems that existing research largely disregards the corresponding challenges for the implementation of the suggested tools and approaches. Instead, successful case studies from product development are typically found in industries that build on profound legacy knowledge, such as in the automotive industry (Söderberg, Lindkvist, & Dahlström Reference Söderberg, Lindkvist and Dahlström2006; Wu, Kuang, & Hou Reference Wu, Kuang and Hou2019; Shan et al. Reference Shan, Long, Yu, Shao and Liao2020; Xiong et al. Reference Xiong, Zou, Zhang and Shi2020), the aerospace industry (Forslund et al. Reference Forslund, Söderberg, Isaksson and Lööf2011; Sun et al. Reference Sun, Song, Baek and Li2014; Pohl et al. Reference Pohl, Thompson, Schlaps, Shahpar, Fico and Clayton2017; Madrid et al. Reference Madrid, Lorin, Söderberg, Hammersberg, Wärmefjord and Lööf2019) and the defence industry (Chen et al. Reference Chen, Tang, Ge, An and Guo2013; Ma et al. Reference Ma, Wang, Shi and Ren2019; Fenrich et al. Reference Fenrich, Menier, Avery and Alonso2020).
Against this background, Martin & Ida (Reference Martin and Ida2008) explore the lack of focus on the main RD principles found in most papers by mapping out the concurrent conflicts of resource efficiency, view on interactions and one-shot versus sequential experimentation. The authors emphasize that product quality will increase when engineers understand variation and the underlying principles of robustness in general. This is of particular importance today, because design practices rely to a higher degree on virtual experiments, which enable engineers to assess robustness earlier in the development process and systematically explore a wider design space of potential solutions. At the same time, the enormous opportunities come with additional challenges, because an implementation of FEA-based variation simulation in large industrial organisations will require a seamless process between design solutions, the necessary CAD models, suitable design of experiments (DOE) for the task at hand, setting up the FEA analysis and postprocessing of results. Unfortunately, these barriers are primarily neglected in existing research, and the available studies focus primarily on the simulation itself. Typical examples are: (i) traditional sampling and approximation methods of RDO; (ii) reliability-based design optimization approaches as discussed by (Chakri et al. Reference Chakri, Yang, Khelif and Benouaret2018), including sampling-based techniques from crude Monte Carlo simulations (Rashki, Miri, & Moghaddam Reference Rashki, Miri and Moghaddam2012) and (iii) importance sampling (Au & Beck Reference Au and Beck1999), to moment methods such as the first-order reliability method (Rackwitz & Flessler Reference Rackwitz and Flessler1978; Camuz et al. Reference Camuz, Bengtsson, Söderberg and Wärmefjord2019) and the second-order reliability method (Breitung Reference Breitung1984; Zhao & Ono Reference Zhao and Ono1999).
3. Methodology
The focus of the present research is twofold, concentrating on: (i) some key results of explorative, open-ended interviews with industry practitioners (Brix Nerenst et al. Reference Brix Nerenst, Ebro, Nielsen, Eifler and Nielsen2019) to identify typical challenges and barriers that prevent the widespread use of FEA-based variation simulation in mechanical product development and (ii) a case study in collaboration with a medical device manufacturer for an in-depth technical understanding of the identified challenges. In this way, the research acknowledges the importance of understanding the practical considerations while applying the methodology during real mechanical development. These are critical aspects, because the investigated barriers and suggested solutions for future research are in the cross field between fundamental research and practical applications.
3.1. Exploration of potential barriers
The barriers encountered by the industry when performing FEA-based variation simulation have been investigated through semistructured elite interviews (Brix Nerenst et al. Reference Brix Nerenst, Ebro, Nielsen, Eifler and Nielsen2019). Five face-to-face interviews were conducted over a 6-month period with five technical lead engineers from different companies to compile a list of relevant barriers. The five companies were carefully chosen based on their use of FEA in product development, their size and their level of legacy knowledge in designing new products. Instead of small incremental changes to an existing product, all the companies face developing completely new products to fulfil new customer requirements. In addition, the companies were selected from different industries to reduce a potential bias. The selected industries represent medical, marine, and industrial equipment, and all employ more than 1000 engineers. The selection of engineers within the companies was based on their role as mechanical leads, all having more than 10 years of experience. Therefore, the interviewees are considered part of the elite in this field of knowledge (Aberbach & Rockman Reference Aberbach and Rockman2002; Hochschild Reference Hochschild2009).
Based on the above assumptions, the barriers identified by the interviewees are assumed to also have relevance for other companies, even more so in the case of lower maturity in the field of FEA analyses. The open interview format was chosen to investigate the complex challenges of exploring different design solutions in an industry environment, going beyond the duration of a single case study, and to allow for retrospectively exploring the interviewees’ deep knowledge and impressions of today’s utilization of FEA in product development. Confidentially agreements were prepared before the interviews to ensure that the actual industrial cases could be discussed in enough detail to represent their genuinely experienced barriers. The focal points of the interviews are outlined in Table 1. Parts (a) and (b) of the interviews were controlled by a 20-minute window to ensure that all topics were covered. In closing, the discussion focused on where FEA-based variation simulation would create the most significant impact in a general product development process.
Table 1. Interview format of the two parts

Abbreviation: FEA, finite element analysis.
3.2. Evaluation of potential technical solutions: a case study
A live case study was conducted in collaboration with a participating medical device company to further analyse the experienced barriers from an industry case perspective, fully understand the mentioned barriers’ underlying details and evaluate potential solutions. The case study was carried out 2 months after the interviews, allowing time to ideate, select and develop the methods, tools and scripts for the suggested process. The purpose of the case study is to explore the identified barriers for applying FEA-based variation simulation in an industrial setting and represents the general complexity of day-to-day challenges. The technical outcome of the case study is a better understanding of the sealing process of a sterile canister when geometrical variation occurs.
The case study follows a commonly accepted approach (Prajapati Reference Prajapati2017; Madrid et al. Reference Madrid, Lorin, Söderberg, Hammersberg, Wärmefjord and Lööf2019) to reduce FEA-based variation simulation’s computational expenses through surrogate modelling (see Figure 1). The product considered in the case study is a cylindrical glass canister on top of which a rubber layer must be held in place by an aluminium cap (see Figure 2). One of the primary functional requirements is that the holding force of the aluminium cap is sufficiently high to ensure proper sealing when exposed to external forces during transport and handling. The three parametric CAD components were modelled in full 3D in the commercial software package 3DX/CATIA (Dassault Systems 2020), with the key parametric design parameters: membrane (height,
 $ H $
, and width,
$ H $
, and width,
 $ W $
), cap (thickness,
$ W $
), cap (thickness,
 $ T $
, length and inner radius,
$ T $
, length and inner radius,
 $ R $
) and cartridge (inner radius,
$ R $
) and cartridge (inner radius,
 $ r $
and height,
$ r $
and height,
 $ h $
; see Figure 3).
$ h $
; see Figure 3).

Figure 1. The idealized process for performing finite element analysis-based variation simulation.

Figure 2. Example of the finite element analysis results with component names and boundary conditions during deformation. The cap is fixed on the upper corner, whereas the displacement,
 $ d $
, is applied to the bottom of the cartridge.
$ d $
, is applied to the bottom of the cartridge.

Figure 3. Overview of the variable geometrical parameters in the undeformed state: membrane (height,
 $ H $
, and width,
$ H $
, and width,
 $ W $
), cap (thickness,
$ W $
), cap (thickness,
 $ T $
, length and inner radius,
$ T $
, length and inner radius,
 $ R $
) and cartridge (inner radius,
$ R $
) and cartridge (inner radius,
 $ r $
, and height,
$ r $
, and height,
 $ h $
).
$ h $
).
The material properties for the rubber membrane are viscoelastic and exposed to large compression, whereas the cap is elastic–plastic and exposed to plastic deformation. A global contact is defined with a Coulomb friction coefficient of 0.1. The cap is fixated on the top side. The translation (d) is applied in the negative y-direction on the cartridge. In order to minimize the computational time, only 10 degrees of the model are included in the FEA (Dassault Systems 2013, 2020).Footnote 1 An explicit solver was used to increase the robustness of the simulations, since an implicit solver can result in convergence issues when variation is applied and the amount of deformation and contact changes.
The DOE chosen is a two-level fractional factorial design
 $ {I}^{K-P} $
, where
$ {I}^{K-P} $
, where
 $ I $
is the number of levels,
$ I $
is the number of levels,
 $ K $
is the number of parameters and
$ K $
is the number of parameters and
 $ P $
is the fraction of the full design. The experimental design resulted in a total of 64 simulations required for the seven geometrical parameters. The DOE is executed using the 3DX/Process Composer, which automatically generates the geometrical changes, re-meshes, performs the FEA and stores the force curve for each simulation. An in-house python script is created to postprocess the DOE results: (i) analyse the parameter effects, (ii) create a metamodel (linear approximation) based on the significant main and interaction effects and (iii) perform a Monte Carlo simulation where each effect term is generated randomly with a normal distribution. All model parameters in Figure 3 are considered independent with a standard deviation of 7% of the mean (an approximation of the expected variation).
$ P $
is the fraction of the full design. The experimental design resulted in a total of 64 simulations required for the seven geometrical parameters. The DOE is executed using the 3DX/Process Composer, which automatically generates the geometrical changes, re-meshes, performs the FEA and stores the force curve for each simulation. An in-house python script is created to postprocess the DOE results: (i) analyse the parameter effects, (ii) create a metamodel (linear approximation) based on the significant main and interaction effects and (iii) perform a Monte Carlo simulation where each effect term is generated randomly with a normal distribution. All model parameters in Figure 3 are considered independent with a standard deviation of 7% of the mean (an approximation of the expected variation).
4. Results
The following section provides a summary of the results generated from the industrial interviews and the case study. Overall, the interviews resulted in the outcomes presented in Table 2. The three most critical barriers were further explored in the industrial case study.
Table 2. Overview of key results from interviews with five lead engineers
Abbreviation: FEA, finite element analysis.
4.1. Interview results
The interviews aimed to consider the use of FEA-based variation simulation in a general design context to understand the barriers preventing the widespread use of FEA-based variation simulation. For this purpose, Part A of the interviews focused on the question of alternative decision-making approaches and presented the interviewees with a generic design process as illustrated in the top and the middle of Figure 4. On this basis, alternative decision-making tools were discussed to clarify both the importance of different development phases and the corresponding time and resource constraints.

Figure 4. Currently used product development methods and decision-making approaches along a generic development process.
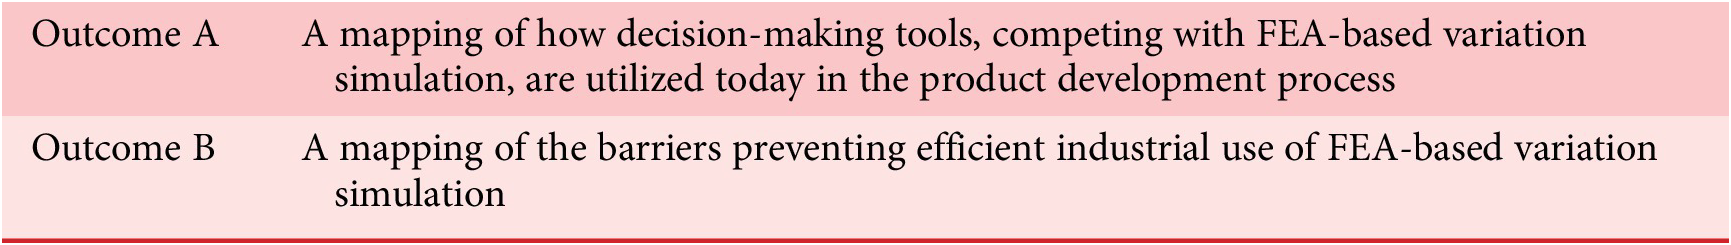
The bottom of Figure 4 presents Outcome A of the interviews, where the result is a mapping of the decision-making tools used, on average, by the interviewed lead engineers. Not surprisingly, Figure 4 shows that, in the early phase of a design process ‘Find principle solutions’, expert knowledge is utilized to make 50% of all design decisions. Furthermore, all interviews unanimously underlined the role of innovative solutions and the task of exploring not only product concepts but also different product embodiments, which indicates that decision time is crucial during the early development phase where rapid design changes occur and explain why decisions based on numerical simulations are low during this phase.
On this basis, the discussion of Part B of the interviews resulted in a list of all commonly experienced industrial barriers across the different companies (see Brix Nerenst et al. Reference Brix Nerenst, Ebro, Nielsen, Eifler and Nielsen2019 and Table A1 in Appendix A). Based on the discussions with the lead engineers, an extensive list of barriers was reduced to three barriers for further investigation. These three barriers are deemed most critical in preventing the widespread use of FEA-based variation simulation while being solvable with academic research.
All lead engineers agreed that the most relevant barrier is: (i) a lack of CAD model maturity and robustness, that is, limited definition of essential details and parametric modelling in the early embodiment phase. While firstly related to the time and resource aspects of parametric CAD, The lack of more useful parametric CAD methodologies leads to limited ‘tuning’ of existing parameters in the finalization of the design. Optimization of the robustness is therefore often limited to a highly constrained solution space.
Further complicating the matter were the software setups to achieve FEA-based variation simulation. All companies develop the CAD models in one software and perform FEA in another. The geometry is transferred from the CAD application to the FEA application in a neutral format, for example, Standard for the Exchange of Product Data STEP, whereby the CAD parametric is lost. The existing approach typically leads to an inefficient manual process where multiple new CAD models are created repeatedly to bring out the effect of changing specific design parameters. As a result of the manual process, only a few parameters (max. 1–3) are included in the DOE. In contrast, the lead engineers deemed a screening of more than 10 parameters necessary to effectively use FEA-based variation simulation when exploring different embodiments.
This desire leads to the second barrier of performing FEA-based variation simulation: (ii) Selection of an effective DOE and postprocessing of the results require specialist knowledge. Because the parameters increased, selecting effective designs, that is, a feasibly low number of simulations aligned with the corresponding design decisions, became increasingly difficult. Although Simpson et al. (Reference Simpson, Peplinski, Koch and Allen2001) provide a comprehensive overview of DOEs and metamodels, industrial utilization combined with FEA remains limited. The lead engineers explained that generating efficiently small experimental designs, postprocessing the data and trusting the results require specialized knowledge, which generally does not exist in the design teams.
The third barrier experienced is purely technical: (iii) To date, the FEA software is found to be inadequate in supporting the automatic execution of multiple simulations. With the time aspect in mind, the tedious manual setup and execution of each simulation require too much effort, resulting in other decision-making tools being used instead (see Figure 4).
4.2. Case study results
The case study presented in Section 3 considers the sealing of a sterile canister. The case study is primarily used to detail the found barriers from a technical perspective and explore possible solutions for improving the adoption rate of FEA-based variation simulation. Due to the case of company’s intellectual property, specific design details have been omitted.
The case study results in 64 successful simulations executed automatically based on a two-level fractional factorial design,
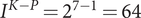 $ {I}^{K-P}={2}^{7-1}=64 $
. The total runtime was 32 hours (Intel(R) Xeon(R) CPU E5-2690 v4 @ 2.60 GHz). Figure 5 shows the 64 force–displacement curves with a Butterworth filter applied to reduce the numerical noise (Butterworth Reference Butterworth1930). The filtering of the raw FEA signal is performed in Python3 utilizing the Scipy package (Scipy.signal.filtfilt(); see the supplementary material of The SciPy Community 2020). The pull-off force is measured at the bottom of the glass cartridge, whereas the displacement is measured as the vertical displacement of the rigid glass cartridge. When the force is above the zero line (dotted red line), only the membrane exerts a force onto the cartridge. Because the force drops below the zero line, an additional pull force on the cartridge is required to pull the cap off, that is, the holding force. The simulations show that the holding force is above the zero line throughout the deformation for some geometrical configurations. Potentially, this results in caps being pressed off by the internal forces from the compressed membrane. For other configurations of the geometry, the holding force is below the zero line and by far exceeds the required holding force (see Figure 5). The dotted green line indicates the specified nominal force, which lies close to the average of the simulated configurations. However, the applied geometrical variance has a large impact on the holding force. The maximum holding force is defined for each simulation and used as the functional response in the statistical analysis of the DOE. An ANOVA test is performed for the statistical analysis.
$ {I}^{K-P}={2}^{7-1}=64 $
. The total runtime was 32 hours (Intel(R) Xeon(R) CPU E5-2690 v4 @ 2.60 GHz). Figure 5 shows the 64 force–displacement curves with a Butterworth filter applied to reduce the numerical noise (Butterworth Reference Butterworth1930). The filtering of the raw FEA signal is performed in Python3 utilizing the Scipy package (Scipy.signal.filtfilt(); see the supplementary material of The SciPy Community 2020). The pull-off force is measured at the bottom of the glass cartridge, whereas the displacement is measured as the vertical displacement of the rigid glass cartridge. When the force is above the zero line (dotted red line), only the membrane exerts a force onto the cartridge. Because the force drops below the zero line, an additional pull force on the cartridge is required to pull the cap off, that is, the holding force. The simulations show that the holding force is above the zero line throughout the deformation for some geometrical configurations. Potentially, this results in caps being pressed off by the internal forces from the compressed membrane. For other configurations of the geometry, the holding force is below the zero line and by far exceeds the required holding force (see Figure 5). The dotted green line indicates the specified nominal force, which lies close to the average of the simulated configurations. However, the applied geometrical variance has a large impact on the holding force. The maximum holding force is defined for each simulation and used as the functional response in the statistical analysis of the DOE. An ANOVA test is performed for the statistical analysis.

Figure 5. Filtered (Butterworth) history output of the holding force of all 64 simulations. The internal force being the force exerted by the compressed membrane. The external force being the cap’s holding force.
Based on the 15 main and interaction effects, a metamodel is constructed, shown in Eq. (1) with
 $ {C}_1-{C}_{16} $
being parameter coefficients determined by the fractional factorial design. The metamodel achieved an accurate fit with an R-squared value of 0.99792.
$ {C}_1-{C}_{16} $
being parameter coefficients determined by the fractional factorial design. The metamodel achieved an accurate fit with an R-squared value of 0.99792.
 $$ {\displaystyle \begin{array}{c}\hat{y}={C}_1-{C}_2R+{C}_3T+{C}_4L-{C}_5h+{C}_6r-{C}_7H\\ {}\hskip2.8em -{C}_8W-{C}_9 RT-{C}_{10} Rr+{C}_{11} TL-{C}_{12} Th\\ {}\hskip-1em +{C}_{13} Tr+{C}_{14} Lr-{C}_{15} hr+{C}_{16} TL h.\end{array}} $$
A comparison between the FEA results and the metamodel is shown in Figure 6 to check for potential outliers, for example, avoid a missed second-order effect. The scale of the corresponding parameter effects is shown in Figure 7. The figure shows how the different geometrical parameters can increase or decrease the holding force. In this case study, the three most impactful parameters are the thickness of the cap (
 $ T $
), the radius of the cartridge (
$ T $
), the radius of the cartridge (
 $ r $
) and the radius of the cap (
$ r $
) and the radius of the cap (
 $ R $
). A geometrical increase of
$ R $
). A geometrical increase of
 $ T $
and
$ T $
and
 $ r $
results in an increased holding force, whereas an increase of
$ r $
results in an increased holding force, whereas an increase of
 $ R $
reduces the holding force. Following these parameters, a number of interactions are presented, which can be challenging to predict as a designer in the case of complex geometry, whereas the DOE naturally brings out the information.
$ R $
reduces the holding force. Following these parameters, a number of interactions are presented, which can be challenging to predict as a designer in the case of complex geometry, whereas the DOE naturally brings out the information.

Figure 6. Comparing the metamodel with the finite element analysis results to evaluate the metamodel accuracy and to check for outliers.
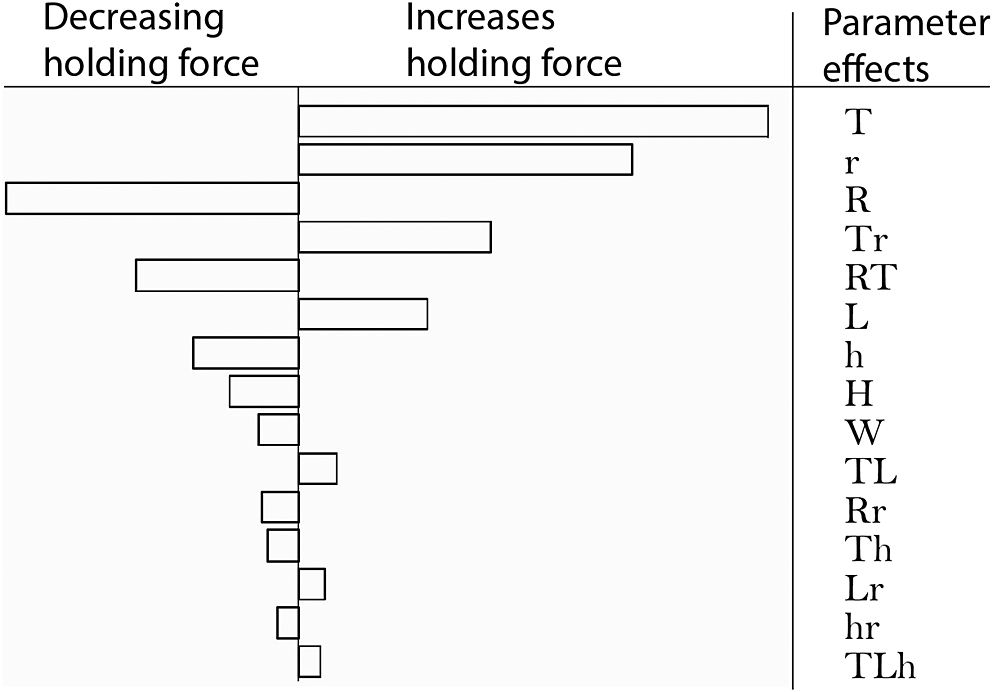
Figure 7. Main and interaction effects sorted by the impact on the holding force. An overview of possible parameters to adjust the design performance.
By exploiting the cost-efficient (in terms of computing resources) evaluation of the metamodel in Eq. (1), the estimated holding force of 100,000 samples is presented in Figure 8. The seven parameters included in Eq. (1) are all varied with a normal distribution with a standard deviation of 7% of the mean (an approximation of the expected variation). From Figure 8, it is seen that the mean,
 $ \mu $
, aligns with the product specification, and that in this example, a margin of six standard deviations exists between the mean and a holding force of zero, that is, an expected failure rate very close to 0%. However, if the standard deviation is increased to 17% of the mean, the expected failure rate is increased to 3.2%.
$ \mu $
, aligns with the product specification, and that in this example, a margin of six standard deviations exists between the mean and a holding force of zero, that is, an expected failure rate very close to 0%. However, if the standard deviation is increased to 17% of the mean, the expected failure rate is increased to 3.2%.

Figure 8. The estimated distribution of the holding force for 100,000 produced samples. The nominal holding force is denoted
 $ \mu $
and one standard deviation as
$ \mu $
and one standard deviation as
 $ \sigma $
.
$ \sigma $
.
The results from the metamodel provide a statistical foundation to evaluate the suitability of the holding force, which in this case shows that proper sealing of the cap is ensured within the allowed variation. The metamodel demonstrates that a cap can only be pushed off in sporadic cases, because the probability of all parameters contributing to a low holding force is very low. The probabilistic evaluation can provide greater insight into the design performance than just relying on the direct DOE data visualized in Figure 5. FEA-based variation simulation can be used to calculate the cost of a given tolerance specification versus the expected production scrape rate, because such tolerance calculations have an enormous potential to reduce production costs across industries. Overall, the DOE approach provides a much more detailed design understanding compared with the safety-factor approach.
Results of barrier mitigation
The following explores how the three main barriers were investigated and suggests future research and improvements. A summary of the derived results is provided in Table 4.
A lack of CAD model maturity and robustness
In the case study, the CAD assembly of an existing product was used, so that the question of CAD model maturity played a minor role in the investigation. However, while only containing two components and seven parameters, the original company CAD models were shown to be poorly configured and had no parametric controls. The result was regeneration issues due to unrobust modelling. Figure 9 shows an example of the original sketch constraints for one key parameter (masked other specifications). The red highlight in Figure 10 shows how parameter configurations can result in unsuccessful regeneration of sketches. Another experienced issue with the regeneration of CAD models was that one feature refers to another feature not yet generated. Creating a model which disregards the ‘parent–child’Footnote 2 relationships can become very sensitive.

Figure 9. Initial CAD sketch of the cartridge with unrobust constraints.

Figure 10. Fold-over of sketch lines due to unrobust sketch constraints.
For addressing-related issues, and based on existing work on CAD methodologies (Camba, Contero, & Company Reference Camba, Contero and Company2016), the case study subsequently implemented a resilient modelling strategy to mitigate feature regeneration issues. Resilient modelling (Gebhard Reference Gebhard2013) suggests organizing the feature tree in six standardized groups, as shown in Table 3. In the case study, it was possible to increase the CAD models’ ability to regenerate to 100% when combining resilient modelling and stacking of sketch constraints. Figure 11 shows a simple example of an improved configuration, where the constraints ensure a successful regeneration for positive dimensions of L1–L3 (no fold-over as seen in Figure 10).
Table 3. Resilient modelling increases the CAD model robustness by creating features in a specific sequence. This removes wrongful links between ‘parent’ and ‘child’ features which can disrupt the regeneration
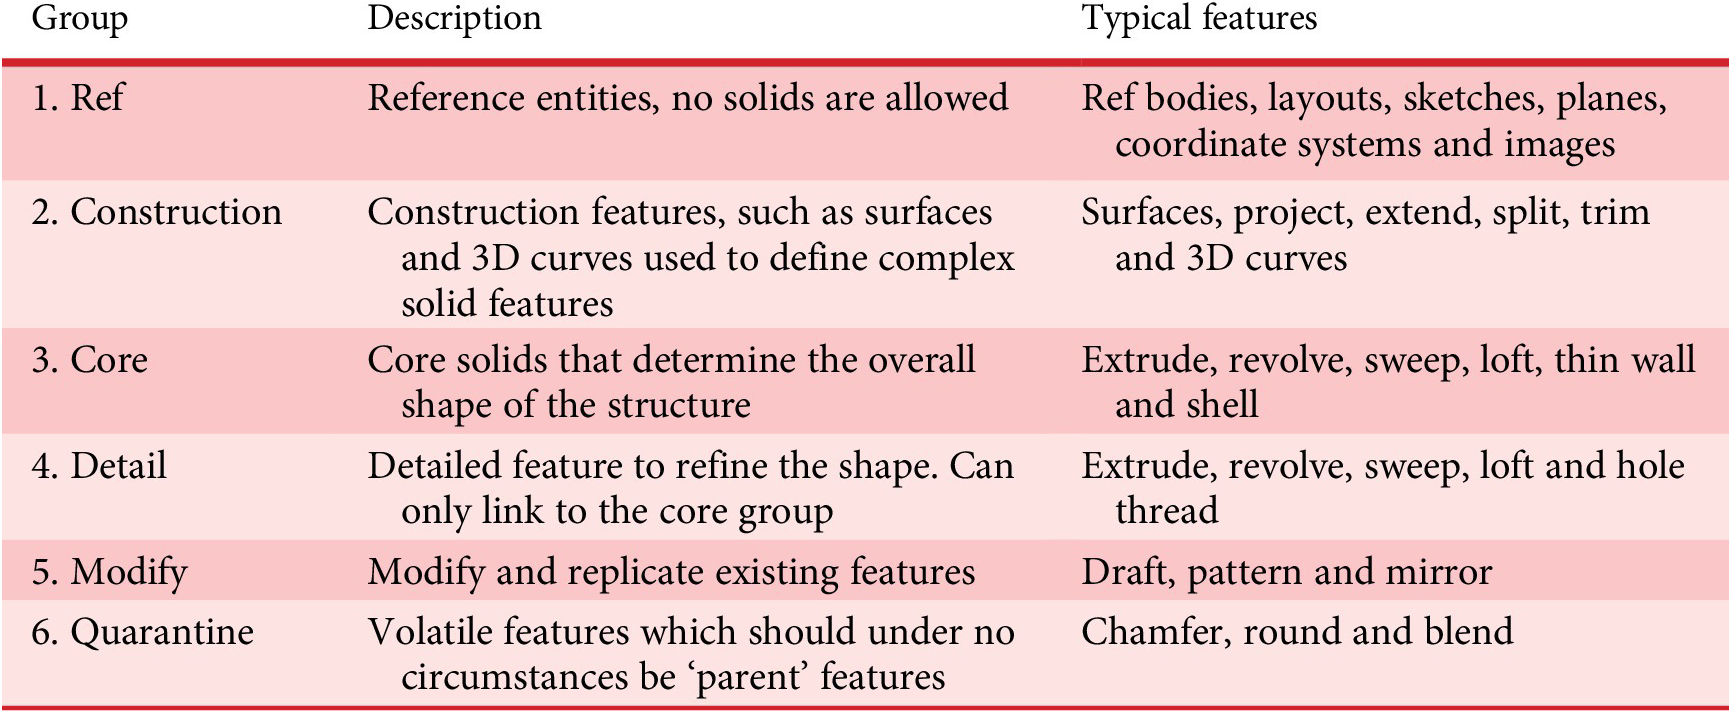
Table 4. Necessary design support for early finite element analysis-based variation assessment
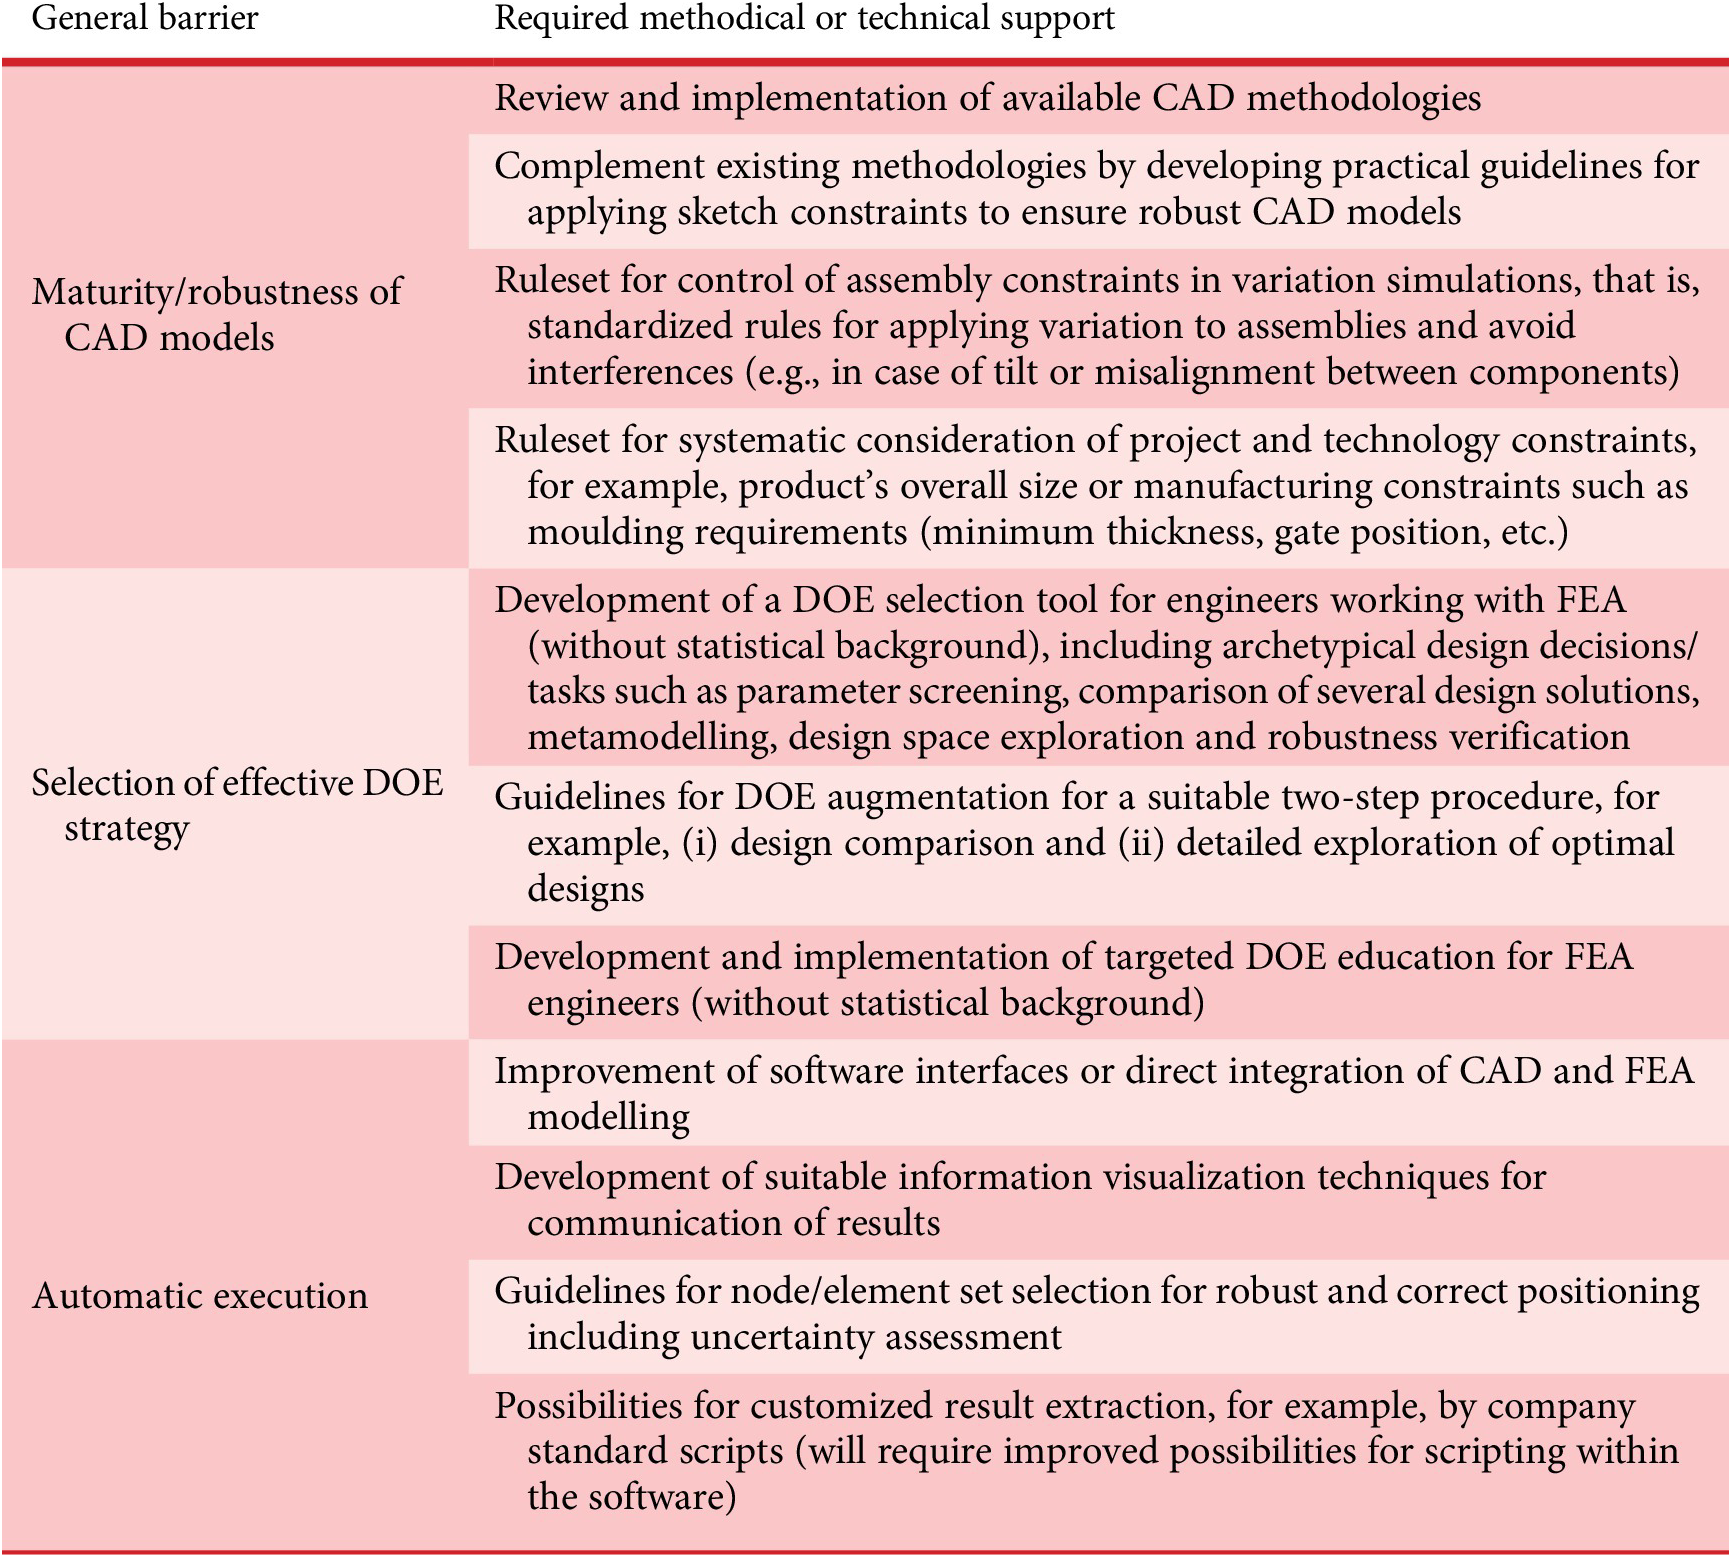
Abbreviations: DOE, design of experiments; FEA, finite element analysis.

Figure 11. Alternative sketch constraints to increase robustness.
Surprisingly, based on the interviews and the professional experience by the authors, CAD modelling methodologies are, however, not widely accepted as standard industry practice. The lack of use is in line with previous research, for example, the work of Aranburu, Justel, & Angulo (Reference Aranburu, Justel and Angulo2020), who clearly highlight the need for increased focus on robust CAD models. Although some DOE techniques (Latin hypercube sampling) can cope with data loss, that is, some of the simulations are allowed to fail, it often comes at the cost of a more significant number of simulations. The latter is particularly critical from a design perspective, where the task is not necessarily a fully validated simulation but an efficient and sufficiently accurate estimation of parameter effects.
Selection of an effective DOE and postprocessing of the results require specialist knowledge
The options for different DOEs were experienced to be vast in the commercial software, either as a built-in option or as an upload possibility for pregenerated design matrices. However, specialized guidance, particularly on options for augmentation, and suitability for metamodelling, is experienced to be nonexistent. Instead, only general descriptions of the experimental designs are provided. Although some guidance does exist in literature (Simpson et al. Reference Simpson, Peplinski, Koch and Allen2001), the complexity and fundamental understanding of how to choose a suitable DOE for a variety of design decisions will require additional education of industrial FEA specialists. Without this knowledge, experimental designs can promise similar capabilities, while the number of required runs can vary significantly or contain other limitations. For example, the case study utilized 64 runs to explore all possible interaction effects. However, a subsequent investigation proved this unnecessary and that 32 runs would have been sufficient for exploring factor relevance from a design perspective. However, none of the companies had standard DOE procedures for the wide variety of design decisions and tasks, such as parameter screening, metamodelling or probabilistic evaluation, in place.
To date, the FEA software is found to be inadequate in supporting the automatic execution of multiple simulations
In this case study, the FEA-based variation simulation resulted in the process shown in Figure 12. Due to the requirements experienced for robust CAD, data extraction and postprocessing, the depicted process differs from the more straightforward process described in the literature (see Figure 1). The case study shows how commercial FEA software can execute 64 simulations without interruptions, making the process significantly more efficient and less prone to human error by omitting manual CAD configuration and STEP format. Although the software provides some automatic postprocessing capabilities, the case study also shows that programming knowledge is required to enable flexibility. In conventional FEA, the results of deformation and stress/strain contours are interpreted manually by the specialist in an interactive viewer environment. However, when FEA is combined with an automated DOE process, the result of interest must be predefined, and a scheme to extract the results must be made automatic. In this case study, the holding force on the cartridge is stored as a history output within an additional process step scripted in Visual Basic for Applications VBA. In other cases, the strain or stress in a specific region of the structure might be of interest. The pitfall is that the size and position of the node/element set can be affected by the selection options combined with changing geometry due to the applied variation. Although commercial software provides multiple methods for node/element set selection (see the example in Figures 13–15), the robust and correct positioning will be essential, because the automated process makes it difficult to trace back the corresponding influences.

Figure 12. Illustration of the data flow used in the finite element analysis (FEA)-based variation simulation study. The process highlights the need for robust CAD and shows how the design of experiments and FEA is executed in 3DEXPERIENCE, while further postprocessing of the raw data is performed in Python.

Figure 13. Example of proximity selection. This method includes all nodes/elements within a defined range of a reference line or surface.

Figure 14. Example of spatial selection. This method includes all nodes/elements within a sphere or box placed in the global coordinate system.

Figure 15. Example of partitioning selection. This method includes all nodes/elements within a volume controlled by partitioning.
5. Discussion and conclusion
A combined investigation of interviews and a case study with well-established companies utilizing FEA for product development is performed to explore the barriers preventing the widespread use of FEA-based variation simulation. Based on five interviews, the corresponding lead engineers from different industry sectors acknowledged the potential of improving the current development by achieving more RDs at a lower cost and unanimously underlining that the current state-of-the-art commercial software does not yet provide integrated and seamless solutions to overcome the barriers to making FEA-based variation simulation a daily exercise in an industry environment.
Against this background, the subsequent case study shows how FEA-based variation simulation provides the potential to explore and understand variation. The method enables engineers to identify significant design parameters, virtually investigate the performance of 100,000 designs and finally evaluate tolerance specifications versus scrap rate.
The present work sets itself apart from existing research by focusing on industries where entirely new concepts are developed, explored and compared continuously. Therefore, some of the derived methodical and technical support measures might very well be less relevant in industries with profound legacy knowledge and more incremental design changes, that is, where the used models have received significantly more attention over the years.
Although the case study underlines that performing simpler forms of FEA-based variation simulation for design purposes is achievable, the critical difference between the industry projects and the case study is still the time aspect. The work laid out is essentially unbounded in time. Thus, the case study allowed multiple iterations to set up a proper CAD model for subsequent use in the FEA-based variation simulation and investigate potential DOEs. Although the presented work should therefore be considered a first step to a more systematic implementation of FEA-based variation simulation in industry, it also clearly shows a discrepancy between the advanced developments being made in literature and the utilization of FEA-based variation simulation in the broader field of mechanical engineering. Although research primarily focuses on more sophisticated algorithms for multi-objective RDO, the broader engineering industry struggles with more fundamental parts of the process. For this reason, the present study provides new research directions to enhance the uptake of FEA-based variation simulation and support a wider range of mechanical design companies on the transition from safety factors to a probabilistic design approach.
Appendix A. Extensive barrier list
Table A1. Overview of discussed barriers with the five interviewed lead engineers (Brix Nerenst et al. Reference Brix Nerenst, Ebro, Nielsen, Eifler and Nielsen2019)

Abbreviations: DOE, design of experiments; FEA, finite element analysis.


 Open access