


Ruminant production systems should evolve towards the improvement of animal feed efficiency, the animal’s ability to transform feed into food in a context of minimising the use of human-edible resources(Reference Makkar and Beever1). Beef cattle have a low biological feed conversion efficiency (FCE) compared with other livestock species(Reference Tolkamp, Wall and Roehe2). However, grazing cattle fed high-forage diets can be greater net protein producers compared with other livestock species, supplying more human-edible protein than they consume(Reference Wilkinson3). Thus, feeding strategies should be proposed to farmers to increase the profitability of the beef cattle sector in a context of increasing the use of diets based on cellulosic feedstuffs, which paradoxically are resources promoting low biological feed to food conversion efficiency.
Protein supplementation, and specifically rumen-undegradable protein, has been shown to improve performance in growing cattle fed high-forage diets(Reference Titgemeyer and Löest4). This suggests that rumen bypass protein may correct for an amino acid (AA) deficiency. In this sense, methionine (Met) has been suggested(Reference Richardson and Hatfield5) and demonstrated(Reference Storm and Orskov6) to be the first-limiting AA for growth of ruminants depending only on microbial protein. Because microbial contribution to metabolisable protein is very high in forage-fed ruminants(7), Met can be expected to be the first-limiting AA in growing cattle fed high-forage diets(Reference Nimrick, Hatfield and Kaminski8,Reference Titgemeyer and Merchen9) . Moreover, meeting AA requirements becomes more crucial during stages of high productivity. Indeed, net protein requirements are relatively high in growing young bulls of late maturing breeds (Charolais, Simmental or Limousin), retaining 35–45 % of their energy as protein(Reference Geay and Robelin10). In this situation, cattle cannot always satisfy their AA requirements with only microbial supplies and extra rumen bypass protein needs to be supplied with the resulting higher feeding costs. Thus, post-ruminal Met supplementation may be required in rapidly growing animals fed high-forage diets(Reference Oke, Loerch and Deetz11).
The principle of limiting AA in animal production is well established in swine and dairy cattle. Although a positive impact of AA supplementation on beef cattle performance has been reported in the literature(Reference Wessels, Titgemeyer and St. Jean12), the current French feeding system includes no AA recommendations for this type of animal(7). With the evolution of animal genotypes in recent decades towards higher productivity phenotypes and the predictable enhancement of cellulose incorporation in ruminant rations, there is a need to first evaluate the impact of balancing diets for AA supply on beef cattle performances and then to study the metabolic mechanisms underlying the improvement in growth efficiency.
We hypothesised that like in dairy cows, the principle of limiting AA also applies to growing cattle and so supplementing rumen-protected Met to high-forage diets containing low metabolisable Met content would improve the performance of fast-growing beef cattle through a better N use efficiency (NUE). We also expected that this improvement would be greater as dietary protein level decreases. Therefore, the objective of this study was to assess the effects of Met-balanced diets on animal performance, feed efficiency and N metabolism in growing-fattening Charolais bulls fed high-forage diets formulated to supply protein close to or above requirements. Estimations of body composition together with the analysis of plasma metabolites and the assessment of the isotopic turnover rate of plasma proteins were used to interpret changes in N metabolism.
Materials and methods
The experiment was conducted at Herbipôle (INRA, UE 1414) in compliance with the National Legislation on Animal Care. The C2EA-02 animal research ethics committee (Auvergne, France) prospectively approved this research, and thereafter the Ministry of Agriculture (France) validated it with the approval number 7180-2016101016361277v4. Animals were continuously monitored by trained staff for signs of pain, suffering and distress associated with the procedures further described as well as routinely assessed for health and welfare problems.
Animal, diets and measurements
Thirty-six growing-fattening Charolais bulls (320 (sd 33) kg and 266 (sd 22) d) were evenly assigned, according to their age, weight and pre-weaning performance, to one of the four experimental diets (n 9/treatment). Experimental diets (Table 1) resulted from a factorial 2 × 2 design: two dietary metabolisable protein levels (100 % (Normal) v. 120 % (High) of requirements(7)) and two dietary Met concentrations (unbalanced v. balanced (+M) diets). Diets were formulated for similar net energy content and consisted of 54 % grass silage, 6 % wheat straw and 40 % concentrate (DM basis) with amounts adjusted daily to ensure at least 10 % refusals. Experimental diets were formulated to supply 1·4 times the net energy maintenance requirements and to promote about 1·40 kg/d of average daily gain (ADG) according to the INRA feeding system for young Charolais bulls of about 500 kg of body weight (BW)(7). Greater protein content in High v. Normal protein diets was mostly achieved by replacing some wheat by a commercial formaldehyde-treated soyabean meal (48 % crude protein (CP) soyabean meal with 1 % (w/w) of a solution made from 30 % of formalin + 5 % of methanol, NatUp), which increased protein in the diet mostly through the supply of rumen bypass protein (more than 70 % of CP according to INRA tables(7)). The addition of rumen-protected Met (Smartamine M®, Adisseo France) was identical across the two dietary protein levels (7 g/d throughout the study). Smartamine M was top-dressed over the total mixed ration. Smartamine M is composed of small beads, containing a minimum of 75 % dl-Met, protected physically by a pH-sensitive coating, having a Met bioavailability of 80 %(Reference Graulet, Richard and Robert13). Therefore, it was assumed that 7 g of Smartamine M provided animals with 4·2 g of metabolisable Met. Because no specific recommendations are currently provided by the INRA feeding system(7) for growing cattle, this amount of Met supplementation was designed to slightly exceed the metabolisable Met requirement for dairy cattle (2·4 % of metabolisable protein(7)). The estimated Met content was 2·6 % of metabolisable protein on average in balanced diets and almost 25 % lower (about 2·0 % of metabolisable protein) for the unbalanced diets.
Table 1. Ingredients, chemical composition and nutritive values of experimental diets tested on fattening Charolais bulls

OM, organic matter; CP, crude protein; NDF, neutral-detergent fibre; ADF, acid-detergent fibre; NE, net energy; PDIA, rumen-bypass protein digestible in the intestine; PDI, protein digestible in the small intestine (metabolisable protein); RPM, rumen-protected methionine.
* Minerals and vitamin mix: 5 % P, 25 % Ca, 8 % Mg, 0·2 % Na, vitamin A (210 mg/kg), vitamin D3 (3·75 mg/kg), vitamin E (2730 mg/kg) and vitamin B1 (4·5 mg/kg).
† Estimated from enzymatic digestion with pepsin-cellulase(Reference Aufrère21).
‡ Estimated from an enzymatic hydrolysis assay(Reference Aufrère and Cartailler20) for concentrates or from chemical composition for grass silage.
§ Feed values were estimated from analysed chemical composition and INRA2018 equations using Systoolweb version 1.2 (www.systool.fr).
║ PDI:NE ratio. Recommended values are between 53 and 48 for body weights of 300 and 600 kg, respectively, in fattening Charolais bulls(7).
Animals were housed in free stalls equipped with electronic gates (Dairy gate®) to measure individual daily feed intake. Diets were distributed as total mixed ration (TMR) once daily (08.00 hours), and water was freely available. The experiment was preceded by a 5-week transition period to allow the animals to adapt to diets. Daily amounts of TMR as well as individual refusals were precisely weighed to calculate individual feed intakes throughout the performance test. DM was measured twice a week for feed ingredients and daily for TMR and refusals (103°C, 48 h). Feed samples pooled over the whole experiment were stored at −20°C before analysis. At the start of the experiment, animals were weighed on two consecutive days, fortnightly thereafter, and finally on two consecutive days just before slaughter. Bulls were always weighed at 13.30 hours without a previous feed restriction. Ultrasound echography measurements were performed over time for evaluating the composition of BW gain. Ultrasound echography (Aloka Prosound 2 with a linear probe UST5820-5) was conducted every month from the start to the end of the performance test (n 7) and in three different anatomical places per animal and time (latissimus dorsi muscle between the 12th and 13th rib, gluteus superficialis muscle between the Tuber coxae and Tuber ischiadicum, and gluteus medius muscle at the 4th lumbar vertebrae level between the transverse process) after trimming the hair coat with a handheld electric clipper. Distances analysed from each anatomical place were the skin (D0) and backfat thickness (D1) that include both subcutaneous tissues and skin. The thickness of subcutaneous adipose tissue and connective tissues was calculated as D1–D0.
Animals were slaughtered at the INRA experimental slaughterhouse of UE1414 Herbipôle Unit at a rate of four animals per week once the first dietary treatment reached on average of 720 kg BW (corresponding to a target market carcass weight of about 420 kg). All four animals were slaughtered on the same day within each week. Slaughter was carried out during 2 months (May and June 2017), and every day one animal from each dietary treatment was slaughtered to keep on average the same experimental duration (from start to the slaughter) across dietary treatments.
Hot carcass, internal fat (i.e. heart, mesenteric, pelvic and kidney fat) and visceral organ weights were recorded. Carcasses were graded for conformation and fat score according to the EU classification on a fifteen-point scale and chilled and stored at 4°C until 24 h post-mortem.
Isotopic nitrogen turnover rate
Following a change in the dietary isotopic composition, animal’s tissues progressively assimilate the new dietary isotopic signature(Reference Carleton and Del Rio14–Reference Abimorad, Ducatti and Castellani16). The rate at which this occurs is known as the isotopic turnover rate and depends largely on how fast the metabolic tissue replacement occurs(Reference Cantalapiedra-Hijar, Fouillet and Chantelauze17). We applied this less-invasive method to indirectly evaluate changes in the fractional protein synthesis rate of animal proteins resulting from our experimental conditions. For this, all animals were progressively enriched in 15N over 35 d while adapting to their respective diet (from day −36 to day −1); each animal received daily in the morning (08.30 hours) a capsule (10 × 3 mm) containing 20 mg of 15N-labelled urea (98 % atom percent excess; Sigma-Aldrich). The capsule was mixed with about 200 g of concentrate (the one assigned to the animal) in a small bucket within the feeder just before the only meal distribution (09.00 hours). At 20 min after administration, it was systematically checked that the capsule had been swallowed by the animal. The rest of the diet was then distributed to the feeder. On day 0 (onset of the experiment), animals no longer received the 15N-labelled urea and blood was sampled from that day onwards as further detailed. Kinetic equations of 15N depletion in plasma proteins from these same animals have been previously published in a methodological paper(Reference Cantalapiedra-Hijar, Fouillet and Chantelauze17).
In vivo sampling
At the onset of the experiment (day 0), all animals were biopsied under local anaesthesia from the middle of a triangle formed by the last lumbar vertebrae, tail base and ischial tuberosity. Subcutaneous adipose tissue was sampled to determine the diameter of adipocytes and thus to estimate the fat mass in the empty BW at the beginning of the trial according to INRA equations previously detailed(Reference Cantalapiedra-Hijar, Ortigues-Marty and Sepchat18).
To determine the N isotopic turnover rate in plasma proteins, blood was sampled at 08.00 hours (during meal distribution) by venepuncture from the caudal vein of all animals on days 0, 3, 7, 11, 15, 21, 35, 49, 77 and 142 (n 10 per animal) after stopping the 15N-labelled urea administration. Blood was collected into 9-ml evacuated tubes (BD vacutainer) containing lithium heparin as an anticoagulant, centrifuged within the first hour at 2500 g for 15 min at 4°C and stored at −20°C for determination of δ15N values in total plasma proteins as previously described(Reference Cantalapiedra-Hijar, Ortigues-Marty and Sepchat18).
Plasma samples obtained on days 21, 77 and 142 after stopping the 15N–urea administration (start, middle and end of the fattening period) were also used for analysing acetate, β-hydroxy-butyrate, glucose and urea, while only those obtained on days 77 and 142 were analysed for AA and AA-related metabolites through a targeted metabolomics approach.
Laboratory analyses
Feeds were ashed at 550°C for 6 h for organic matter (OM) determination. N content was analysed by the Dumas method (norm ISO205 16634-1, 2008, using a Rapid N Cube, Elementar Analysensysteme GmbH). Neutral-detergent fibre and acid-detergent fibre were determined according to Van Soest et al. (Reference Van Soest, Robertson and Lewis19). The enzymatic CP degradability of concentrates was determined by in vitro protease hydrolysis for 1 h according to Aufrère & Cartailler(Reference Aufrère and Cartailler20), whereas the enzymatic OM digestibility was assessed as described by Aufrère(Reference Aufrère21). The AA composition of feed (grass silage and concentrate) was analysed using an HPLC (Alliance System, Waters) following protein hydrolysis with 6 m HCl (24 h). The sulfur AA (i.e. Met and Cys) were analysed separately by oxidation using performic acid before the protein hydrolysis. For analysis of tryptophan, alpha methyl dl-Trp was added to the sample, followed by hydrolysis in barium hydroxide in the absence of O2 using an autoclave. After the acidification of an aliquot fraction, tryptophan was separated by HPLC using a fluorimetric detector.
Plasma concentrations of glucose, β-hydroxybutyric acid, NEFA and urea were analysed by spectrophotometry with an automated analyzer (Arene 20XT, Thermo Scientific). For the targeted metabolomics approach, electrospray ionisation MS was performed on plasma samples using the Absolute IDQ p 180 (Biocrates Life Science AG). Only AA and related compounds are presented here.
Nitrogen stable isotope analysis
The N isotopic composition (δ15N) of freeze-dried plasma proteins and ground-dried diet ingredients was determined using an isotope-ratio mass spectrometer (Isoprime; VG Instruments) coupled to an elemental analyser (EA Isoprime; VG Instruments). Internal standards (glutamic acid) were included in every run to correct for possible variations in the raw values determined by the mass spectrometer. Results were expressed using the delta notation according to the following equation:
 $${\delta ^{15}}{\rm{N }} = \left( {\left( {{{\rm{R}}_{{\rm{sample}}}}/{{\rm{R}}_{{\rm{standard}}}}} \right)-1} \right) \times 1000,$$
where Rsample and Rstandard are the N isotope ratio between the heavier isotope and the lighter isotope (15N:14N) for the sample being analysed and the internationally defined standard (atmospheric N2, Rstandard = 0·0036765), respectively, and δ is the delta notation in parts per 1000 (‰) relative to the standard.
Isotopic turnover rate modelling
The post-diet switch δ15N kinetics measured in plasma protein were analysed according to a mono-exponential model(Reference Martinez del Rio and Carleton22):
 $${\delta ^{15}}{\rm{N}}\left( {\rm{t}} \right) = {\delta ^{15}}{{\rm{N}}_\infty } + \left( {{\delta ^{15}}{{\rm{N}}_0}-{\delta ^{15}}{{\rm{N}}_\infty }} \right) \times {\rm{exp}}^{ - {\rm{kt}}}$$
where t (d) is the time since the 15N diet-switch, δ15N(t) (‰) is the δ15N value in plasma proteins at time t, δ15N0 (‰) is the initial δ15N value and δ15N∞ (‰) is the asymptotic value of plasma proteins after the animal has reached isotopic steady state with its basal diet (without 15N–urea administration). The parameter k (d−1) is the fractional N isotopic turnover rate in plasma proteins. The model parameters (i.e. δ15N∞, δ15N0 and k) were estimated using a non-linear procedure and statistically analysed through a non-linear mixed-effect model (nlme package(Reference Pinheiro and Bates23)) fitted by maximum likelihood in the R software(24) with experimental dietary factors (protein content, Met content and their interaction) considered as fixed effects and the animal as a random effect. Significant effects were declared when P ≤ 0·05, and a trend was considered when 0·05 < P < 0·10.
Calculations and statistical analysis
Dietary feed values (Table 1) were calculated using INRA equations(7) and the systoolweb software (www.systool.fr) from analysed chemical composition, in vitro digestibility measurements (Upscience-Labs, Saint-Nolf, France), and observed DM intakes and average animal BW.
Body composition (protein and lipid contents) at the onset and end of the experiment was estimated as previously reported(Reference Cantalapiedra-Hijar, Ortigues-Marty and Sepchat18). Briefly, starting body composition was estimated from the diameter of subcutaneous adipose cells and equations proposed by Garcia & Agrabriel(Reference Garcia and Agabriel25), whereas carcass tissue composition (bone, muscle and fat) at the end of the experiment (slaughterhouse) was estimated using the equations proposed for Charolais bulls(Reference Robelin and Geay26). Further estimations of chemical whole-body composition (ash, protein and lipids) were performed from estimated carcass tissue composition and measured internal fat weights(Reference Robelin and Geay27). Whole-body protein and lipid gains during the experiment were calculated by differences between final and starting body compositions.
ADG was calculated as:
 $${\rm{ADG }}\; \left( {{\rm{kg}}/{\rm{d}}} \right) = \left( {{\rm{B}}{{\rm{W}}_{{\rm{slaugther}}}} - {\rm{ B}}{{\rm{W}}_{{\rm{onset}}}}} \right)/{\rm{ Time }}\;\left( {\rm{d}} \right)$$
where BWslaughter and BWonset are the mean body weights recorded on two consecutive days just before the slaughter and the onset of the experiment, respectively, with Time being the number of days between the two measurements.
FCE was calculated as:
 $${\rm{FCE }}\;\left( {{\rm{kg}}/{\rm{kg}}} \right) = {\rm{ ADG }}\;\left( {{\rm{kg}}/{\rm{d}}} \right)/{\rm{DM \;intake }}\;\left( {{\rm{kg}}/{\rm{d}}} \right)$$
With ADG and DM intake both individually measured between the onset of the experiment (day 0) and slaughter.
NUE was calculated as:
 $${\rm{NUE }}\;\left( {{\rm{kg}}/{\rm{kg}}} \right) = {\rm{ body\ N\ retention }}\;\left( {{\rm{kg}}} \right)/{\rm{N \;intake }}\;\left( {{\rm{kg}}} \right)$$
where body N retention and N intake represent the amount of N retained and ingested, respectively, between the onset of the experiment and the slaughter. Body N retention was calculated from the estimated body protein retention divided by 6·25.
The Δ15N or isotopic discrimination factor between the animal and the diet was calculated as δ15N of plasma proteins on day 142 (time point at equilibrium) minus δ15N of the diet, the latter was calculated as the average of δ15N of each ingredient weighted by the percentage of N the ingredient represents in the diet.
Power analysis conducted according to Kadam & Bhalerao(Reference Kadam and Bhalerao28) indicated that a minimum of eight animals per treatment were necessary to detect a statistical difference (α = 0·05; β = 0·80) equal to the effect size of Met content on ADG previously reported with similar diets (+14 %(Reference Veira, Seoane and Proulx29)) and given the average and standard deviation values of ADG observed in similar conditions (1·65 (sd 0·16) kg/d, respectively(Reference Meale, Morgavi and Cassar-Malek30)). Therefore, nine animals per treatment were chosen for this study.
Animal was considered the experimental unit. Repeated measures (ultrasound data and plasma metabolites) were analysed by mixed effects models using the nlme package in R software (version 3.0.1.) with animal as a random effect and time, dietary protein content, dietary Met content and their interaction as fixed effects. Non-repeated measures were analysed by ANOVA in R using the lm function with dietary protein content, dietary Met content and their interaction as fixed effects. Significant results were declared when P < 0·05, whereas trends were accepted at P < 0·10. Mean values are reported as least square means with pooled sem values due to missing observations. When the interaction between main effects was significant, the dietary treatment means were compared using Tukey’s honest significant difference multiple comparison. The significance of treatment effect was set at P < 0·05.
Results
From the thirty-six animals starting the experiment, two animals (one fed Normal protein-unbalanced diet and the other fed Normal protein-balanced diet) did not finish the experiment due to health problems unrelated to the experimental treatments.
In vivo performance
As shown in Table 2, average daily gain was improved when dietary protein content increased (+8 %; P = 0·03) or when diets were balanced for Met (+8 %; P = 0·02), with a trend for a greater effect of Met in High v. Normal protein diets (P × M; P = 0·10). Although DM intake remained similar across diets (P > 0·10), N intake was, as expected, higher (+21 %; P < 0·001) with High compared with Normal protein diets. High protein diets tended to promote better FCE compared with Normal protein diets (+6 %; P = 0·06), but this was associated with a worse NUE (−13 %; P = 0·001). Despite a numerical improvement in FCE and NUE when High protein diets were balanced as compared with unbalanced in Met (+8·5 and +5·1 %, respectively), no significant effect of Met-balancing diet on these variables was observed (P = 0·11 and 0·45, respectively). Average fat depth measured at four different anatomical levels by ultrasound was similar across dietary treatments at the start of the experiment (P = 0·22), but was greater for High v. Normal protein diets at the end of the test (P = 0·001). The average gain in fat depth across time, measured as the slope of fat depth on time (n 7), was increased by Met balancing only with High protein diets (P × M; P = 0·01).
Table 2. Animal performance during a 7-month feed efficiency test in young Charolais bulls fed diets formulated at two dietary protein levels (13·5 % crude protein (Normal) v. 16·5 % crude protein (High)) and two dietary methionine (Met) contents (unbalanced v. balanced in Met (+M))
(Mean values and standard errors)

DMI, DM intake; ADG, average daily gain; FCE, feed conversion efficiency; NUE, nitrogen use efficiency.
a,b Mean values within a row with unlike superscript letters are significantly different (P < 0·05).
* Calculated by multiplying the DMI by the dietary N content.
† FCE: 100 × (average daily gain/DMI).
‡ NUE: body N retention/N intake.
§ Average thickness from four different anatomical levels.
║ Gain is calculated as the slope of fat thickness on time (one ultrasound measurement per anatomical level per month; n 21/animal).
Performance at slaughter
Slaughter was conducted at similar average animal age (Table 3) across experimental treatments (P = 0·19), consequently the BW measured at the slaughterhouse followed a similar pattern as the ADG with significant effects of the dietary protein level (+5·0 %; P = 0·001) and Met content (+4·2 %; P = 0·005). Hot and cold carcass weights increased as the dietary protein level increased (+5·5 % on average; P ≤ 0·006) but only numerically as the Met content increased (+3 % on average; P = 0·12). Dressing percentage, carcass conformation and fatness, total internal fat and viscera weight proportions were not affected by dietary treatments (P > 0·10) except for a tendency (P = 0·07) for High protein diets to yield higher conformation scores compared with Normal protein diets. The measured tissue composition of the 6th rib was similar across diets except for a greater fat proportion for bulls fed Met-balanced diets (+15·4 % ; P = 0·02) and for a lower bone proportion as diets changed from Normal to High protein (+1·9 %; P = 0·02).
Table 3. Slaughter measurements and estimated body composition in young Charolais bulls fed diets formulated at two dietary protein levels (13·5 % crude protein (Normal) v. 16·5 % crude protein (High)) and two dietary methionine (Met) contents (unbalanced v. balanced in Met (+M))
(Mean values and standard errors)

BW, body weight; EBW, empty body weight.
* EU Beef Carcass Classification Scheme scale, where 1 represents the poorest and 15 the best conformation.
† EU Beef Carcass Classification Scheme scale, where 1 represents the leanest and 15 the fattest carcass.
‡ After rib dissection 24 h post-slaughter.
§ Cartilage and nerves.
║ Estimated from 6th rib dissection(Reference Robelin and Geay26).
¶ Estimated from total adipose tissue in carcass + total internal fat(Reference Robelin and Geay27).
** Calculated as the difference between the end and start of the feed efficiency test. Composition at the start was estimated from the diameter of subcutaneous adipose cells sampled by biopsy at the start of the experiment test and expressed as % of EBW(Reference Garcia and Agabriel25), whereas composition at the end was estimated from the 6th rib dissection one(Reference Robelin and Geay26,Reference Robelin and Geay27) and expressed as % of EBW.
Carcass total adipose tissue and skeleton weights were increased by dietary Met (+9·3 and 2·9 %, respectively; P ≤ 0·05), in contrast to carcass muscle weight which was unaffected (P = 0·39). Consequently, the proportion of total adipose tissue in carcass increased (+5 percentage units on average; P = 0·03), whereas that of muscle decreased (−0·8 percentage units on average; P = 0·05) when Met was added to diets. Increasing the dietary protein content increased total adipose tissue, muscle and skeleton weights in carcass (P ≤ 0·02) and decreased the proportion of skeleton in carcass (P = 0·05). Increasing dietary protein content increased total body protein, lipid, water and mineral weights (P ≤ 0·03) but not their proportion (P ≥ 0·10). Balancing diets with Met improved total body protein, lipid, water and mineral weights (P ≤ 0·07) and tended to decrease the body proportions of water and mineral (P = 0·09 and 0·07, respectively).
The greater BW gain observed with High v. Normal protein diets (+6 %; P = 0·04) and with Met-balanced v. unbalanced diets (+9 % ; P = 0·005) was the consequence of both greater accretion of both body protein (+5·5 %; P = 0·08) and lipid (+9·8 and +14·5 % for dietary protein and Met content, respectively; P ≤ 0·07) mass. However, the improvement in lipid mass accretion as diets were balanced for Met tended to be greater for High v. Normal protein diets (P × M interaction; P ≤ 0·08).
Plasma metabolites and isotopic nitrogen turnover rate
As shown in Table 4, regardless of the dietary protein level, balancing diets for Met increased concentrations of Asp (P = 0·03), Gln (P = 0·001), Glu (P = 0·05), Met (P < 0·001), Phe (P = 0·07), Tau (P < 0·001) and Tyr (P = 0·006) and decreased those of urea (P = 0·09), Gly (P = 0·04) and Ser (P = 0·001). However, balancing diets for Met increased plasma concentrations of Arg, Asn, His, Ile, Orn, Pro, non-essential AA, essential AA, total AA and Met sulfoxide only at High but not at Normal protein levels (P × M interaction; P < 0·05).
Table 4. Plasma metabolites measured at different time points in young Charolais bulls fed diets formulated at two dietary protein levels (13·5 % crude protein (Normal) v. 16·5 % crude protein (High)) and two dietary methionine (Met) contents (unbalanced v. balanced in Met (+M))
(Mean values and standard errors)
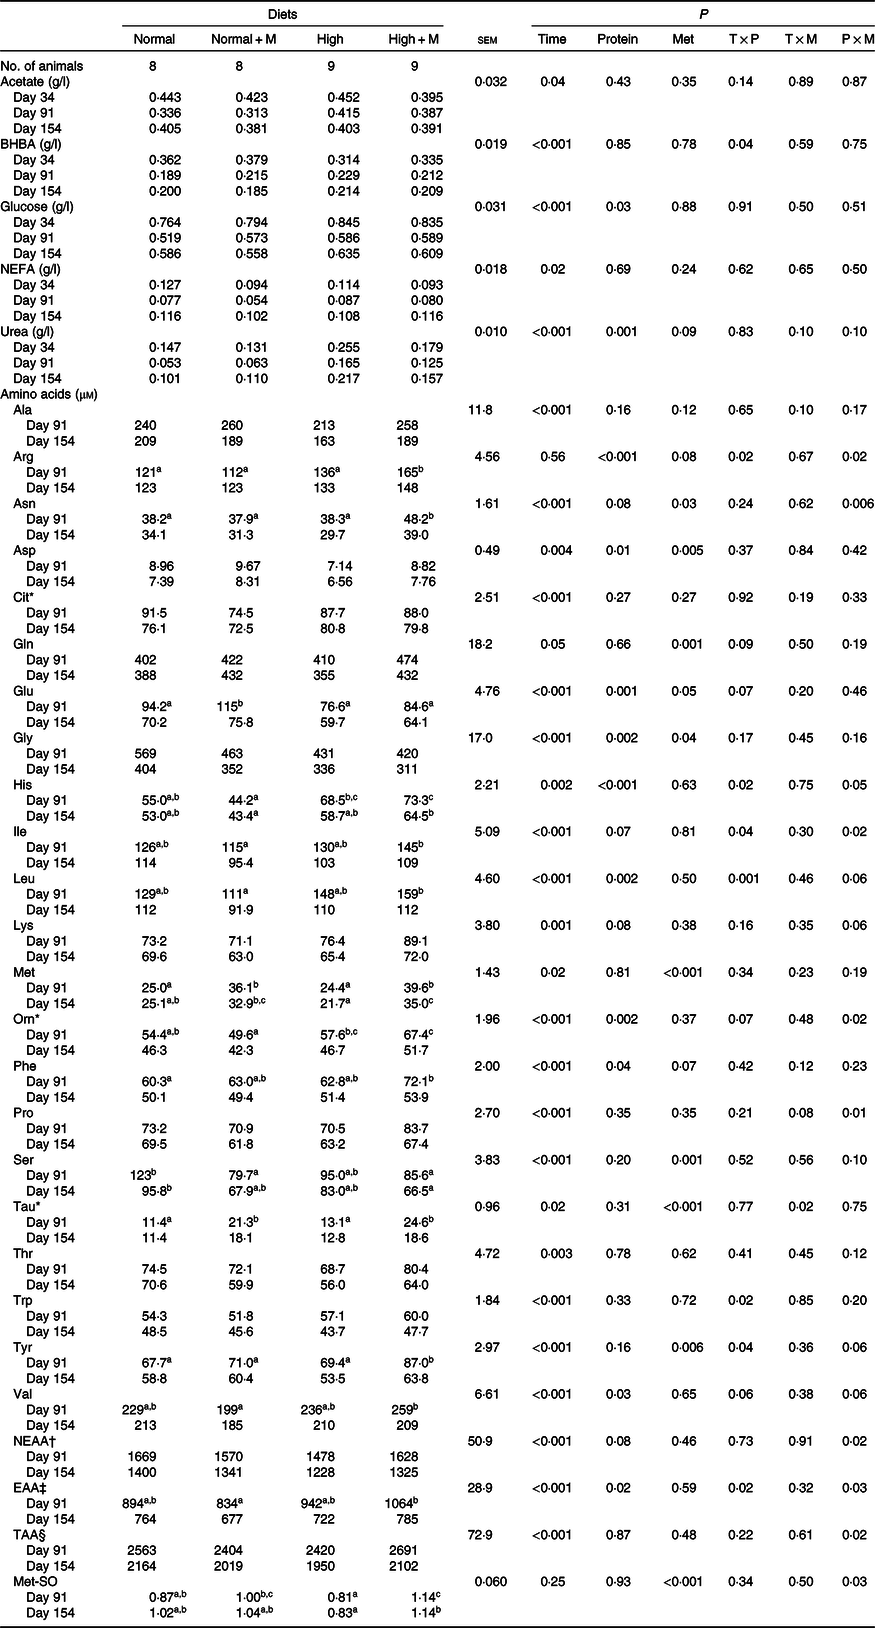
BHBA, β-hydroxy-butyrate; NEAA, non-essential AA; AA, amino acid; EAA, essential AA; TAA, total AA; Met-SO, methionine sulfoxide.
a,b,c Mean values within a row with unlike superscript letters are significantly different (P < 0·05).
* Non-proteinogenic AA.
† NEAA = Ala + Arg + Asn + Asp + Gln + Glu + Gly + Pro + Ser.
‡ EAA = His + Ile + Leu + Lys + Met + Phe + Thr + Trp + Tyr + Val.
§ TAA = NEAA + EAA.
Plasma N isotopic kinetics are presented in Table 5. After stopping the 15N-labelled urea administration (similar amount across dietary treatments), the plasma δ15N values were lower as the dietary protein increased (P = 0·004) and tended to be higher as the diets were balanced v. unbalanced in Met (P = 0·06). Increasing the dietary protein and Met content promoted a greater isotopic N turnover rate (k) measured in plasma proteins (+9 and +4 %, respectively; P ≤ 0·05). At the isotopic equilibrium (142 d after stopping the 15N-labelled urea administration), plasma δ15N values were only affected by the dietary protein content, being lower in High v. Normal diets (P = 0·01). The difference in δ15N values between plasma proteins at equilibrium and the diet (called isotopic N discrimination; Δ15Nanimal-diet) tended to be higher as the dietary protein content increased (P = 0·06) but did not differ between diets balanced and unbalanced for Met (P > 0·10).
Table 5. Isotopic 15N kinetics in plasma proteins from young Charolais bulls fed diets formulated at two dietary protein levels (13·5 % crude protein (Normal) v. 16·5 % crude protein (High) and two dietary methionine (Met) contents (unbalanced v. balanced through the use of supplemental rumen-protected Met (+M))
(Mean values and standard errors)

Discussion
In vivo performance
As observed in the present experiment, the addition of rumen-protected Met to diets meeting or exceeding theoretical animal metabolisable protein requirements may still improve growth performance providing the dietary metabolisable protein is deficient in this particular AA(Reference Klemesrud, Klopfenstein and Lewis31). Rumen microbial protein contains low Met levels (Lys:Met ratio close to 3·5(Reference Sok, Ouellet and Firkins32)) in relation to animal requirements (Lys:Met ratio close to 2·9 for dairy cattle(7)). Thus, Met has been proposed to be the first-limiting AA for ruminants fed protein mainly from the microbial origin(Reference Richardson and Hatfield5,Reference Storm and Orskov33) and is the main limiting AA in growing beef cattle fed high-forage diets(Reference Nimrick, Hatfield and Kaminski8,Reference Titgemeyer and Merchen9) .
Growth responses to Met supplementation have not been consistent across studies(Reference Veira, Seoane and Proulx29,Reference Hussein and Berger34,Reference Tripp, Hoagland and Dahl35) . Discrepancies seem to stem from differences in the quality of the basal diet (high v. low in rumen degradable protein(Reference Hussein and Berger34)) and the AA profile of rumen bypass protein(Reference Merchen and Titgemeyer36) used to complement the diet when the microbial protein supply does not meet animals’ AA requirements. According to our feed values, the two grass-silage basal diets used in this study were deficient in Met in regard to recommendations for lactating dairy cows (Lys:Met ratio close to 3·5 v. 2·9 %(7)). This, together with the fact that we used animals with a high growth potential (ADG > 1·6 kg/d on average), should have favoured the response to Met supplementation. In such conditions, our results showed that Met-balanced diets promoted a greater BW gain compared with Met-unbalanced diets, supporting the concept of Met limiting or co-limiting the productivity of cattle fed grass silage diets(Reference Veira, Seoane and Proulx29). However, this improvement in animal performance tended to be greater with High (+14 %) v. Normal (+2 %) protein diets, rejecting our initial hypothesis. Indeed, our results confirm previous findings showing a synergy between rumen-protected Met and protein supplements supplying large amounts of essential AA but low levels of Met as blood or meat meal(Reference Klemesrud, Klopfenstein and Lewis31,Reference Titgemeyer, Merchen and Berger37) . In the present study, the increase in dietary protein content was achieved mostly by the substitution of wheat grains by formaldehyde-treated soyabean meal (Table 1). Formaldehyde-treated soyabean meal supplies relatively high amounts of rumen bypass protein (as revealed by the lower enzymatic CP degradability (parameter allowing to estimate the rumen protein degradation in the INRA feeding system(7)) in High v. Normal protein diets; Table 1), but it is known to have a very low content of sulfur AA(Reference Erasmus, Botha and Cruywagen38). Therefore, our data confirm that the growth response to Met supplementation may be improved when a basal diet containing low rumen bypass protein (2 % DM basis in the present study) is supplemented with rumen bypass protein containing low Met content(Reference Titgemeyer and Merchen9). Interestingly, similar to our results, a recent meta-analysis using thirty-five studies with dairy cattle found that the milk yield response to rumen-protected Met was surprisingly higher in animals with no predicted AA deficiency (positive metabolisable protein balance) compared with those with a predicted Met deficiency(Reference Patton39). Alternatively, results from the present study may suggest that INRA protein recommendation could underestimate protein requirements in fast growing cattle or overestimate the metabolisable protein supplied by high-forage diets. If so, this would mean that co-limiting AA other than Met could be present in our Normal protein diet but not in our High protein diet.
Greater BW and protein gains observed when High protein diets were balanced v. unbalanced in Met (+9·0 and +5·5 %, respectively; Table 3) seemed to be the consequence of both a greater, but not significant, feed intake (+4 %) and FCE (+8 %). Improvements in DM intake with Met supplementation have been documented in other ruminant studies(Reference Mata, Masters and Chamberlain40–Reference Broderick, Stevenson and Patton42) and confirmed through meta-analysis when Met is provided as Smartamine M(Reference Zanton, Bowman and Vázquez-Añón43) as in the present experiment. Although the underlying mechanism is not completely understood, higher energy requirements associated with greater growth rates could explain to some extent this finding. The higher FCE could be driven by a higher efficiency of N retention in ruminants receiving diets supplemented with Met(Reference Matras, Preston and Bartle44–Reference Chen, Broderick and Luchini46). The overall NUE for the whole experimental period only increased by <5 % between balanced and unbalanced Met diets at high protein levels. However, it should be noted that NUE calculations in the present study were based on estimations of body composition mostly from the 6th rib composition(Reference Robelin and Geay26,Reference Robelin and Geay27) rather than direct measurement. To overcome this limitation other indicators were analysed and, as further discussed here, they also pointed to a moderate NUE improvement when High protein diets were balanced in Met.
Although a positive impact of supplying limiting AA on performance of growing-fattening cattle has been reported in several studies(Reference Wessels, Titgemeyer and St. Jean12,Reference Klemesrud, Klopfenstein and Lewis31,Reference Montaño, Chirino and Latack47) , the concept of supplying limiting AA to growing-fattening cattle is rarely applied in the beef industry. Our results confirm the necessity of evaluating by dose–response studies the requirements of Met for fattening young bulls with a high growth potential to extend the concept of limiting AA, which is very developed and used in swine and dairy cattle nutrition, to growing ruminants mainly fed high-forage diets. In addition, a cost–benefit analysis should be performed in the future to determine whether use of ruminally protected AA could translate into a greater farm profitability.
Performance at slaughter
The lack of significant effects of balancing diets for Met on carcass weights (+3 % on average), although significantly affecting the BW at slaughter (+4 % on average), could be partially explained by the slightly higher intake promoted by the Met-supplemented diets. Indeed, the measured digestive content of animals receiving Met-balanced diets was higher than those with Met-unbalanced diets (+10 %; P = 0·02; data not shown). Moreover, this study was designed to determine the effect of Met-balanced diets on growth performance. Given the observed effect size of Met on carcass weight (11 kg) and a sd of 22·8 kg, sixty-eight animals (seventeen animals/treatment) would be needed to detect a significant difference (α = 0·05; β = 0·80) in that variable. Unfortunately, there is a lack in the literature of cattle studies evaluating the effect of rumen-protected Met on animal performance at the slaughterhouse. Measured fat proportion from the 6th rib and the resulting estimated lipid body gain confirmed in vivo ultrasound back depth results showing a greater fat deposition when Met-balanced diets were formulated at High protein levels. Increasing fat deposition in response to Met supplementation has also been reported in sheep(Reference Mata, Masters and Chamberlain40). However, an opposite effect was also found in growing lambs(Reference Wiese, White and Masters41) in agreement with different studies in poultry(Reference Rostagno and Pack48,Reference Zhan, Li and Xu49) suggesting that higher hepatic concentration of carnitine, synthesised from Met and Lys, can facilitate fatty acid oxidation in the liver. Some unknown interfering factors related to diets or animal physiological state could explain contradictory results. In the present study, changes in fat deposition with Met supplementation could be the consequence of a concomitant increase in BW gain because the amount of lipid deposited daily is proportional to the average daily gain raised to the power of 1·8(7). However, because animals were not slaughtered at a fixed BW, it is not possible in our conditions to dissociate a greater body lipid content from a greater BW. Thus, greater animal growth rates likely led to a lower protein:fat ratio in the body gain. In this sense, our results confirm previous findings in growing ruminants reporting lower muscle proportion in carcasses with Met-balanced (Lys/Met = 3·0) v. unbalanced (Lys/Met = 3·4) diets(Reference Prado, Campo and Muela50).
Nitrogen metabolism
The increase observed in plasma Met concentration (+50 %) when diets were supplemented with Met agrees with previous studies(Reference Veira, Seoane and Proulx29,Reference Lee, Hristov and Cassidy51,Reference Torrentera, Carrasco and Salinas-Chavira52) and confirms that metabolisable Met supply was improved when high-forage diets were supplemented with rumen-protected Met. This increase was accompanied by concomitant greater plasma concentrations of other metabolites resulting from Met metabolism. Taurine, derived from cysteine following Met catabolism through the trans-sulfuration pathway, increased after Met supplementation in agreement with other ruminant studies(Reference Lynch, Elsasser and Jackson53,Reference Blum, Bruckmaier and Jans54) . Moreover, two other AA metabolically linked to Met utilisation, Gly and Ser, decreased their plasma concentrations in Met-balanced diets. Indeed, lower Gly and Ser plasma concentrations can be explained by their role in the conversion of Met to homocysteine and further to cysteine during trans-sulfuration reactions(Reference Campbell, Titgemeyer and St-Jean55). Finally, higher plasma Met sulfoxide, a major product of both free and protein-bound Met oxidation by reactive oxygen and nitrogen species(Reference Lee and Gladyshev56), may reflect a higher availability of Met in our Met-balanced diets. Alternatively, all these data could indicate that the optimum level of Met supplementation was exceeded with our Met-balanced diets, in agreement with our estimated dietary metabolisable Met concentration exceeding the theoretical dairy cow requirement (2·6 % of metabolisable protein on average v. 2·4 % of metabolisable protein; Table 1). However, without a dose–response study, it is quite speculative to conclude that the optimum level of Met has been exceeded in our conditions and more research is warranted to establish the optimum level of Met supply for growing beef cattle.
Decreased plasma concentrations of branched-chain AA (Ile, Leu and Val), the most abundant AA in muscle, are often reported in the literature when cattle are supplemented with Met(Reference Blum, Bruckmaier and Jans54,Reference Campbell, Titgemeyer and St-Jean55) . Although this is usually explained by greater AA utilisation when protein synthesis is improved after removing the Met deficiency, the catabolism of branched-chain AA could also be enhanced by excess Met(Reference Blum, Bruckmaier and Jans54). Unexpectedly, an interaction between the dietary protein and Met content was noted for the three branched-chain AA (Ile, Leu and Val; P ≤ 0·06), indicating lower plasma concentration when Met supplementation was applied to Normal protein diets (−14 % on average) but higher (or similar) when applied to High protein diets (+6 % on average). A similar pattern, although non-significant, was also observed with lactating ewes fed rumen-protected Met and Lys at two protein levels(Reference Lynch, Elsasser and Jackson53). Moreover, the same interaction between dietary protein and Met content was also observed for many other AA such as Arg, Asn, His, Orn, Pro and non-essential AA, essential AA and total AA, likely suggesting that metabolisable protein supply could be somehow deficient in our Normal protein diets, thereby limiting the potential response of supplementary Met. This last point is in agreement with the fact that the improvement of animal performance in Met-balanced diet was lower in Normal v. High protein diets. Based on plasma AA profile, it can be concluded that: (i) Metabolisable Met supply was greatly increased when animals were fed diets supplemented with rumen-protected Met, likely enhancing the plasma pool of sulphur compounds, (ii) Normal protein diets without Met balancing were limited by Met supply but thereafter co-limited by other essential AA, suggesting a metabolisable protein supply slightly under requirements, and (iii) High protein diets without Met balancing were only limited by Met supply. These conclusions based on plasma AA profile are in agreement with the observed trend for a greater effect of Met balancing on growth performance in High v. Normal protein diets.
We observed on average (from three analysed time points) a trend for Met-balanced diets to have lower urea plasma levels, with the decrease being more pronounced in High protein diets (−34 % on average), and this was consistent over time. This would suggest a more efficient use of feed N when Met-balanced diets were formulated at High protein levels(Reference Kohn, Dinneen and Russek-Cohen57). Lower plasma or blood urea concentrations have been reported when diets were supplemented with rumen-protected Met(Reference Blum, Bruckmaier and Jans54,Reference Williams, Newell and Hess58,Reference Bach, Huntington and Stern59) , but other studies failed to observe any difference(Reference Archibeque, Burns and Huntington45,Reference Waggoner, Loest and Mathis60) .
Results from the minimally invasive approach here tested for measuring the isotopic turnover rate in animal proteins indicate a higher fractional synthesis rate of plasma proteins (plasma k value; Table 5) in Met-balanced diets regardless of the dietary protein content. The rate at which animal proteins incorporate a new dietary isotopic signature depends on both the metabolic tissue replacement and growth(Reference MacAvoy, Macko and Arneson61) and has been demonstrated by mechanistic models(Reference Martínez del Rio and Carleton62,Reference Poupin, Huneau and Mariotti63) to reflect changes in the fractional protein synthesis rate of that particular pool. Although we should be careful with interpretations based on this new proxy(Reference Cantalapiedra-Hijar, Fouillet and Chantelauze17) and when extrapolating results from plasma protein to whole-body proteins, this may indicate that protein synthesis is enhanced in Met-balanced diets and perhaps contributing to the higher N retention. Interestingly, the plasma initial 15N values just after stopping the 15N–urea administration (day 0) tended to be higher in Met-balanced (15·7‰ on average) v. unbalanced (15·1‰ on average) diets. This finding agrees with a higher fractional synthesis rate of plasma proteins since greater initial isotopic values before the 15N depletion indicate that the rate at which the 15N-AA from labelled microbial protein are assimilated by animal proteins were higher with Met-balanced diets. The same rationale does not apply however when comparing Normal v. High protein diets. While a higher fractional synthesis rate (plasma k value) was observed with High protein diets, the greater (unlabelled) N intake associated with High protein diets also promoted a greater dilution of the 15N-labelled urea and thus lower plasma initial 15N values. Wessels et al. (Reference Wessels, Titgemeyer and St. Jean12), applying a different isotopic method, also found that protein synthesis tended to increase in response to supplementation with limiting AA.
Assuming that our plasma 15N values after 106 d are at the isotopic equilibrium(Reference Cantalapiedra-Hijar, Fouillet and Huneau64), the asymptotic plasma 15N values can be considered close to the natural 15N abundance in animal proteins. The difference in the natural 15N abundance between the animal proteins and the consumed diet (Δ15Nanimal-diet) has been proposed as a biomarker of NUE, with lower values generally observed in more efficient animals(Reference Cantalapiedra-Hijar, Dewhurst and Cheng65). Although no significant effects of dietary Met content were found, a numerically lower (−6 %) Δ15Nanimal-diet was noted for the unbalanced v. balanced High protein diet, indicating a lower NUE(Reference Cantalapiedra-Hijar, Ortigues-Marty and Sepchat18). When taken together, NUE, plasma urea concentration, N isotopic turnover in plasma proteins and Δ15Nanimal-diet suggest a slightly better use of AA in Met-balanced diets, especially at High protein levels.
Conclusions
Like in other livestock animals, the principle of a specific AA limiting the animal productivity also applies to growing beef cattle. Balancing high-forage diets for Met supply improved growth rate in fast-growing Charolais bulls, with a greater effect when diets were formulated at High v. Normal protein content. Metabolic changes, such as a better plasma AA profile and some indicators suggesting a greater NUE and N retention, were observed when diets were balanced for Met. Our results justify the need for integrating AA recommendations in growing ruminants. Further studies should confirm the interaction between the dietary metabolisable protein and Met content and establish the optimum predicted concentrations of Met in metabolisable protein when growing cattle are fed different types of diets.
Acknowledgements
The authors would like to thank Vincent Largeau, Céline Chantelauze and the staff of Herbipôle for their great technical assistance during this study.
Adisseo is acknowledged for financially supporting this study.
The authors’ contributions are as follows: G. C.-H. and L. B. formulated the research question and with I. O.-M. and E. T. designed the experimental protocol. In vivo data were analysed by B. S. with G. C.-H. and L. B. All the statistical analysis were performed by G. C.-H. While the interpretation of results were conducted by G. C.-H., I. O.-M. and L. B. All authors were involved in the preparation of the manuscript and approved the final manuscript. G. C.-H. had primary responsibility for the final content.
L. B. is employed by Adisseo France SAS which commercialises Smartamine® used in this experiment. The remaining authors declare that the research was conducted in the absence of any commercial or financial relationship that could be construed as a potential conflict of interest.


