


Processed food products are a major source of Na in common diets and the increased consumption of these products has become a public health problem due to their high Na content( 1 – Reference Anderson, Appel and Okuda 8 ), which is related to increased risk of developing chronic non-communicable diseases( 6 ).
Among processed foods, pre-prepared meals and prepared ingredients (classified by Monteiro et al.( Reference Monteiro, Levy-Costa and Claro 9 ) as processed and ultra-processed food products) are higher in Na compared with fresh foods( Reference Monteiro, Levy-Costa and Claro 10 ). In the USA, mixed dishes constitute 23 % of the population’s total Na intake( Reference Hoy, Goldman and Murayi 11 ). In Brazil, an increase in processed food purchases was observed between 1974 and 2008, amounting to 37 % for prepared foods and processed mixtures, 80 % for pre-prepared meals and 300 % for sausages( 12 , Reference Levy-Costa, Sichieri and Pontes 13 ).
For Brazilians, these types of food product are increasingly being incorporated into everyday meals, including lunch and dinner, replacing and/or complementing their basic diet, which is characterized by rice, beans, meat and salad( Reference Maciel 14 – 16 ). The average Brazilian consumes 3200 mg Na/d, which is higher than the maximum intake recommended by the WHO and the FAO( 5 , 17 ).
Faced with increasing salt and Na consumption among their populations( Reference Brown, Tzoulaki and Candeias 3 ), countries around the world are taking measures to reduce the intake of this nutrient. In this context, food labelling has been used as an important strategy to inform consumers and restrict Na intake( Reference Webster, Dunford and Hawkes 18 ).
Labelling is recommended in the WHO Global Strategy on Diet, Physical Activity and Health( 19 ) as a tool to support food choices at the time of purchase, and in order to fulfil its role the presentation of mandatory information on labels must be clear, legible, standardized and easily comprehensible for consumers( 20 ).
In Brazil, nutrition labelling on packaged foods and drinks (including information about Na) has been mandatory since 2001( 21 ). This information must be described in milligrams per serving, with the percentage daily value (%DV) calculated according to an average of 2400 mg Na/d. Values less than 5 mg Na/100 g food are considered insignificant amounts, i.e. ‘zero sodium’( 22 , 23 ). It is also mandatory to present a list of ingredients in descending order according to the proportions used, and food additives must be described directly after the foods( 24 ). Thus, the Brazilian Dietary Guidelines recommend checking the position of salt in the ingredients list on processed foods to inform about salt content( Reference Brasil 25 ), since the product could potentially have a high concentration of this substance when it appears as one of the first ingredients( Reference Brasil 25 – Reference Han 27 ).
Although labelling is an important tool for reducing the population’s Na intake( Reference Webster, Dunford and Hawkes 18 , Reference Pietinen, Valsta and Hirvonen 28 ), it has hardly been explored scientifically in Brazil. The high Na content and high variability among similar products sold in supermarkets has long been recognized( Reference Anderson, Appel and Okuda 8 , Reference Webster, Dunford and Neal 29 , Reference Ni Murchu, Capelin and Dunford 30 ). Knowing these contents (and their variations) is important for defining public policy, as exemplified by successful initiatives for reformulation aimed at reducing the Na content in food products marketed in several countries( Reference Webster, Dunford and Hawkes 18 ,28, Reference van Raaij, Hendriksen and Verhagen 31 , Reference Vyth, Steenhuis and Roodenburg 32 ). However, there is currently no good scientific evidence on the Na content (and its variation) in processed foods marketed in Brazil. Given that pre-prepared meals and prepared ingredients contribute to increased Na intake by the population( Reference Hoy, Goldman and Murayi 11 ,28– Reference Ni Murchu, Capelin and Dunford 30 ) and that an increase in the purchase of these products by the Brazilian population has been observed( Reference Monteiro, Levy-Costa and Claro 10 , 12 , 16 ), the present study analysed the labelling and Na content of processed and ultra-processed pre-prepared meals and prepared ingredients marketed in Brazil and used in main meals, specifically lunch or dinner.
Methods
Data collection
The present study was cross-sectional in design and evaluated Na labelling of processed food products sold in a supermarket in the city of Florianopolis, southern Brazil. The supermarket was chosen intentionally and belongs to one of the ten largest supermarket chains in Brazil( 33 ), with twenty-six stores in the southern region of Brazil, six of which are located in Florianopolis. The products sold in this store are similar to those sold in other large supermarket chains throughout the country. The data were collected from October to December 2011. The supermarket manager authorized the research.
Collection of label information was carried out with a pre-tested instrument for the following analysis variables: (i) product identification; (ii) ingredients list (appearance and position of salt on the list, compound ingredients and Na-containing food additives appearing on the list); and (iii) Na information (Na in the nutritional information, serving size in grams and Na content in milligrams per serving). For the purpose of the study a compound ingredient was defined as any ingredient included on the list that is composed of two or more ingredients( 24 ). Food additives containing Na were identified using the specific Brazilian resolution for food additives( 34 ) and Mercosul’s Harmonized General List of Food Additives and Their Functional Classes( 35 ).
The data collection team received training and participated in the instrument’s pilot test. For quality control, information on two key questions (Na content in milligrams per serving and position of first appearance of salt on the ingredients list) was collected twice for 3·2 % of the foods analysed (n 44). According to the Bland–Altman test, the difference in means for the variable ‘Na content in milligrams per serving’ was 0·05 mg (interval of ± 2 sd of −0·5 and 0·6), while the κ value for the variable ‘position of the first appearance of salt on the ingredients list’ was 1·00.
Inclusion criteria for food products in the study
The study included all those food products covered under Brazilian nutrition labelling legislation( 23 ) which have the following characteristics: (i) appearance of Na on the ingredients list; (ii) classified as processed or ultra-processed food products; (iii) pre-prepared meal or prepared ingredients; and (iv) habitually used by the Brazilian population in lunch and dinner meals( 5 , Reference Maciel 14 , Reference Barbosa 15 , Reference Galeazzi, Domene and Sichieri 36 – Reference Souza, Pereira and Yokoo 38 ).
To assess the true variability in Na content for each type of specific product, products that did not include Na among their ingredients were only included in the sample when other products with similar characteristics contained this ingredient. Information on the packaging of identical products of different sizes was recorded separately because their ingredients lists also differed. Products habitually used by the Brazilian population in lunch and dinner meals were defined based on Brazilian literature( 5 , Reference Maciel 14 , Reference Barbosa 15 , Reference Galeazzi, Domene and Sichieri 36 – Reference Souza, Pereira and Yokoo 38 ). Bread was not included in the analyses, as Brazilians do not customarily eat these products in the meals studied. We also excluded products that were fractionated, labelled and marketed by the supermarket itself, since such products are not required to be labelled in Brazil( 23 ).
Statistical treatment and analysis of data
The collected data were entered into two separate databases and later checked for errors and validated in EpiData® 3·1 (EpiData Association, Odense, Denmark). The products were distributed into seven groups and forty-one subgroups predefined by Brazilian nutrition labelling legislation to describe serving sizes for packaged foods( 22 ). Since no product analysed in the present study was part of Group VII of this legislation (Group VII: Sugar and products that provide energy from carbohydrates and fats), this group is not reported in the analyses. A quantity equivalence of Na in milligrams per 100 g or 100 ml of food was determined for all the products based on serving size information. Na content in milligrams per 100 g or 100 ml of food was classified as high content (>600 mg Na), medium content (>120 and ≤600 mg Na) and low content (≤120 mg Na), according to the Traffic Light Labels of the UK Food Standards Agency( 39 ). The first appearance of salt on the ingredients list was treated as a dichotomous variable (first to third position; fourth position or more).
We conducted a descriptive statistical analysis, presenting absolute and relative frequency, median Na content, percentiles and relationships between subgroup percentiles. Data dispersion was presented in the 2nd and 98th percentiles (P2–P98) due to the asymmetry of the variable ‘Na content in milligrams per 100 g or 100 ml of food’ and to have an overview of information variability without having the products with extreme values (n 55) influence the results. This interval therefore represents the dispersion of 96 % of the food products. The ratio between the 98th and 2nd percentiles was assessed based on these values, with the aim of establishing the differences in Na content between similar products. In order to facilitate calculation of the P98/P2 ratio for products containing 0 mg Na/100 g, the value of 5 mg Na/100 g was used, which is an amount defined as insignificant by Brazilian nutrition labelling legislation( 23 ).
A χ 2 test was used to assess the association between product Na content and the first appearance of salt on the ingredients list. Due to infeasibility for inclusion in this analysis, the following products were excluded from this analysis: (i) those that included salt as their main ingredient (complete seasonings and those prepared for broth, n 103), since none of these products would be consumed directly, affecting interpretation of the data; (ii) those that did not include salt on the ingredients list (n 100); and (iii) those that did not have Na information on the nutrition label (n 5).
The statistical software package Stata® version 11·0 was used for the statistical analyses, with P<0·05 considered indicative of statistical significance.
Results
Of the 4538 Na-containing processed food products available for sale at the supermarket, 1416 were classed as processed and ultra-processed pre-prepared meals and prepared ingredients used for lunch and dinner. Therefore, the present study analysed 1416 products by 211 different manufacturers – 87·6 % of the products having been produced in Brazil. The other products were from Argentina (n 35), Italy (n 27), Spain (n 24), Germany (n 22), the USA (n 21), Peru (n 10), Uruguay (n 7), Belgium (n 5), Chile (n 5), France (n 5), China (n 4), Mexico (n 4), Poland (n 3), Portugal (n 2) and Ecuador (n 1).
Nutritional information
Of the products analysed, five (0·4 %) did not include Na information on the nutrition label. The remaining 1411 products were distributed into seven groups and forty-one subgroups.
Classification of Na content (mg/100 g or 100 ml) according to the UK Food Standards Agency
Of all the products with Na nutrition information (n 1411), 58·8 % (95 % CI 55·4, 62·2 %) were classified as having a high Na content (>600 mg/100 g or 100 ml) and 7·0 % (95 % CI 2·9, 14·2 %) were classified as having low Na content (≤120 mg/100 g or 100 ml)( 39 ). In the Na content classification by food group, the majority of products included in groups VI (98·4 %), V (70·0 %), I (64·7 %), VIII (61·7 %) and IV (52·0 %) had high Na content per 100 g or 100 ml (Fig. 1).
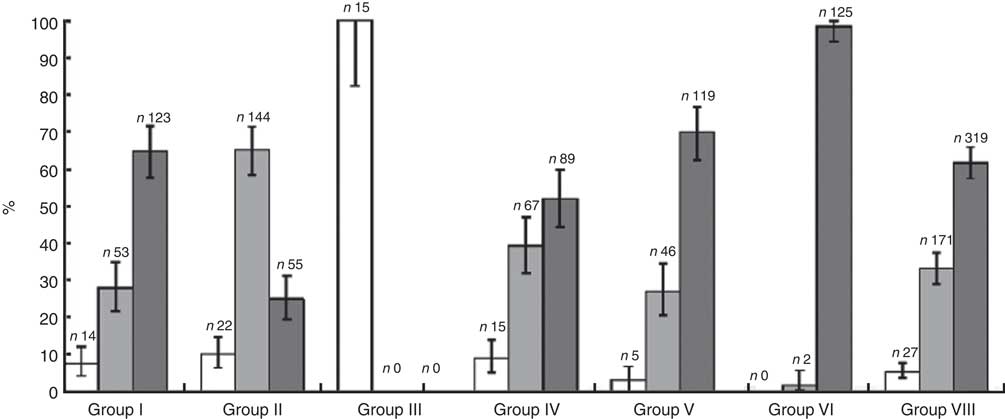
Fig. 1 Classification of groups of processed and ultra-processed pre-prepared meals and prepared ingredients marketed in Brazil, used in lunch or dinner, by sodium content (![]() , low (≤120 mg/100 g or 100 ml);
, low (≤120 mg/100 g or 100 ml); ![]() , medium (>120 and ≤600 mg/100 g or 100 ml);
, medium (>120 and ≤600 mg/100 g or 100 ml); ![]() , high (>600 mg/100 g or 100 ml)) according to the Traffic Light Labels of the Food Standards Agency, UK(
39
) (n 1411). Values are percentages with their 95 % confidence intervals represented by vertical bars. Group I=Bread products, cereals, legumes, roots, tubers and their derivatives; Group II=Fresh and canned vegetables; Group III=Fruits, juices, nectars and fruit drinks; Group IV=Milk and derivatives; Group V=Meat and eggs; Group VI=Oils, fats and seeds; Group VIII=Sauces, ready-made seasonings, broths, soups and prepared dishes. No product analysed in the study was part of Group VII of the Brazilian nutrition labelling legislation to describe serving sizes for packaged foods(
22
), so this group is not reported in the analyses
, high (>600 mg/100 g or 100 ml)) according to the Traffic Light Labels of the Food Standards Agency, UK(
39
) (n 1411). Values are percentages with their 95 % confidence intervals represented by vertical bars. Group I=Bread products, cereals, legumes, roots, tubers and their derivatives; Group II=Fresh and canned vegetables; Group III=Fruits, juices, nectars and fruit drinks; Group IV=Milk and derivatives; Group V=Meat and eggs; Group VI=Oils, fats and seeds; Group VIII=Sauces, ready-made seasonings, broths, soups and prepared dishes. No product analysed in the study was part of Group VII of the Brazilian nutrition labelling legislation to describe serving sizes for packaged foods(
22
), so this group is not reported in the analyses
Na content v. first appearance of salt on ingredients list
Figure 2 presents the analysis of Na content in the nutritional information (classified according to the UK Food Standards Agency( 39 )) and the position in which salt appears in the studied products’ ingredients lists.
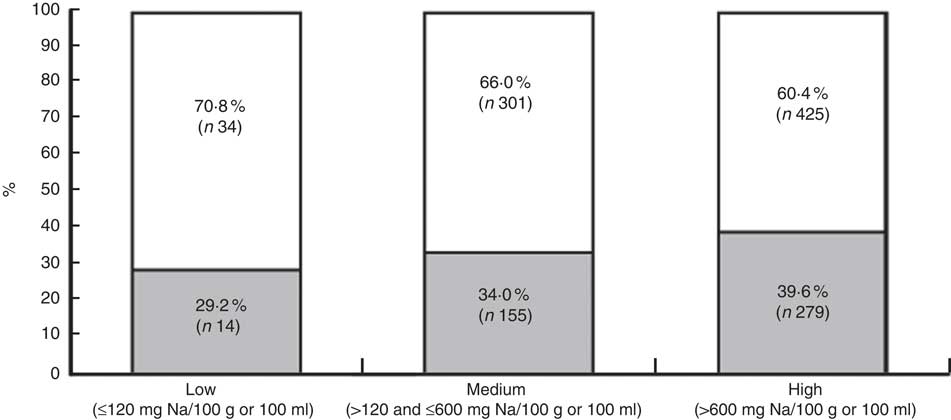
Fig. 2 Association between the first appearance of salt on the ingredients list* (![]() , first to third position;
, first to third position; ![]() , fourth position or more) and the sodium content of processed and ultra-processed pre-prepared meals and prepared ingredients marketed in Brazil, used in lunch or dinner, according to the Traffic Light Labels of the Food Standards Agency, UK(
39
) (n 1208). *Excluded products included complete seasonings and those prepared for broth, products belonging to the broth concentrate and soup powder subgroup
, fourth position or more) and the sodium content of processed and ultra-processed pre-prepared meals and prepared ingredients marketed in Brazil, used in lunch or dinner, according to the Traffic Light Labels of the Food Standards Agency, UK(
39
) (n 1208). *Excluded products included complete seasonings and those prepared for broth, products belonging to the broth concentrate and soup powder subgroup
Regarding the position in which salt first appears on the ingredients list, of the 1208 products analysed, 37·1 % (95 % CI 32·6, 41·7 %) listed salt between the first and third positions. There was no difference in this percentage when compared among products of low, medium or high Na content (P=0·08). Other cut-off points for the position of salt were used, but the percentages among the three Na content categories remained similar in all cases.
Na content by food product group and subgroup
Based on Na information, we defined median Na content by food group and subgroup, the P2–P98 for each subgroup, as well as the relationship between these percentiles (Table 1).
Table 1 Sodium content (mg/100 g or 100 ml) and sodium content classification by group and subgroup of processed and ultra-processed pre-prepared meals and prepared ingredients food products marketed in Brazil, used in lunch or dinner (n 1411)

*Food product groups and subgroups according to RDC no. 359/2003( 22 ).
†Na in mg/100 g or mg/100 ml.
‡Median Na content classified according to the Traffic Light Labels of the Food Standards Agency, UK( 39 ).
§To facilitate calculation, in the cases in which the minimum value is zero, the minimum value was considered=5 mg Na/100 g, according to RDC no. 360/2003( 23 ).
A large variation in Na content within different subgroups was found. In almost half of the subgroups (44 %) the highest-Na product had an Na concentration at least ten times higher than the product with the lowest Na, and in about 17 % of the subgroups analysed the differences were even more extreme (about fifty times higher or more). This wide variation occurred in subgroups classified as high, medium and low in Na.
Ingredients list
Food products with added Na
On the ingredients lists, fourteen different nomenclatures for salt were found: salt, sodium chloride, refined salt, refined iodized salt, iodized salt, marine salt, sea salt, reduced-sodium salt, hyposodic salt, coarse salt, special coarse salt, iodized coarse salt, cured salt and low salt. Of the 1543 citations found, salt was the most common (86·3 %; 95 % CI 84·3, 88·1 %). In 347 citations, salt composed part of twenty-seven different types of compound ingredients, including sauces, condiments/seasonings, pasta, cheeses, cheese-based preparations, meats, meat-based products, filling, bread, flour, pepper-based preparations, flavour enhancers, antioxidants, brine and artificial colouring.
Of all products analysed, 14·7 % (95 % CI 10·4, 20·5 %) had at least one compound ingredient recognized for containing salt in its composition (cheeses, condiments/prepared broths, seasonings in flavoured powders, sauces and others) without describing the composition of these ingredients separately. The presence of compound ingredients with this characteristic was also observed in 81·2 % (95 % CI 71·5, 90·7 %) of the sixty-nine studied products (4·9 %) for which no citation of salt or Na-containing food additive was found on the ingredients list.
Food additives containing Na
Similarly, we studied Na-containing food additives cited on the ingredients lists (Table 2).
Table 2 Food additives containing sodium cited on the ingredients lists of processed and ultra-processed pre-prepared meals and prepared ingredients marketed in Brazil, used in lunch or dinner meals, along with their citation frequency and respective International Numbering System (INS)( 34 , 35 ) (n 1416)

* Does not appear on Mercosul’s list of food additives( 35 ).
We found thirty-four different types of Na-containing food additives, resulting in 1764 citations on the ingredients lists of the products analysed. Of these, 52·0 % (95 % CI 48·2, 55·6 %) contained at least one type of Na-containing food additive and the maximum number of Na-containing additives per product was eight (n 2). Sodium caseinate and emulsifying salts were considered additives despite their absence from the International Numbering System because they are additive mixtures. Fourteen products (1·0 %) had incomplete food additive descriptions, precluding the inclusion of these data in the total accounting of food additive citations.
Discussion
The present study analysed Na labelling on processed and ultra-processed pre-prepared meals and prepared ingredients marketed in Brazil, used in lunch or dinner. Approximately 60 % of the products analysed had high Na content (>600 mg/100 g) and this high content occurred in practically all food product groups, especially those in group VIII: complete seasonings (18 700 mg Na/100 g), broths and soup powders (4500 mg Na/100 g) and powders for sauce preparation (4442 mg Na/100 g).
Studies conducted in other countries have also found high Na content in processed food products. In Canada, 17 % of the 364 products with Na information analysed had high Na content( Reference Elliott 40 ). In the UK, the highest mean Na content was found in broths and sauces (1090 mg/100 g)( Reference Ni Murchu, Capelin and Dunford 30 ). In Australia the mean Na content of broths was 6108 mg/100 g( Reference Webster, Dunford and Neal 29 ). Another Australian study( Reference Grimes, Campbell and Riddell 41 ) observed high mean Na content in broths (16920 mg/100 g) and soup powders (1882 mg/100 g). In a New Zealand study, the highest mean Na content was found in Asian sauces (5141 mg/100 g), mustard (1779 mg/100 g) and hot sauces (1549 mg/100 g)( Reference Woodward, Eyles and Ni Murchu 42 ).
Despite having some of the highest mean Na levels in the present study and being constituted basically of salt, complete seasonings and broths are not consumed in large amounts within a single meal. Nevertheless, these products are among the main Na sources in the Brazilian diet( Reference Sarno, Claro and Levy-Costa 2 ). Furthermore, a meal can be comprised of several types of food products( Reference Barbosa 15 ), containing a combination of high-Na processed foods. One example of this is pasta with tomato sauce, which can be composed of instant noodles, ready-made tomato sauce, pickled olives, ready-made seasoning and grated cheese, and served with a side salad with ready-made dressing and cooked meat ready to be heated – all products with a potentially high Na content. In a meal with this combination, for example, the Na content could exceed the recommended levels, compromising nutritional quality( 5 ).
A large variation was also found in Na content between similar products. In 78·0 % of the subgroups analysed, the variation between the highest and lowest Na content was at least twofold and could reach extreme differences, such as 634 times greater in the case of the garnishes and other canned vegetables and fruits subgroup. In some subgroups (such as oil-based salad dressings), these large differences concurred with high Na content.
An Australian study( Reference Webster, Dunford and Neal 29 ) that analysed 7221 processed foods also found high Na content and large variations in Na concentration in most product categories analysed, including salad dressings (181 times). A Brazilian study of the nutritional profiles of some processed foods( 43 ) found similar results, but with shoestring potatoes presenting the greatest variation (14·3 times). The present study found even greater variation between the Na levels of similar products, which may have occurred in some subgroups due to the inclusion of distinct products in the same subgroup. The resulting data asymmetry caused by this categorization can be observed in the ‘other cheeses’ subgroup, which includes both an example of ricotta cheese with Na content <100mg/100 g and an example of parmesan cheese with Na content >2000mg/100g. However, in most of the subgroups the difference is attributable to the presence of products with insignificant amounts of Na according to Brazilian legislation in contrast with similar products with extreme Na levels in the same subgroup, as is the case for tomato sauces, for example.
The large variation found shows that there are real opportunities to reformulate products available for sale in Brazil. This situation demands a strong government policy to reduce Na content( Reference Webster, Dunford and Kennington 44 ), as has occurred in the UK and Finland( Reference Webster, Dunford and Hawkes 18 ), and has been occurring in Brazil since 2010( Reference Brasil 45 ). Such policies involve the reformulation of food products in order to reduce the supply – and thus the intake – of Na coming from these products. These policies, combined with new proposals to require nutritional labelling on the front of packages, can influence the industry to reduce the Na levels of the foods they offer( Reference van Raaij, Hendriksen and Verhagen 31 , Reference Vyth, Steenhuis and Roodenburg 32 ).
Equally noteworthy is the high number of citations of Na-containing food additives in the products studied, especially monosodium glutamate. According to a study developed in China, monosodium glutamate intake was positively and longitudinally associated with BMI and overweight among apparently healthy Chinese adults( Reference He, Du and Xun 46 ). In addition, up to eight Na-containing food additives were found in the same product – as in the case of cooked meat with barbeque sauce (group V) – as well as sodium diphosphate, which is not included on Mercosul’s harmonized list of additives and was found in 0·3 % of the food analysed. A review of food additives( Reference Polônio and Peres 47 ) raises the issue of adverse health effects caused by the use of food additives in large amounts.
The reduction of all dietary Na sources (including food additives) is recommended by the WHO( 6 ). In order to reduce Na intake, it is recommended to inform the public of high Na levels in foods( Reference Brasil 25 ), facilitating identification of high-Na foods at the time of purchase. However, the feasibility of this is questionable considering the way Na is currently labelled in Brazil.
The Brazilian consumer currently has two ways to check for excessive Na content in processed foods: (i) by reading Na information in milligrams per serving along with analysing the %DV corresponding to the food’s serving size; or (ii) by noting the appearance of Na-containing foods (especially salt) on the ingredients list. The present study identified some points that could hinder this examination.
The first point was the presentation of Na content in milligrams per serving. The present study’s analyses were only made possible after converting the Na value in milligrams per serving to milligrams per 100 g or 100 ml of food. Interpretation was made difficult by the manner in which nutrition label information is presented (with varying serving sizes) and the fact that Brazilian nutrition labelling legislation( 22 ) permits serving size variability. It should be noted that the public generally does not understand information in milligrams or the conversion of Na to salt. Furthermore, the terms ‘sodium’ and ‘salt’ are still erroneously used as synonyms( Reference McLean and Hoek 48 , Reference Van Vliet and Campbell 49 ). One suggested alternative is to present Na content per 100 g instead of by serving size precisely because of the variability allowed in serving sizes, which in many cases prevents easy comparison between foods( Reference Sharp 50 ).
Another difficulty concerns the %DV calculation based on 2400 mg Na/d( 23 ). The use of this value extrapolates the WHO and FAO( 17 ) recommended daily intake by 400 mg. The presentation of a value above the recommended value can confuse consumers, as discussed in a review of Na intake in Canada( Reference Van Vliet and Campbell 49 ).
Finally, it was expected that higher Na content could correspond to a higher number of salt citations in the initial position of the ingredients list. However, the present study did not find this rule to be a good indicator to check for high Na levels in food products because, among other reasons, the proportion of added salt is still small compared with the proportion of other ingredients added to the product, such as processed food with few ingredients like tomato purée (made with tomatoes and salt) or food products with an elevated proportion of a main ingredient, such as flour or meat. A Chinese study( Reference Ly, Chen and Wang 51 ) that analysed the ingredients lists of 5877 food products found salt listed as one of the first three ingredients on 22·9 % of them, yet highlighted the difficulty in judging product quality simply by reading the ingredients list and consequently consumers’ difficulty in identifying processed food ingredients related to the development of chronic non-communicable diseases.
Our study also incorporates some possible limitations that should be taken into consideration. One possible limitation of the present study is the use of nutrition labelling to determine a product’s Na content without running chemical analyses. However, the study considered that consumers only have access to what is reported on packaging, so the accuracy of such information should be ensured by the manufacturer and tested for compliance with the legislation( 23 ). Another potential limitation of the study was the inclusion of products sold in just a single store, but since the store is a large supermarket in an urban area that offers a wide variety of food products and belongs to a large chain, most of the products sold there are sold by other chains and stores throughout the country, so this fact is unlikely to affect the study’s external validity. Finally, the products’ presentation in predefined groups and subgroups by Brazilian labelling legislation can also be considered a limitation. However, despite making it impossible to specifically analyse each type of food product, the study settled on using the predefined groups and subgroups because this is the official categorization under current labelling law in Brazil( 22 ), which regulates the presentation format of nutritional information available at the time of purchase.
Conclusions
Most of the processed and ultra-processed food products included in the present study had high Na content and high variability among similar products, which presents new evidence for reformulation opportunities in food products sold in Brazil. These products are widely consumed by Brazilians, underscoring the urgency of reducing Na content in these products as excessive Na consumption has a negative impact on health outcomes, including an increased risk of developing chronic non-communicable diseases. It is clear that Na labelling should be reviewed, since current labelling was found not to facilitate the identification of Na content or its variation among similar products. Aiming to ensure the usefulness of information provided to consumers and the nutritional quality of products sold, we recommend a reduction of Na content in food products in Brazil as well as the continued development of studies aiming to improve Brazilian Na labelling, with a focus on easier identification of high-Na products at the time of purchase.
Acknowledgements
Financial support: This research was supported by the Council for the Development of Postgraduate Personnel (Coordenação de Aperfeiçoamento de Pessoal de Nível Superior; CAPES) and the Santa Catarina State Research and Technological Innovation Assistance Foundation (Fundação de Amparo à Pesquisa e Inovação Tecnológica do Estado de Santa Catarina; FAPESC). CAPES and FAPESC had no role in the design, analysis or writing of this article. Conflict of interest: None. Authorship: C.A.M. was responsible for the study design, project management, data analysis, interpretation of the results and manuscript writing. D.A.G.-C. was responsible for the data analysis, interpretation of the results and revision of the final manuscript. R.P.d.C.P., A.A.d.S. and M.B.V. were responsible for the design of the original study, research coordination, orientation and revision of the final manuscript. Ethics of human subject participation: Ethical approval was not required.


