


OVERVIEW
This report is a summary of APSA’s finances for the 2017–18 fiscal year, ending September 30, 2018. More detailed financial information is also available on the APSA 990 federal tax form, which is available on the APSA website and the FY18 audit report that is available on request from the APSA Finance office.
APSA continues to have sufficient resources for current and future operations, and to expand the association’s activities in new directions as needed. Over the past fiscal year, APSA’s assets have increased in value from $41.3 million to $46.6 million. During the same period, liabilities increased only slightly from $3.8 million to $4.1 million.
Operating revenue was under budgeted revenue, but expenses were under budget as well. The net bottom line was consistent with expectations. The annual meeting in Boston was very successful coming in over budgeted revenue and under budgeted expenses. APSA’s journals and publications were on budget. Membership revenue was down slightly.
We worked closely with the investment committee recently completing a review of APSA’s investment adviser, and we are currently updating the investment policy. The association is currently in the process of updating accounting systems that will make financial practices more efficient.
The association’s financial condition remains healthy. APSA continues to operate in a sound financial environment, with steady income and growth-producing programs, minimal long-term liabilities, professional accounting practices, and a diversified investment portfolio.
APSA INVESTMENTS AND NET ASSETS FOR FISCAL YEAR 2017–18
The association’s overall financial position remains very strong compared to other organizations of similar size. Assets are $46.6 million and include APSA’s headquarters building and an adjacent commercial rental property.
As seen in table 1, APSA’s liabilities are $4.1 million, leaving equity at $42.5 million. This includes $5 million of permanently restricted net assets, $19.4 million are temporarily restricted, and $18.1 million of unrestricted or board-designated net assets.
Table 1 Balance Sheet: September 30, 2018 (with Comparable Totals for 2014–2017)
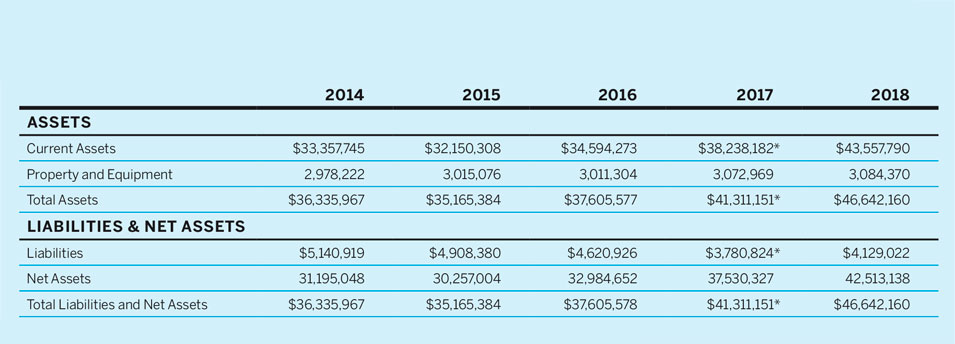
* Numbers vary slightly from published numbers in PS 52 (2).
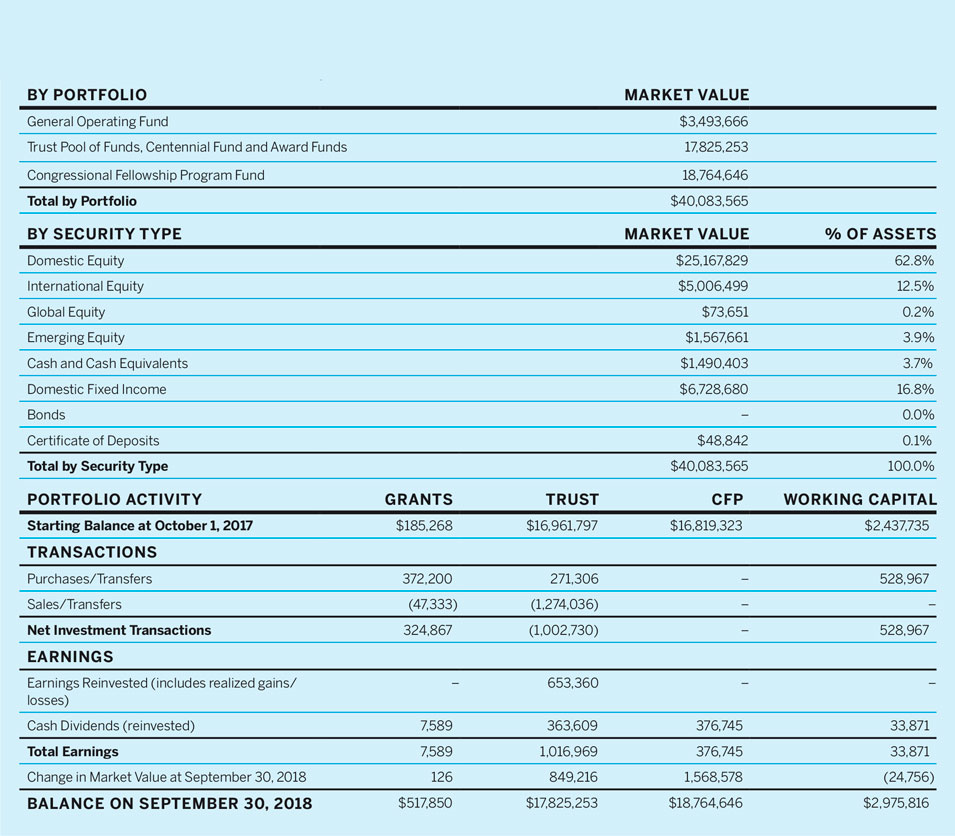
Indicated in table 2, APSA’s investments were valued at $40 million on September 30, 2018. These assets by fund include the Working Capital Fund at $2.9 million, the Trust and Development Fund at $17.8 million, the Congressional Fellowship Fund at $18.8 million and the MENA project at $500k. The fair market value of APSA’s investments increased by $3.7 million during the fiscal year. There was a downturn in the investments at the end of calendar year 2018, however the market has fully recovered since.
Table 2 Investment Portfolio Summary for Trust Pool and Endowed Funds FY18
APSA’s portfolios have slightly outperformed the S&P 500 in recent years, and has benefited due to a strong economy and a heavily weighted portfolio towards US equity funds.
This resulted in the following returns:
1. The CFP account had an annual return of 11.6%.
2. The T&D account also had an annual return of 11.6%.
3. The Working Capital account earned 0.33%.
4. The MENA account had an annual return of 1.5%.
The Investment Committee interviewed several investment adviser firms over the past several months. Each firm was asked to state their investment philosophies in several areas such as US and international investments, equity and bond markets, and socially responsible investments. The committee decided to stay with the current investment advisers, AndCo Consulting.
We are currently working with the committee updating APSA’s Investment Policy with the goal of maximizing returns and reducing risk. The revised policy will be completed and presented to the APSA Council in 2019.
THE OPERATING BUDGET FOR 17–18
The largest anticipated income sources for the year were conferences and meetings revenue of $2.0 million, membership dues and fees of $1.9 million, and journals and publications at $1.6 million (table 3). Our largest anticipated expenditures were for programs at $2.5 million, conferences and meetings at $1.52 million, administrative costs of $1.36 million, and the journals at $1.29 million (table 4). (See table 5 for a multi-year perspective.)
Table 3 Operating Budget–Revenue
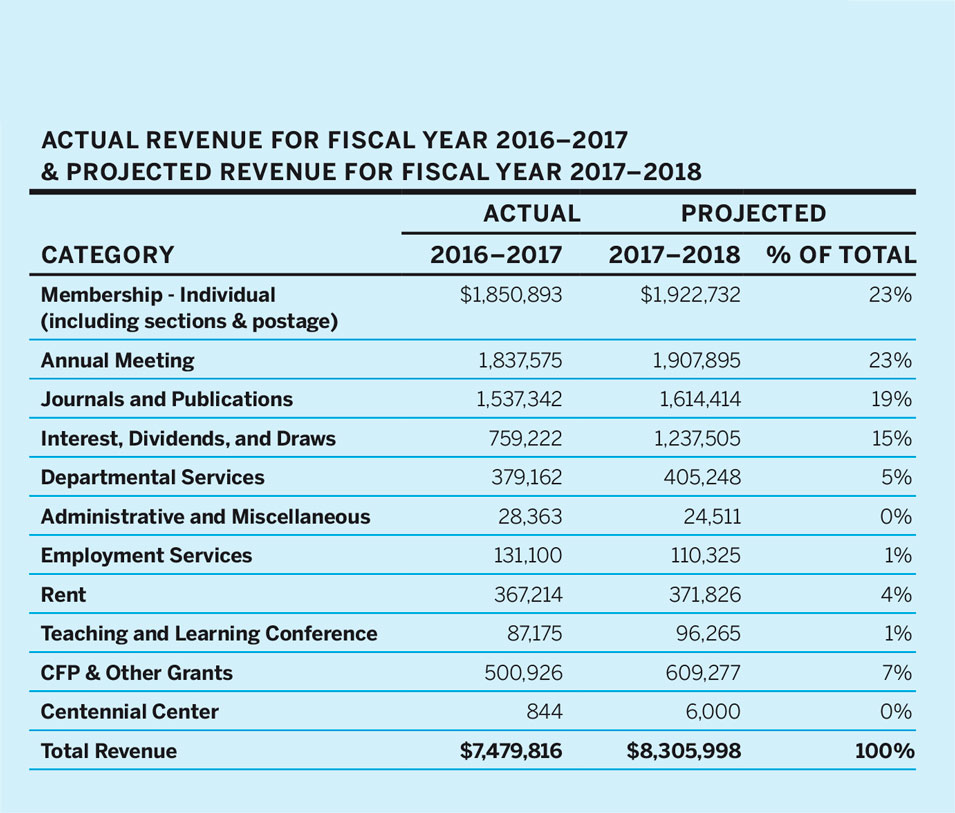
Table 4 Operating Budget–Expenditures
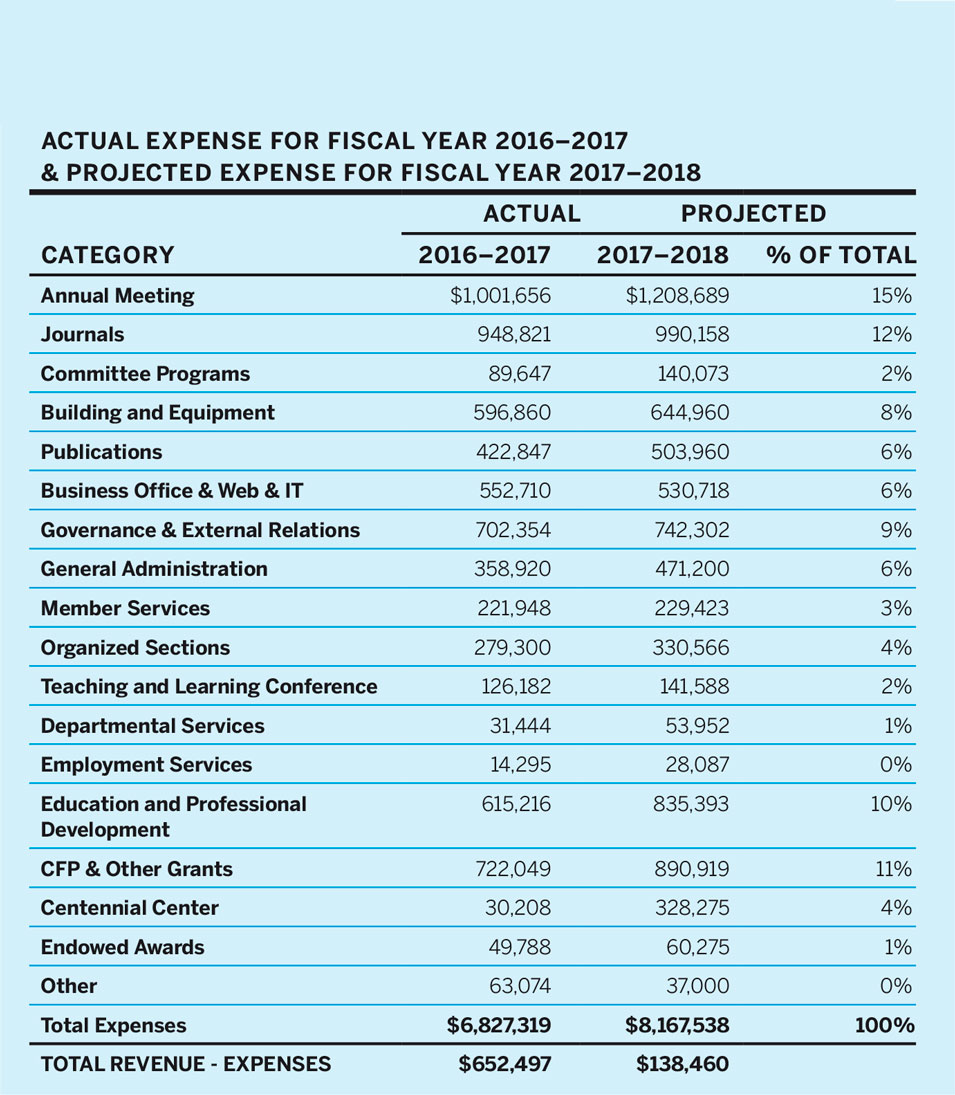
Table 5 Operating Budget 1992–2018: A Multi-Year Perspective
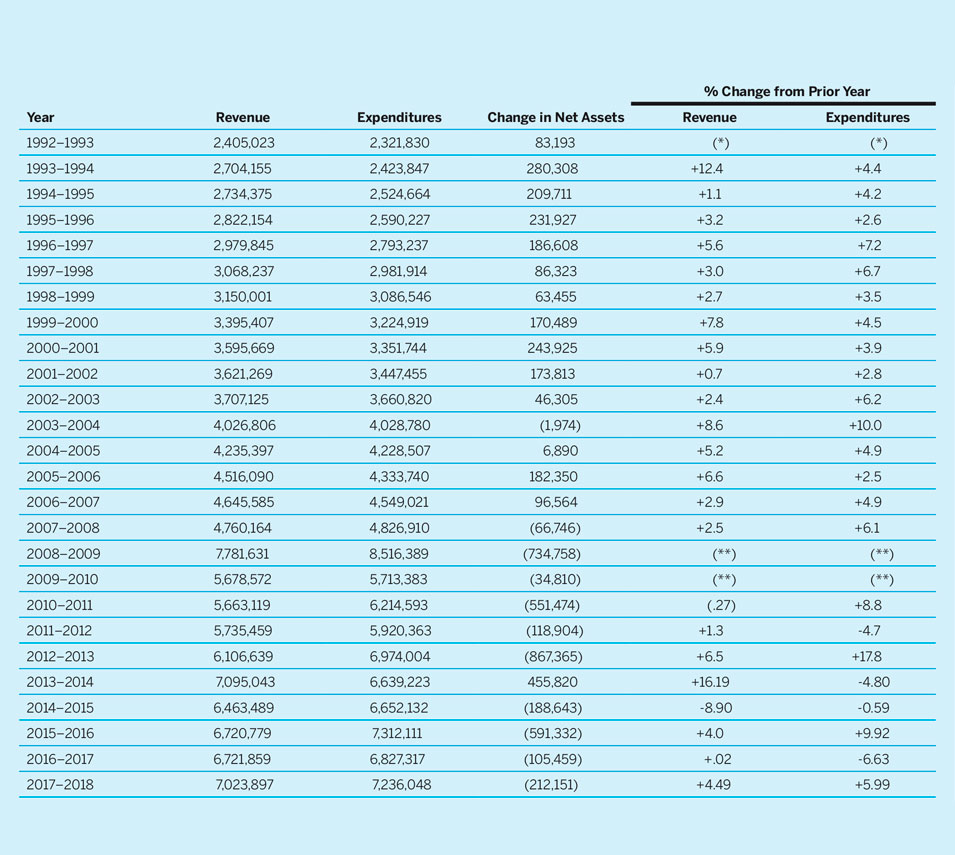
(*) In FY 1992–1993, APSA moved to a new budgeting system, making the figures in that year not comparable with those of prior years.
(**) In FY 2008–2009, APSA changed Year end from June 30th to September 30th, therefore budget is for 15 months.
Dividends and interest were budgeted conservatively for the year. APSA does not budget for realized or unrealized gains or losses on investments.
OPERATIONS IN REVIEW: FY18
Operating revenue was just over $7.0 million and operating expenditures came in below budget at $7.2 million (see table 6 and 7). APSA’s journals and publications were on budget. However, membership was down 6% from budget. The association has 28 employees at its headquarters in Washington DC, who support the association to serve the membership’s programming goals and to respond to new directives and APSA Council projects.
Table 6 Operating Revenue Trends, 2014–2018
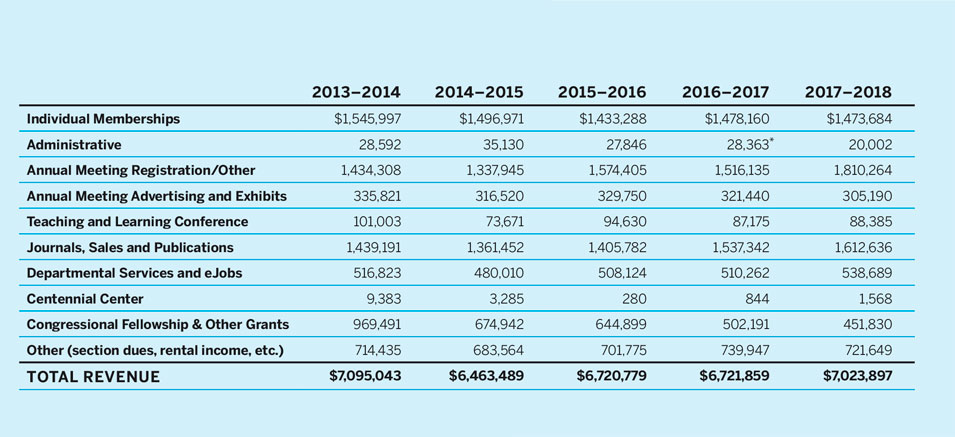
* Includes $6,700 2017 Bldg1527 Insurance Proceeds
Table 7 Operating Expenditure Trends 2014–2018
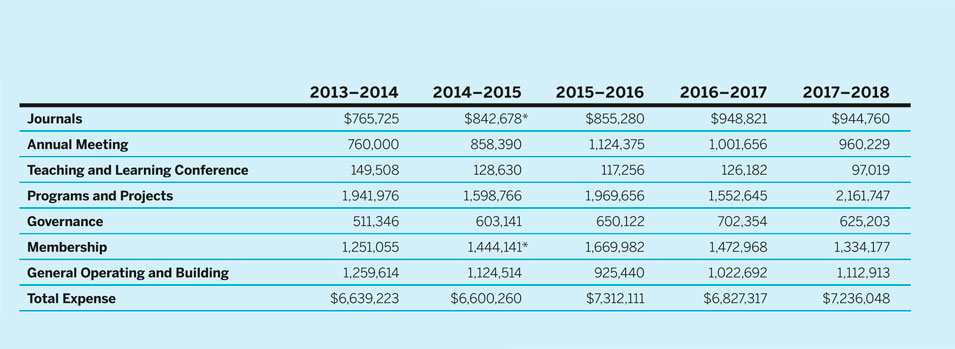
* As of 2014–2015 Web Services has been moved to General Operating
The annual meeting in Boston was very successful with the highest attendance in nearly a decade. Our total attendance was 7,032 or a 10.5% increase over the 2017 San Francisco meeting attendance. Other initiatives in 2017–18 included sustained efforts in the areas of public engagement, expanded department and international membership, the Teaching and Learning Conference, annual workshops in Middle East and North Africa, mentoring, and graduate education.
In February 2018 APSA held its fifteenth Teaching and Learning Conference in Baltimore. The conference theme was: “Teaching Politics as a Public Good: Citizenship and Civic Engagement in the Classroom.” The conference attracted a diverse group of political scientists from a wide variety of institutions and subfields. The 2018 APSA Annual Meeting was held in Boston and centered on the theme “Democracy and Its Discontents.” Following this, the annual meeting will be in Washington, DC from August 29 through September 1, 2019, exploring the theme “Populism and Privilege.” Beginning in 2020, the TLC will be a biennial event.
In 2018, APSA provided support for the APSA Ralph Bunche Summer Institute (RBSI) at Duke University, at a level of 15 students due to the receipt of a new National Science Foundation (NSF) grant to Duke University for the RBSI that covered 2016–18. APSA contributes direct cost support for teaching assistants.
An RBSI Advisory Committee charged with overseeing the development of long-term programming options is nearing the completion of their report. A development strategy outlining a three-year, $1.25 million fundraising goal for the Ralph Bunche Fund that was submitted to APSA’s Council to support future efforts, and efforts to support the RBSI programs through institutional and individual philanthropy is continuing. Continued NSF funding for 2019–21 is being sought.
Board approved draws/fund transfers on the following programs are not included in the reporting of actual revenue activities within the financials. These amounts are only included in the budget column for budgeting and council reporting.
When draws/fund transfers are taken, they are reflected as a reduction of the Congressional Fellowship Fund and Trust and Development Funds and an increase of APSA General Operating Fund on the balance sheet (seen in table 8).
Table 8 Budgeted Draws/Fund Transfers: 2017–18
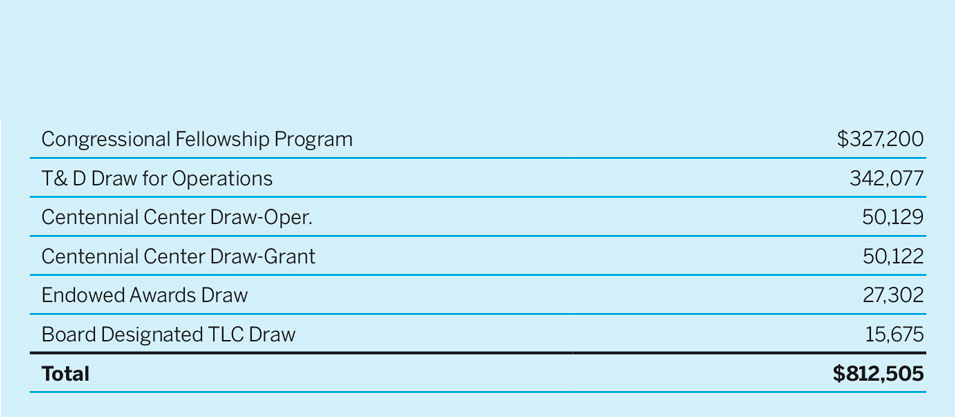
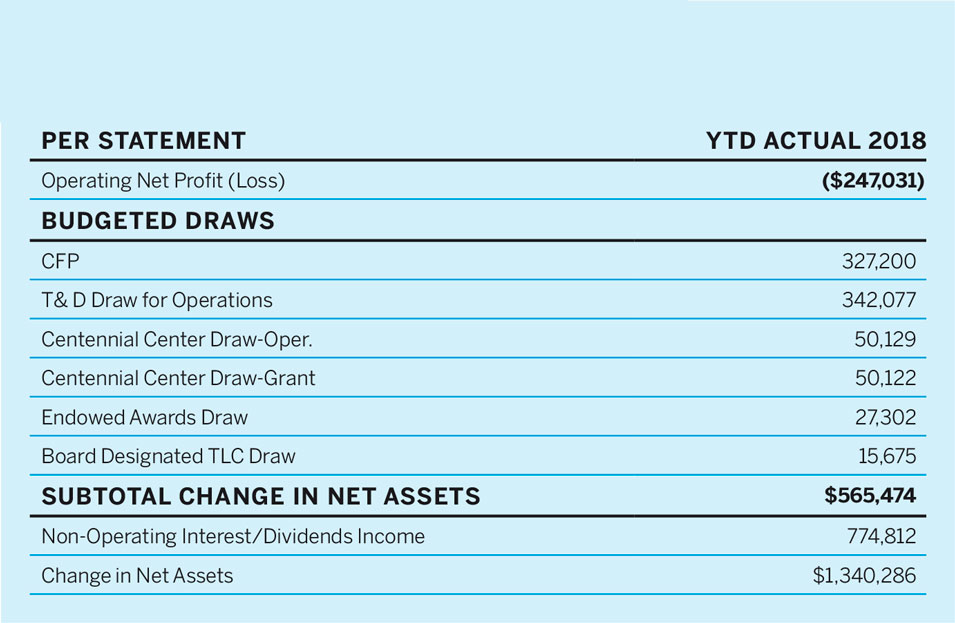
When budgeted draws/fund transfers are taken into consideration for operating activities and projects, Operating Net Profit (Loss) is as shown on table 9.
Table 9 YTD Operating Net Profit
APSA and Cambridge University Press began a new 10-year agreement, effective January 1, 2017 through December 2026, for the publication of the American Political Science Review (APSR), PS: Political Science & Politics and Perspectives on Politics. Overall, the contract is worth approximately $17 million to APSA over the 10-year term.
SUMMARY
Overall, APSA is in a very strong financial position and is planning a number of new initiatives for the benefit of our membership including The Presidential Task Force on New Partnerships. Members with questions about our finances should contact APSA Executive Director Steven Rathgeb Smith at smithsr@apsanet.org.


