


The metabolic syndrome (MetS) is the constellation of risk factors associated with greater risk of developing type 2 diabetes and CVD(Reference Grundy1). These risk factors of metabolic origin include hyperglycaemia, dyslipidaemia (elevated TAG and lowered HDL-cholesterol), obesity and hypertension. Collectively termed the ‘metabolic syndrome’, most underlying risk factors can be modified through behavioural and/or pharmaceutical intervention(Reference Alberti, Eckel and Grundy2). Given that the MetS increases in prevalence as obesity prevalence in the population increases, it was introduced as a diagnostic category for early identification of, and intervention on, individuals at high risk of metabolic disease, with the goal of reducing the risk of developing type 2 diabetes and CVD(Reference Aganovic and Dusek3).
Central obesity(Reference Carr, Utzschneider and Hull4) and insulin resistance(Reference Reaven5) have long been implicated in driving the initiation and development of the MetS; however, there remains uncertainty regarding the key underlying mechanism of its development. Gut microbiota(Reference Festi, Schiumerini and Eusebi6), chronic stress(Reference Tamashiro, Sakai and Shively7), dietary n-3 fatty acid deficiency and high fructose intake(Reference Simopoulos8) have all been connected to the development of the MetS. However, recent guidelines have laid more emphasis on central obesity(Reference Alberti, Eckel and Grundy2).
In Kuwait and other countries in the Gulf Cooperation Council, a relatively recent phenomenon has been a major lifestyle transition defined by high energetic intake and unprecedented low physical activity levels(Reference Al Zenki, Al Omirah and Al Hooti9). This lifestyle is thought to be substantially contributing to high rates of overweight and obesity in the Gulf region and the resultant cluster of risk factors leading to the MetS. Reports of MetS prevalence in Kuwait vary by sex, depending on the MetS classification used, such as those from the International Diabetes Federation (IDF) and National Cholesterol Education Program Adult Treatment Panel III (ATP III). Women have been reported to have MetS prevalence of 37·7 % and 40·1 % per ATP III and IDF criteria, respectively, and men, 34·2 % and 41·7 %, respectively(Reference Al Zenki, Al Omirah and Al Hooti9). These prevalence rates are comparable to reports in high-income countries such as USA, 34·7 %,(Reference Aguilar, Bhuket and Torres10) and Australia, 33·5 %(Reference Tanamas, Magliano and Lynch11).
Prognostic risk assessment tools for early identification of type 2 diabetes and CVD exist. These include, but are not limited to, the Framingham risk assessment tool(Reference Anderson, Odell and Wilson12), Finish diabetes risk score(Reference Lindstrom and Tuomilehto13), systematic coronary risk evaluation risk charts(Reference Conroy, Pyorala and Fitzgerald14), UK prospective diabetes study risk engine(Reference Stevens, Kothari and Adler15), European IR Risk Index and European HTN Risk Index(Reference Kanellakis, Mavrogianni and Karatzi16). However, the prospective population used to design these risk assessment tools did not include the Kuwaiti population. As the Framingham risk assessment tool classifies as ‘low risk’ some 23 % of individuals with the MetS(Reference Oguoma, Nwose and Skinner17) and evidence that the MetS predicts a 2- to 3-fold greater risk of incident CVD morbidity and mortality(Reference Grundy, Brewer and Cleeman18,Reference Babu and Fogelfeld19), there is a need for stronger attention to the MetS in screening cardiometabolic risk. Importantly, key independent CVD risk factors (hypertriacylglycerolaemia, hyperglycaemia and obesity) incorporated in the definition of the MetS are not even captured by some risk assessment tools.
Several definitions of the MetS have been promoted(Reference Alberti, Eckel and Grundy2,Reference Balkau and Charles20–Reference Alberti and Zimmet25) . The American Heart Association/National Heart, Lung, and Blood Institute (AHA/NHLBI) made minor changes to the ATP III criteria to include impaired fasting glucose at ≥5.5 mmol/l . Countries such as Kuwait have used different definitions in different surveys, but whichever definition has been used, the MetS estimate is based on anthropometric norms for non-Middle East populations. A review by Ansarimoghaddam et al. (Reference Ansarimoghaddam, Adineh and Zareban26) reported that, in the Middle East, the IDF(Reference Alberti, Zimmet and Shaw24) and ATP III(21) definitions were most commonly used. Just one study of Middle East populations used the definition proposed by the Joint Interim Statement on harmonising the definition of the MetS(Reference Alberti, Eckel and Grundy2). Of fifty-nine Middle East MetS studies in the pooled analysis, only eight studies were from Kuwait; of these, one used both ATP III and IDF definitions, three used ATP III, three others used IDF and one used the Joint Interim Statement definition. The use of varied definitions yields variations in estimated prevalence rates and difficulty in comparing the burden of the MetS across studies and countries. The Joint Interim Statement on harmonising the definition of the MetS was formalised in 2009(Reference Alberti, Eckel and Grundy2) to promote uniformity in measuring the MetS and agreed on four components for defining the MetS. However, the waist circumference (WC) cut-point for central obesity remains controversial in its application to different ethnic groups(Reference Simmons, Alberti and Gale27).
Based on the Joint Interim Statement, Arabs from the Eastern Mediterranean and Middle East ethnic groups have been recommended thus far to be screened for central obesity using the Europid ethnic threshold (WC ≥ 94 cm for men and ≥80 cm for women), until more specific data are available. South Asians on the other hand are recommended to be screened using the ethnic-specific cut-off of WC ≥ 90 cm for men and ≥80 cm for women(Reference Alberti, Eckel and Grundy2). This reflects Asians’ tendency to have a higher percentage of body fat at lower BMI and WC than Europeans, predisposing a higher prevalence of the MetS at lower BMI and WC(Reference Zeng, He and Dong28,Reference Chen, Ho and Lam29) . Beyond BMI and WC indices, increasing evidence from different ethnic groups has shown that waist:height ratio (WHtR) is a better predictor of the MetS than BMI and WC(Reference Oguoma, Nwose and Ulasi30–Reference Ashwell, Gunn and Gibson33).
The objectives of this study were to determine, for Arabs and South Asian expatriates living in Kuwait (the most highly dominant non-Arab ethnic group in Kuwait), (a) ethnic-specific WC, WHtR and BMI cut-points for screening diabetes and the MetS and (b) to compare the prevalence of the MetS based on the ethnic-specific WC cut-point and the IDF, and American Heart Association/National Heart, Lung, and Blood Institute (AHA/NHLBI) WC criteria (the updated ATP III criteria).
Methods
Study design and participants
A national population-based cross-sectional survey of diabetes and obesity in Kuwait, part of the Kuwait Diabetes Epidemiology Program, was conducted between 2011 and 2014, targeting adults aged 18–82 years (Kuwaiti and non-Kuwaiti). A stratified random sample of participants by nationality and governorate from the computerised register of the Public Authority for Civil Information was used as earlier reported(Reference Oguoma, Coffee and Alsharrah34). A total of 4963 participants had valid records for sex, age and BMI(Reference Oguoma, Coffee and Alsharrah34). Participants were excluded if they had missing records for any of WC (n 42) and fasting blood glucose (n 6); WC > 150 and <50 (n 12), medical history of diabetes (n 921) and ethnicity other than Arab and South Asian (n 393). The WC < 50 cm (n 3) and >150 cm (n 9) was considered data entry error. A total of 3589 participants remained for analysis. South Asian expatriates residing in Kuwait were predominantly from India, Pakistan, Sri Lanka and Bangladesh; Arab groups were mainly from Kuwait, Egypt, Lebanon, Syria, Jordan, Iran, Palestine and Yemen.
Anthropometric and physical measurements
Anthropometric measurements were carried out on participants in light clothing and barefoot. Height and weight were measured using a human digital column weighing scale with a mounted stadiometer (SECA), and the ratio of weight (kg):height square (m2) was calculated to express BMI(Reference Alberti and Zimmet25). WC was measured using a constant tension tape (SECA), with arms relaxed at the sides, at the highest point of the iliac crest and the mid-axillary line. The ratio of WC (cm):height (m) was used to define the WHtR values. Blood pressure was measured using an Omron HEM-907XL digital sphygmomanometer (Omron Healthcare, Inc.). The average of three readings of each of systolic and diastolic blood pressure (mmHg) was calculated to express blood pressure.
Biochemical measurements
Study participants fasted for at least 10 h prior to the collection of fasting blood samples. Siemens Dimension RXL chemistry analyser (Diamond Diagnostics) was used to measure the blood glucose and lipids profile. Participants were measured for HbA1c using a Variant device (Bio-Rad Laboratories). All blood analyses were conducted at the Dasman Diabetes Institute clinical laboratories.
Definition of the metabolic syndrome and risk factors
Hypertension was defined as systolic blood pressure ≥130 mmHg and/or diastolic blood pressure ≥85 mmHg and/or receiving treatment for such condition(Reference Alberti, Eckel and Grundy2). In lieu of an ethnic-specific cut-point, the WC cut-point for Europid ethnicity was applied to define central obesity for Arabs. The ethnic-specific cut-off for South Asians was used to define central obesity for this group(Reference Alberti, Eckel and Grundy2). These relevant cut-offs for men and women were WC ≥ 94 cm and ≥80 cm, respectively, for Arabs, and WC ≥ 90 cm and ≥80 cm, respectively, for South Asians. Elevated HbA1c ≥ 6·5 %(35) or fasting blood glucose ≥ 7·0 mmol/l was used to define diabetes(Reference Alberti, Eckel and Grundy2). Hyperglycaemia (fasting blood glucose) was defined as fasting blood glucose ≥ 6·1 mmol/l(Reference Alberti, Eckel and Grundy2), while dyslipidaemia was defined when at least one lipids disorder (elevated total cholesterol ≥ 5·2 mmol/l, elevated TAG ≥ 1·7 mmol/l, low HDL ≤ 1·03 mmol/l for men or ≤1·29 for women and elevated LDL ≥ 2·6 mmol/l) is identified(Reference Alberti, Eckel and Grundy2). We defined ≥3 CVD risk factors as the presence of any three of hyperglycaemia, hypertension, elevated blood TAG and low HDL level. The criteria used in defining the MetS were based on:
-
IDF: central obesity and any two of hyperglycaemia, hypertension, elevated blood TAG and low HDL level.
-
AHA/NHLBI: is an update of the ATP III criteria. Any three of central obesity, hyperglycaemia, hypertension, elevated blood TAG and low HDL level are required for MetS diagnosis.
For each set of criteria, we compared the IDF ethnic-specific WC cut-off and the predicted WC cut-off from our study population.
Ethical clearance
This study was conducted at Dasman Diabetes Institute and approved by the Ethical Review Committee (ERC – RA2010-004). The study protocol was consistent with the Declaration of Helsinki. All participants signed the consent form, in writing, prior to enrolment in the study.
Statistical analysis
Analyses were performed separately for sex and ethnic groups. Descriptive statistics were calculated and presented as mean and standard deviation, or median and interquartile ranges if skewed, while categorical variables are presented as counts and percentages.
Age-adjusted logistic regression and receiver operating characteristic (ROC) analyses were carried out to evaluate the ability of anthropometric indices (WC, WHtR and BMI) to discriminate diabetes and ≥3 CVD risk factors. The area under the ROC curve provides a scale from 0·5 to 1·0 that is used to compare the ability of an anthropometric index to detect a positive disease condition. AUC of 0·5 indicates an absence of predictive power, while AUC of 1 indicates a perfect prediction(Reference Peat and Barton36). The optimal cut-off points were identified based on Youden’s index, which is defined as the points on the ROC curve that maximises the sum of sensitivity and specificity (sensitivity + specificity - 1). Sensitivity, specificity, positive and negative predictive values, and their 95 % CI were calculated and presented for cut-points determined for each set of predictive criteria.
Age-adjusted restricted cubic spline regression with three knots at 10, 50 and 90 percentiles was further applied to assess the non-linear relationship between anthropometric indices and diabetes and ≥3 CVD risk factors across sex and ethnic groups. The Wald statistic was used to test the linearity of the relationship between WC, WHtR and BMI and the log-odds of having diabetes or ≥3 CVD risk factors. The respective cut-off points for sex and ethnicity derived based on Youden’s index were used as a reference for the estimation of OR.
Point estimates from logistic regression are presented as adjusted OR and 95 % CI. Statistical significance was set at P < 0·05. The WC cut-off points derived for sex and ethnicity subgroups, the IDF and AHA/NHLBI WC cut-off points were used to define the MetS based on the IDF and AHA/NHLBI criteria. The prevalence of the MetS based on these WC cut-off points and MetS criteria was calculated and graphed. All statistical analysis was conducted using Stata 16.1 (StataCorp).
Results
Basic study characteristics of participants
Data from 3589 participants were analysed. The sample included 2711 Arabs and 878 Asians with mean ages 43 and 41 years, respectively. Arabs had higher mean WC and BMI than the South Asians residing in Kuwait (Table 1). Across the two groups, women had higher BMI than men, while men had higher WC in the Arab group but not in the South Asian group. Arabs had lower average SBP, DBP and proportion of individuals with hypertension compared with South Asian group. Arab and South Asian men had a higher prevalence of diabetes, hypertension, dyslipidaemia and ≥3 CVD risk factors compared with Arab and South Asian women.
Table 1. Basic characteristics of study population
(Numbers and percentages)
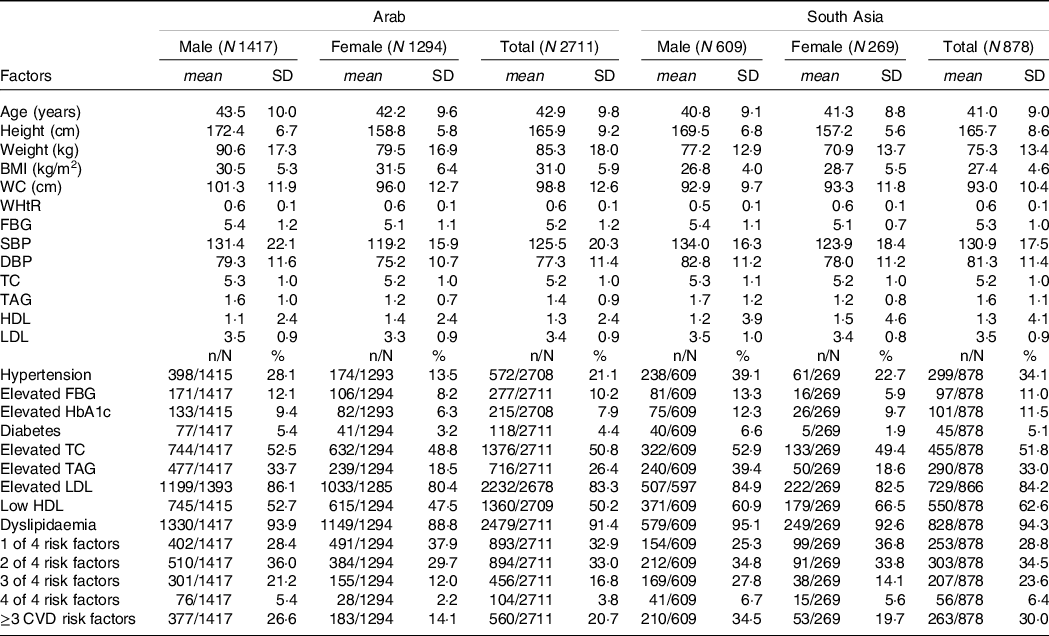
WC, waist circumference; WHtR, waist:height ratio; FBG, fasting blood glucose; SBP, systolic blood pressure; DBP, diastolic blood pressure; TC, total cholesterol; TAG, triacylglycerol; HDL, high-density lipoprotein cholesterol; LDL, low-density lipoprotein cholesterol.
Areas under the receiver operating characteristics curves for various anthropometric indices
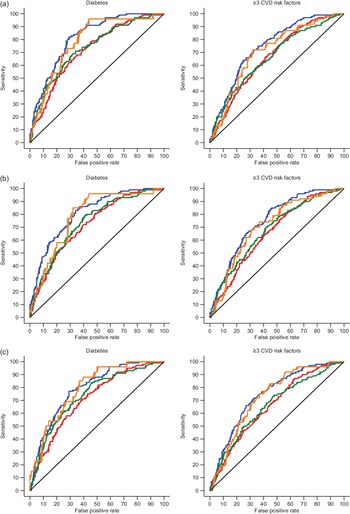
Figure 1 shows the ROC curves for each anthropometric index stratified by sex and ethnic group. The age-adjusted AUC and OR for WC, WHtR and BMI across sex and ethnic group for diabetes and ≥3 CVD risk factors are presented in Table 2. The AUC were similar for WC, WHtR and BMI, although WC had slightly higher AUC than BMI for diabetes in Arab men and women. BMI and WHtR had the highest AUC for ≥3 CVD risk factors in South Asian women and men, respectively. In Arab and South Asia men and women, BMI and WHtR were associated with a greater odd of diabetes and ≥3 CVD risk factors.
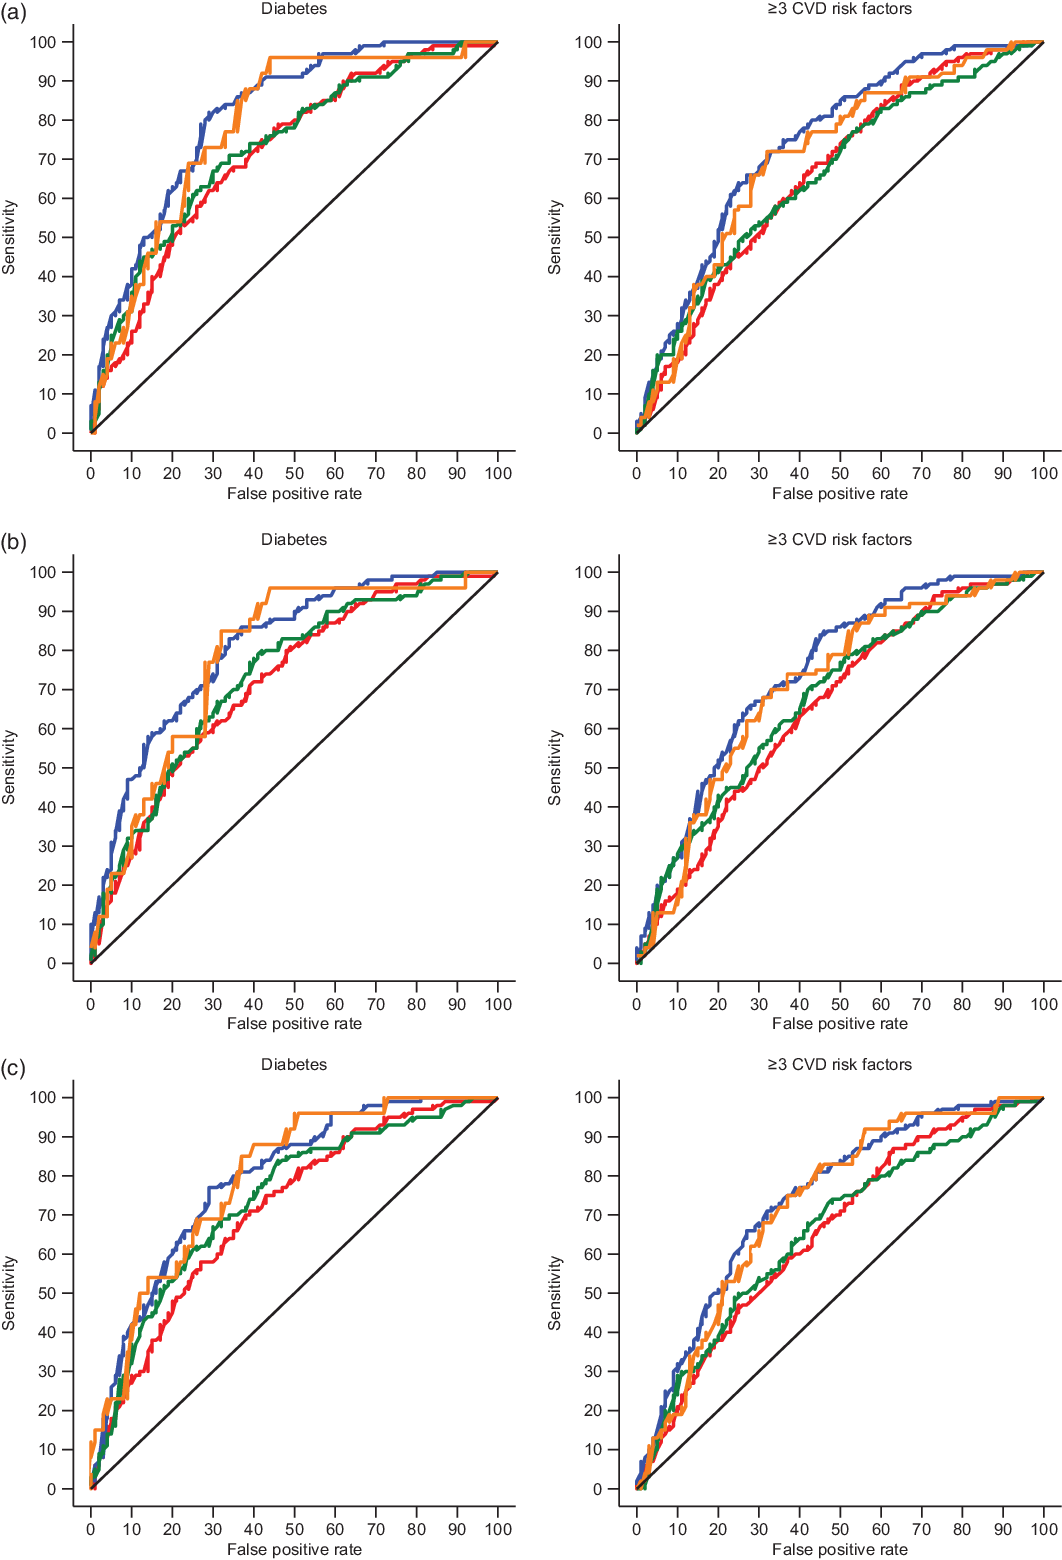
Fig. 1. Non-linear relationship between (a) waist circumference (WC), (b) waist:height ratio (WHtR) and (c) BMI; and diabetes and ≥3 CVD risk factors across sex and ethnic group. ![]() , M, Arab;
, M, Arab; ![]() , F, Arab;
, F, Arab; ![]() , M, South Asia;
, M, South Asia; ![]() , F, South Asia.
, F, South Asia.
Table 2. Areas under the receiver operating characteristic curves (AUC) for various anthropometric indices and the metabolic syndrome risk factors in South Asia and Arab males and females
(Numbers and percentages; adjusted odds ratio (aOR) and 95 % confidence interval)
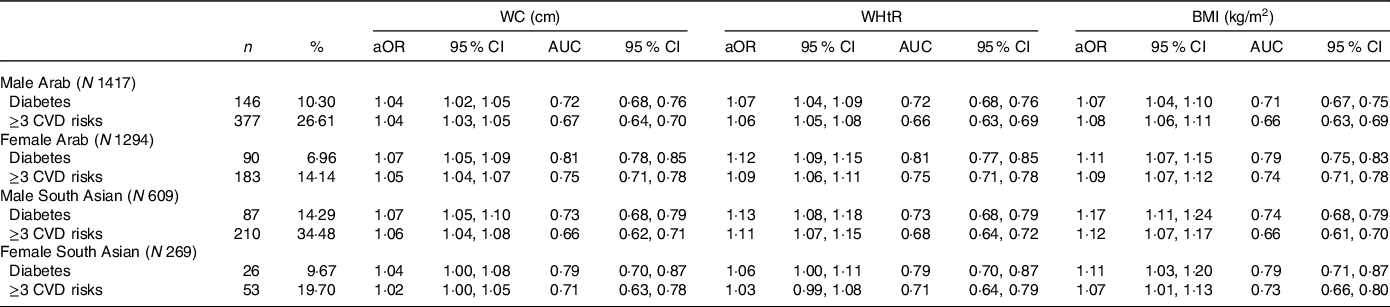
WC, waist circumference; WHtR, waist:height ratio; BMI, body mass index.
Cut-off points, sensitivities, specificities, positive and negative predictive values
Table 3 shows the optimal cut-off points, sensitivities, specificities, positive and negative predictive values of each anthropometric index that maximises the classification of participants with diabetes and ≥3 CVD risk factors in comparison with currently used cut-off points. In Arab men, the optimal cut-offs for WC, WHtR and BMI for predicting diabetes and ≥3 CVD risk factors were 106 cm, 0·55 and 28 kg/m2 for diabetes and 97 cm, 0·55 and 28 kg/m2 for ≥3 CVD risk factors, respectively. In women, the cut-offs were 107 cm, 0·65 and 33 kg/m2 for diabetes and 93 cm, 0·60 and 30 kg/m2 for ≥3 CVD risk factors, respectively. The sample-specific cut-offs for WC, WHtR and BMI for predicting diabetes and ≥3 CVD risk factors among men South Asian expatriates were 92 cm, 0·56 and 23 kg/m2 for diabetes and 91 cm, 0·52 and 25 kg/m2 for ≥3 CVD risk factors, respectively. In South Asian women, the cut-off points were 91 cm, 0·57 and 26 kg/m2 for diabetes and 93 cm, 0·49 and 32 kg/m2 for ≥3 CVD risk factors, respectively.
Table 3. Cut-off values of waist circumference (WC), waist:height ratio (WHtR) and BMI that are predictive of the metabolic syndrome risk factors in South Asia and Arab males and females
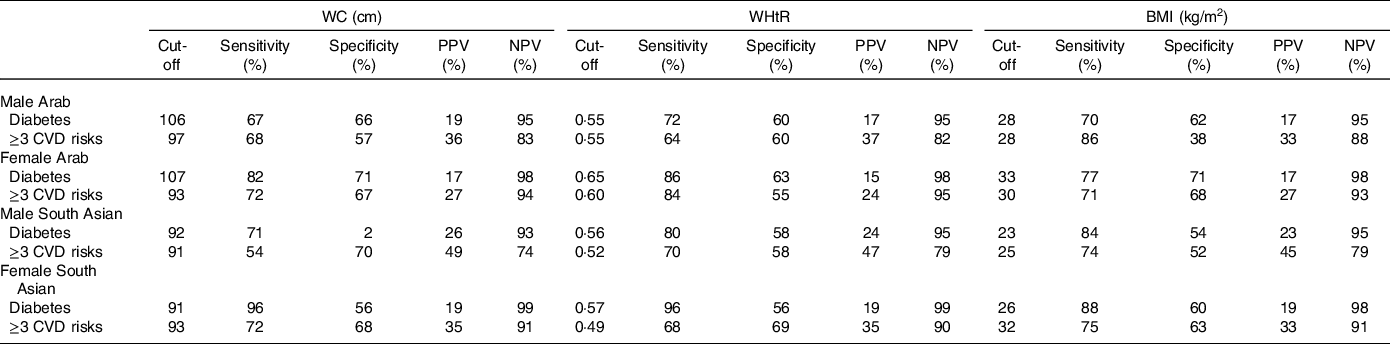
PPV, positive predictive value; NPV, negative predictive value.
Shape of relationship between waist circumference, waist:height ratio and BMI; and diabetes and ≥3 CVD risk factors
Figure 2(a)-(c) shows a non-linear relationship between the anthropometric indices and diabetes and ≥3 CVD risk factors across sex and ethnic groups. At higher WC, WHtR and BMI values, Asian men tend to have higher odds of diabetes and ≥3 CVD risk factors than Arab men and the odds was consistently greater after the anthropometric-specific cut-off points. Conversely, the OR of ≥3 CVD risk factors for women was greater in Arab women compared with South Asian women across the anthropometric indices. However, there is an s-shaped relationship of the point estimates in South Asian women, where the odds of diabetes and ≥3 CVD risk factors for the anthropometric indices plateau after the cut-point.
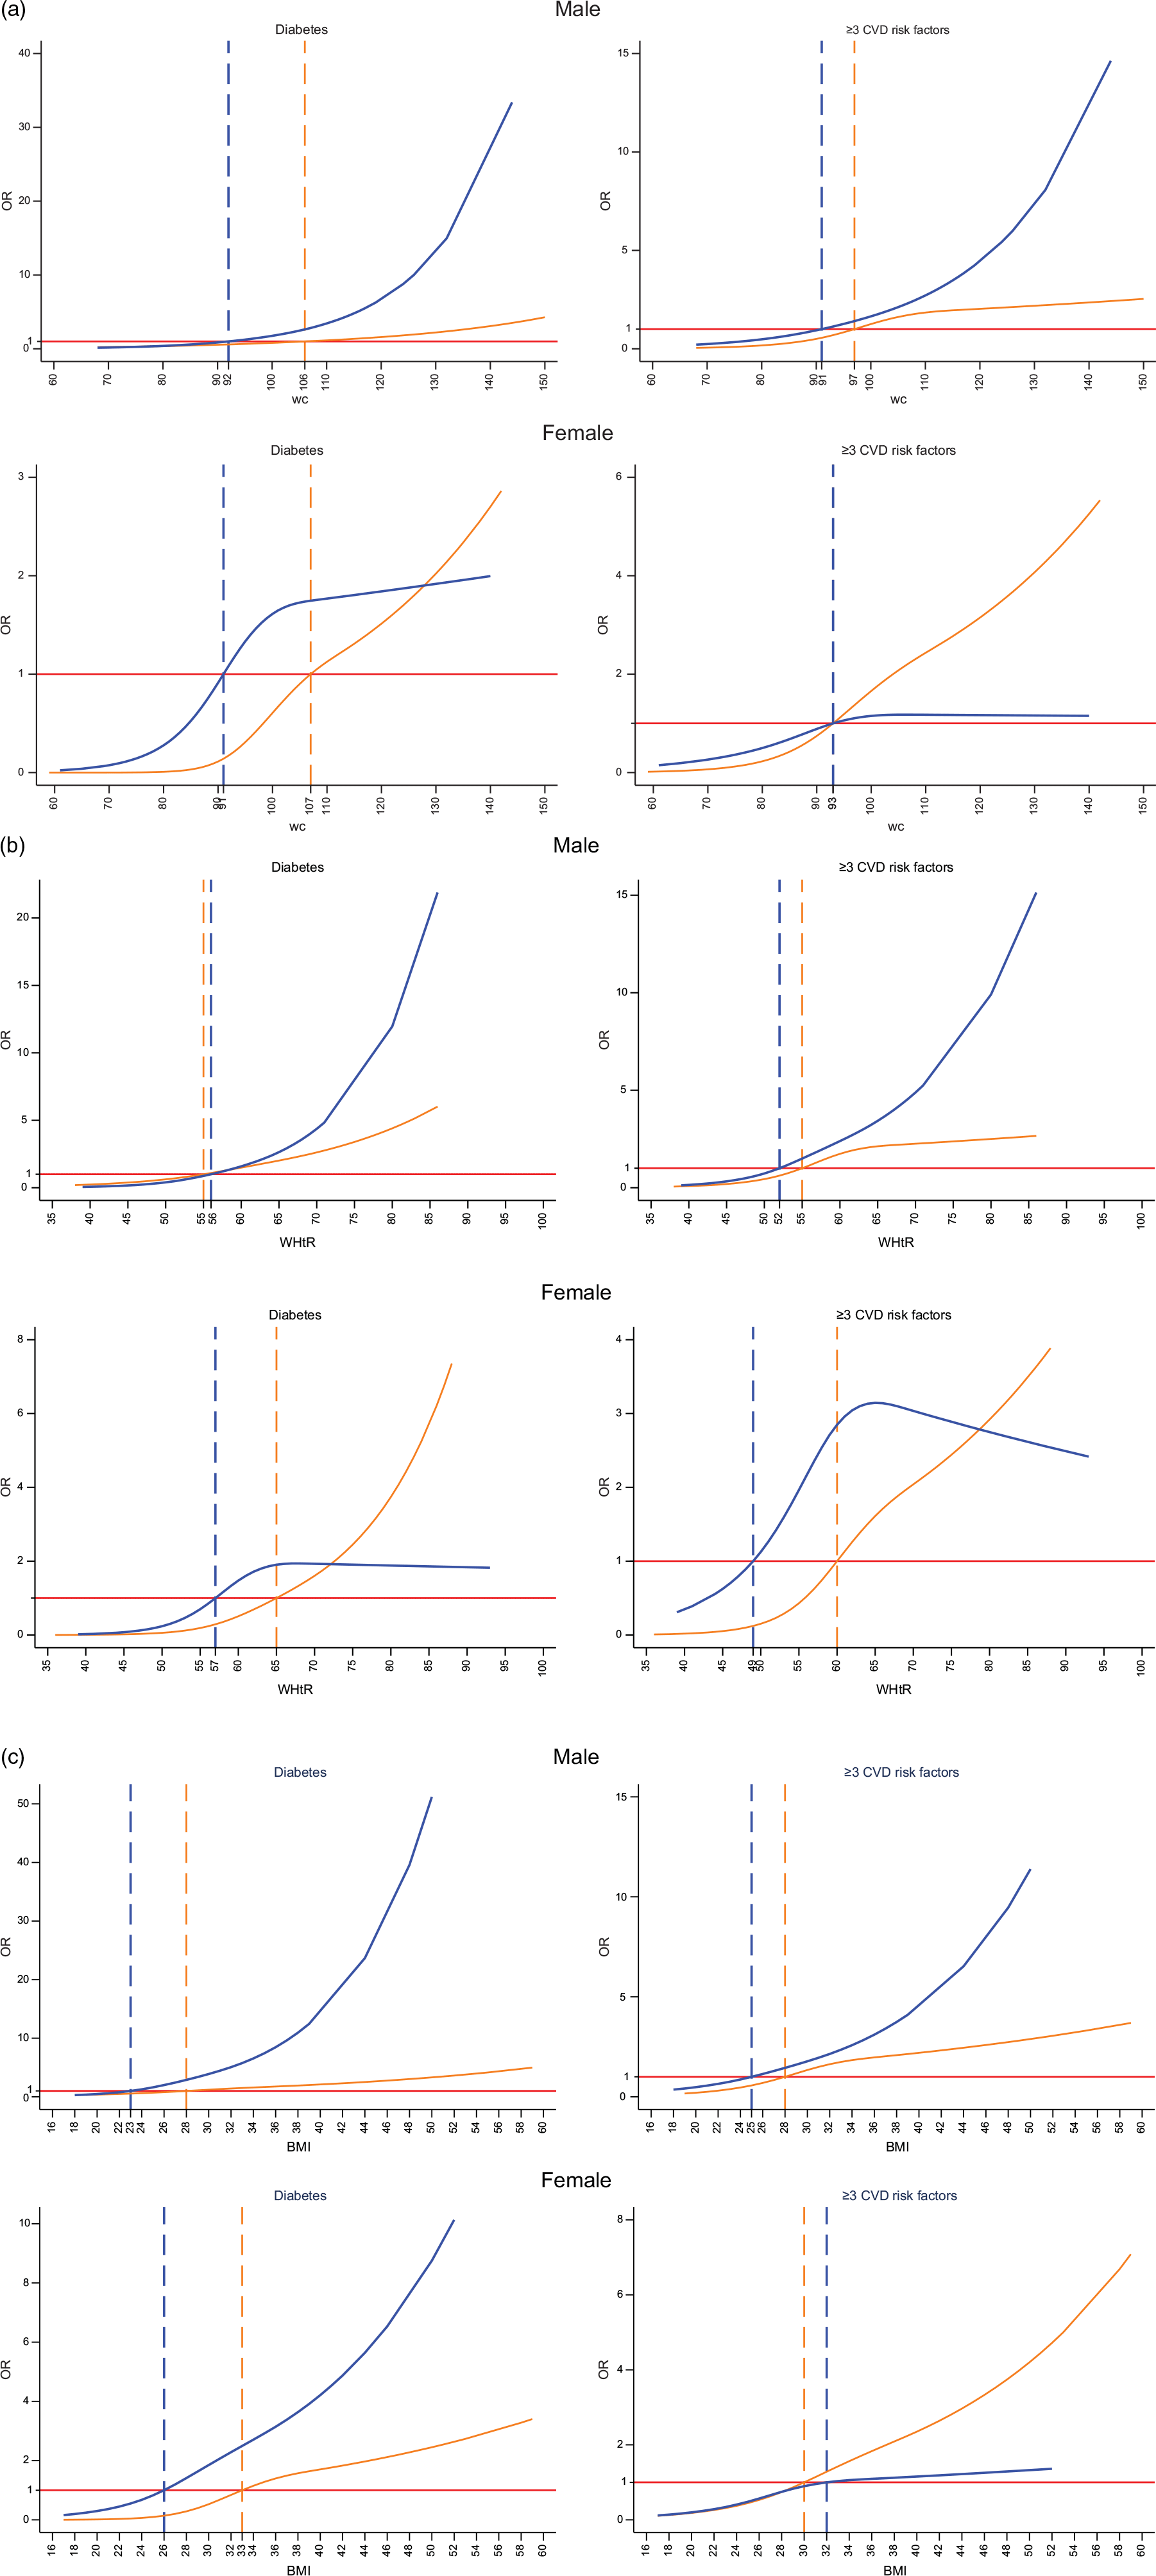
Fig. 2. Areas under the receiver operating characteristics (AUROC) curves for (a) waist circumference (WC), (b) waist:height ratio (WHtR) and (c) BMI, across sex and ethnic group. ![]() , Arab;
, Arab; ![]() , South Asia.
, South Asia.
Prevalence of the metabolic syndrome based on International Diabetes Federation and American Heart Association/National Heart, Lung, and Blood Institute criteria
Estimated prevalence rates of the MetS based on the IDF and AHA/NHLBI criteria using the IDF ethnic cut-off points and the predicted sample-specific WC cut-off are shown in Figure 3. The IDF WC cut-offs corresponded to a higher prevalence across sex and ethnic groups compared with the sample-specific cut-offs.
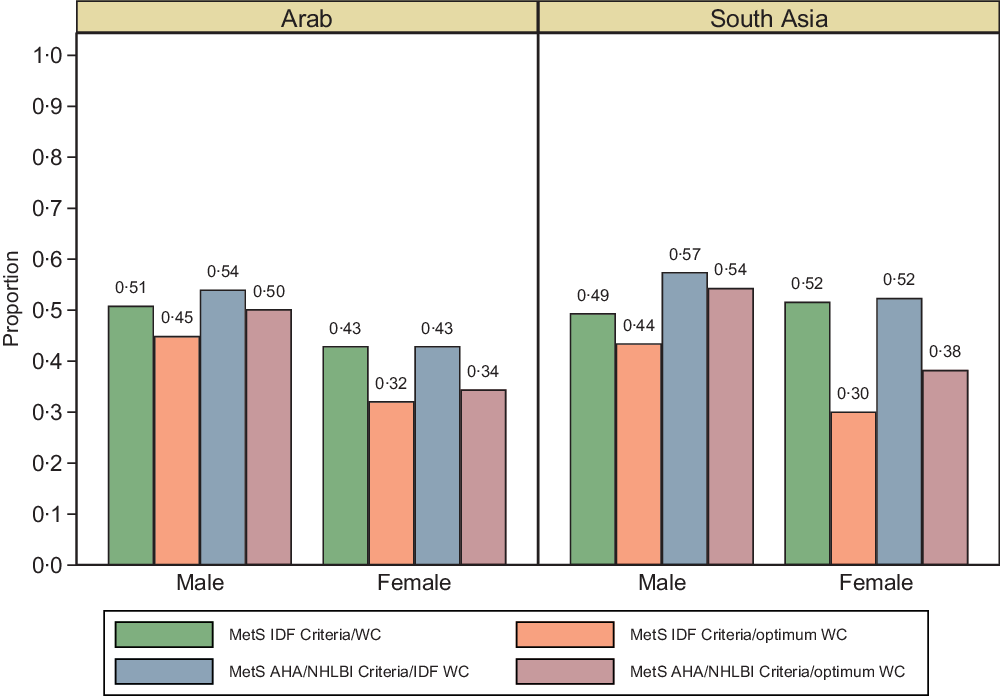
Fig. 3. Prevalence of MetS based on IDF and AHA/NHLBI criteria using the IDF ethnic cut-off points and the predicted sample-specific optimum WC cut-off across sex and ethnic group.
Discussion
Our study of a representative sample of 3589 Kuwaiti Arabs and other Arabs from Middle East and Mediterranean countries and expatriates from South Asia showed that WC and WHtR were slightly more predictive of diabetes and ≥3 CVD risk factors across sex amongst Arabs, while BMI showed slightly higher discriminatory ability of ≥3 CVD risk factors across South Asian women, than WC and WHtR. The similar areas under the ROC curves suggest that the use of any one of WC, WHtR and/or BMI would be more time and resource efficient in the screening of diabetes and ≥3 CVD risk factors in the at-risk individuals/population.
Differing results have emerged from countries in the Middle East and Mediterranean region regarding whether BMI is a better predictor than WC and WHtR of the MetS and related risk factors, or vice versa.(Reference Mojiminiyi, Al Mulla and Abdella37) Hamzeh et al. (Reference Hamzeh, Bagheri and Pasdar38) reported that BMI had the highest AUC and predicted the MetS better than WC and WHtR among adults 35–65 years in the West of Iran. In a Qatari population above 20 years of age, Bener et al. (Reference Bener, Yousafzai and Darwish39) reported that for men and women, WC was a better predictor of the MetS compared with WHtR and BMI. Also, in Jordan, Khader et al. (Reference Khader, Batieha and Jaddou40) found that the WHtR performed better than other anthropometric indices with an AUC > 80. Given that our population of Arabs comprises individuals from different Arab nations and our findings show marginal differences in the predictive ability of these anthropometric indices, relying on one index in the Arab Kuwaiti population may be appropriate.
The age-adjusted odds of diabetes and ≥3 CVD risk factors was higher per single unit increase for BMI compared with WHtR and WC. It has been argued that BMI is not always the best measure of obesity given that it is not an accurate indicator for individuals with extreme obesity(Reference Frankenfield, Rowe and Smith41); can overestimate the level of body fat among pregnant women(Reference Bosaeus, Andersson-Hall and Andersson42,Reference Cedergren43) and physically active individuals and athletes(Reference Provencher, Chahla and Sanchez44); or can underestimate the amount of body fat in the elderly(Reference Pasco, Nicholson and Brennan45). In a study comparing the gold standard dual X-ray absorptiometry with anthropometry, Day et al. (Reference Day, Kwok and Evans46) found that WC was more strongly correlated with dual X-ray absorptiometry, than WHtR and BMI. Therefore, there is an indication that the higher odds of co-morbidities with increasing BMI may be a presentation of our highly obese study population, especially among the Arab groups, given that the population mean of BMI seats around class 1 obesity (>30 kg/m2).
The optimal WC cut-off points in our study population were different from the IDF for Arabs and South Asians, especially among women. In contrast to IDF WC cut-off of 80 cm for Arab women, our findings of the optimal cut-off point of 93 cm for ≥3 CVD risk factors are in agreement with other studies from the Middle East and Mediterranean region(Reference Hamzeh, Bagheri and Pasdar38,Reference Mansour, Al-Hassan and Al-Jazairi47,Reference Ibrahim, Elamragy and Girgis48) . For men in the Arab group, the optimal WC for ≥3 CVD and individual risk factors such as diabetes were 106 cm and 97 cm, respectively. The findings suggest that the IDF-recommended WC threshold should be increased for Arab women to identify women with greater risk of diabetes and the MetS and eliminate the potential for overdiagnosis.
We also found that the optimal range of WC for predicting diabetes and ≥3 CVD risk factors amongst South Asian expatriates in Kuwait was 92 and 91 cm for men and 91 and 93 cm for women, respectively. Mohan et al. (Reference Mohan, Deepa and Farooq49) found that WC of 87 cm for men and 82 cm for women appear to be the appropriate cut-off point to identify cardiometabolic risk factors in urban Indians. Another study of British South Asians(Reference Tillin, Sattar and Godsland50) showed that equivalent rates of diabetes occur at lower obesity levels than the Caucasian cut-off of >102 cm for men and >88 cm for women, thus supporting the need for ethnic-specific cut-off values. However, given that the expression of cardiometabolic risks is not dependent on genetic factors alone, the moderating role of environment which shapes collective health and health-related behaviours is relevant too. As Kuwait has one of the highest burdens of obesity and physical inactivity globally, environmental predispositions orchestrating the burden of obesity and physical inactivity are likely to result in higher general and abdominal obesity, especially among women.
Our study also showed that the optimal WHtR cut-off was consistently above the recommended global value (0·50), especially for all sexes in the Arab group (0·55 men and 0·60–0·65 women). Ashwell & Hsieh(Reference Ashwell and Hsieh51) have proposed that WHtR could be a better, simple and rapid screening tool than BMI given that it is easier to measure and calculate, and the simple public health message of keeping the WC less than half of height is more intuitive. However, in South Asian men for both diabetes and ≥3 CVD risk factors, the exponential rise in the OR following a single unit increase in anthropometric indices, compared with Arab men, signifies potential higher morbidity/mortality among South Asians at lower WC, WHtR or BMI. Our findings support the existing evidence that Asians have an ethnic predisposition to adverse body fat distribution and the MetS at lower cut-off points for anthropometric indices(Reference Gupta, Gupta and Sarna52,Reference Nestel, Lyu and Low53) .
Studies suggest that fat distribution measured by WC or WHtR is more important than total body fat based on BMI for CVD(Reference Li, Chen and Chang54,Reference Janghorbani, Aminorroaya and Amini55) . The exponential increase in the OR and plateauing after the predicted cut-off points is more pronounced in South Asian women for WC and WHtR, than BMI. This finding may suggest that South Asian women tend to have a stable risk after the anthropometric cut-off point that predicts increased risk, given their predisposition to adverse body fat and CVD risk at lower cut-off points. The risk of CVD within a given WC strata has been shown to significantly differ between shorter and taller individuals(Reference Schneider, Klotsche and Silber56). Therefore, the contribution of height to WC may have influenced the shape of the relationship between WHtR and diabetes and ≥3 CVD risk factors in South Asian women compared with Arab women.
We further assessed the prevalence of the MetS as defined by IDF and AHA/NHLBI using the optimal WC derived from ≥3 CVD risk factor to compare with the IDF-recommended cut-off points for Arabs and South Asians. We found that irrespective of the definition used, the IDF-specified cut-off values led to a higher prevalence of the MetS than when the optimal WC cut-off is used. Evidence had shown that obesity does not invariably lead to adverse metabolic conditions such as diabetes, hypertension, dyslipidaemia and the MetS(Reference Primeau, Coderre and Karelis57,Reference Eckel, Alberti and Grundy58) Increasing evidence also indicates that the prevalence of metabolically healthy obesity differs considerably according to the WC cut-off values and the criteria used in defining the MetS(Reference Velho, Paccaud and Waeber59,Reference Pataky, Bobbioni-Harsch and Golay60) . Our predicted WC cut-off for abdominal obesity, which was higher, may be more accurate in delineating the metabolically healthy obese phenotypes in the population, thus reducing potential overdiagnosis.
Strengths and limitations of the study
The nationally representative study population and large sample size are important strengths of our study. Our comparison of Arabs and South Asians resident in Kuwait is unique and has not been previously reported. A limitation is the cross-sectional design, which precludes knowledge of temporality and causality in prognostic applications. The smaller proportion of South Asians with diabetes may have influenced the s-shaped non-linear relationship found in this subgroup.
Conclusion
This study shows that given their similar AUC, any of the anthropometric indices assessed here (WC, WHtR or BMI) could be used in screening for diabetes and ≥3 CVD risk factors in Kuwait. WC and BMI cut-points for screening ≥3 CVD risk factors in Arabs and South Asians in Kuwait were higher for women. The WHtR cut-point for screening ≥3 CVD risk factors was higher in women compared with men in the Arab group but not in the South Asian group, suggesting that the global cut-off of 0·5 may be acceptable for the South Asian group. Across Arab and South Asian groups, men had a higher prevalence of the MetS than women irrespective of the WC cut-off or MetS criteria used. This study provides Kuwait-specific anthropometric cut-off values and adds to the growing call for ethnic-based cut-points for classification and comparison of populations at risk of CVD.
Acknowledgements
We are grateful to the teams at the Dasman Diabetes Institute for their contributions in conducting this study.
We also thank the Kuwait Foundation for the Advancement of Sciences for providing funding to support this study. V. M. O., N. T. C. and M. D. conceived the objective of this study; N. T. C. and M. D. secured funding; S. A. and V. M. O. processed data; V. M. O. analysed data and drafted the manuscript; V. M. O., S. A., M. A., F. H. A., A. A., F. A., N. T. C. and M. D. reviewed manuscript for important intellectual content. All authors read and approved the final manuscript.
The authors declare that there are no conflicts of interest.


 Open access