


Introduction
In recent years, significant research efforts in biomedical imaging have focused on obtaining three-dimensional morphological and molecular structure at the whole-organ level. In connectome research, this approach has clear significance in that connections among neurons are critically related to neurological function [Reference Amunts1–Reference Xu3]. Medically, mapping immune biomarkers in three dimensions may lead to identification of patients who best respond to immune checkpoint inhibitor therapy (ICIT) [Reference Brahmer4–Reference Tsujikawa6]. Several tissue clearing techniques have been developed for biomedical imaging in three dimensions. An example is X-CLARITYTM (Logos Biosystems), which optically clears tissues for subsequent fluorescence labeling of thick tissues or, in some cases, entire organs of interest [Reference Kim7–Reference Pavlova9]. Combined with light-sheet microscopy, structural mapping of an entire animal mouse brain has been achieved. Although optical clearing techniques enable whole-organ labeling and imaging, these methods suffer from numerous disadvantages such as prolonged tissue clearing and labeling times and compromised structural resolution from the use of microscope objectives with relatively small numerical apertures [Reference Lee10,Reference Morawski11]. To address these issues, another paradigm is to section the organ of interest to obtain thin tissue slices for further processing such as optical clearing and labeling [Reference Zhu8,Reference Lee10,Reference Morawski11], however, this is a time-consuming process and reduces efficiency when reconstructing an organ in three dimensions.
In the case of diffusion, the effective label penetration depth is proportional to the square of the labeling time. Specifically, the one-dimensional diffusion process is described by the equation:

where < x2 > is the average of the square of probe penetration depth, D is the molecular diffusion constant, and t is the diffusion time [Reference Bian12]. Therefore, processing the organ of interest into thin sections prior to labeling significantly increases labeling efficiency. For example, diffusion across a 100 μm tissue section takes 10-4 the time that is required for a probe molecule to penetrate a 1 cm organ. Nevertheless, antibody labeling of a thin tissue section can still be time-consuming, and currently the standard approach is to leave the tissue section in the labeling solution in a trial-and-error fashion to find the optimal labeling conditions.
To enhance the labeling efficiency of tissue sections, we developed a bi-directional labeling device to compare the labeling efficiency on porcine liver slices to the standard uni-directional labeling approach. Diffusion of two commonly used probe molecules with distinct chemical properties was studied: DAPI, a hydrophilic DNA dye commonly used for nuclear labeling, and Nile Red, a lipophilic membrane probe.
Materials and Methods
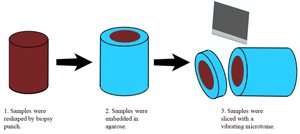
Figure 1 illustrates the sample preparation steps. Porcine liver acquired from a local market was cut into approximately 1 cm thick sections and fixed in 10% formalin (Avantor, Inc., Radnor, PA) at room temperature for approximately 24 hr. After fixation, the tissues were placed in phosphate buffered saline (PBS) and kept under refrigeration. Three-millimeter cylindrical punches of tissue were obtained with a Uni-Core™ punch (GE Healthcare Bio-Sciences Corp., Piscataway, NJ). The 3 mm tissue core was placed upright and surrounded by an acrylic holder 1 cm in diameter. Molten 2% agarose gel (A0576-100G, Sigma-Aldrich, St. Louis, MO) at 40–45°C was then dripped onto the tissue core and cooled under refrigeration for 30 min. The agarose embedded tissue core was then placed in a 1.6 cm diameter stainless steel holder designed for sectioning with a vibrating blade microtome (Compresstome®, Precisionary Instruments, Natick, MA). To obtain porcine liver sections, the Compresstome® sectioning thickness was set to 250 μm, and the agarose embedded tissue was sectioned while immersed in deionized water at 4°C. Upon sectioning, the tissue slice was immediately removed and placed in PBS at room temperature.

Figure 1: Porcine liver tissue handling process.
For uni-directional diffusion labeling (Figure 2(a)), a single well of a 48-well plate (SPL Life Sciences Co., Ltd., Pocheon, Korea) was filled with 1 ml PBS buffer, and the tissue section was then placed into the well. After the tissue section sank to the bottom of the well, the PBS was pipetted out and the labeling solution introduced to the well. In the bi-directional labeling geometry (Figure 2(b)), the tissue slice was positioned within a custom-made labeling chamber in which the liver section was sandwiched between the upper and bottom chambers, both filled with the labeling solution. For tissue labeling, 40 μM of DAPI (MW 350.3, Invitrogen, Carlsbad, CA) and 100 μM of Nile Red (MW 318.4, Sigma-Aldrich) were used. In all, six incubation periods of 5 min, 45 min, 130 min, 215 min, 12 hr, and 24 hr were applied to the liver sections. Incubation was performed under room temperature, and staining wells were held stationary and protected from light. The similar molecular weights of DAPI and Nile Red indicate that they have similar diffusion properties. At the end of the scheduled incubation period, the tissue slices were removed, washed with PBS, and imaged with a homemade multiphoton microscope (described below). To visualize the dye distribution, the stained liver sections were cut vertically to expose the dye distribution across the tissue cross sections. For each tissue section, three random sites were analyzed to determine mean staining depth and standard deviation.

Figure 2: (a) Uni-directional tissue slice labeling chamber and (b) bi-directional tissue labeling chamber geometry. Brown represents the tissue section surrounded by blue agarose. Blue arrows represent directions of dye diffusion.
At the end of the incubation period, a time window was needed to process the tissue section for multiphoton imaging, therefore an additional tissue processing time constant tp was applied to Equation (1). During tp, remnant probe molecules in the tissue slices can diffuse and interact further with the tissue constituents, resulting in greater dye penetration depth than that predicted by Equation (1). As a result, Equation (1) was modified to include the effect of tp (Equation (2))

A comparison of Equations (1) and (2) shows that tp is simply the x-intercept of a plot of < x2 > as a function of t (Equation (1)).
Our imaging system consists of an inverted microscope (TE2000U, Nikon, Japan) with a titanium-sapphire (Ti:Sapph) diode-pumped laser (Tsunami®, Spectra Physics, Santa Clara, CA) and a solid-state laser operating at 532 nm (Millennia® Pro, Spectra Physics). The 780 nm output of the Ti:Sapph laser was used as the excitation source. Upon reflection from a galvanometer-driven x-y scanning system (6215M, Cambridge Technology, Watertown, MA), the laser was beam-expanded and reflected into the focusing objective (S Fluor, 20×/NA 0.75, Nikon) by a primary dichroic mirror (720 dcspxr, Chroma Technology, Bellows Falls, VT). Laser power at the sample was approximately 40–50 mW for DAPI-stained samples and 20 mW for Nile Red-labeled specimens. We used blue fluorescence for detecting DAPI and red fluorescence for Nile Red. Single-photon counting photomultipliers (R7400P, Hamamatsu, Hamamatsu City, Japan) were used to detect emitted photons.
Results and Discussion
Cross-sectional fluorescence intensity distribution patterns of DAPI and Nile Red at different timepoints under uni- and bi-directional diffusion are shown in Figure 3. Qualitatively, with increased incubation time, the dye molecules penetrated deeper into the tissue section. Moreover, it is evident that dye penetration is more efficient in the bi-directional geometry. Specifically, at 215 min, DAPI has nearly penetrated the entire tissue slice, whereas uni-directional diffusion of DAPI across the tissue section was not noticed until 24 hr after incubation. On the other hand, while Nile Red penetration is nearly complete at the 215-minute timepoint for both incubation geometries, earlier timepoints show greater efficiency in Nile Red labeling. Since DAPI and Nile Red have similar MW (~300), the difference in diffusion efficiency between the two types of molecules is most likely due to Nile Red targeting cellular membranes. Since hepatocytes are tightly packed, the close proximity of plasma membranes of adjacent hepatocytes may favor the diffusion of Nile Red over DAPI.

Figure 3: Time-lapse imaging of cross sections of DAPI- or Nile Red-labeled porcine liver slices by uni-directional and bi-directional diffusion. Each row of four images represents a labeling time noted above the row. Notice that with bi-directional diffusion, labels penetrate the tissue faster.
Next, we plotted representative normalized probe fluorescence distribution profiles for DAPI (Figure 4) and Nile Red (Figure 5) for both uni- and bi-directional labeling geometries at the selected timepoints of 130 min and 24 hr. With uni-directional labeling in which the tissue section is in contact with the bottom of the labeling chamber, diffusion efficiency is significantly hindered, as only 30% or less of the intensity is registered at the bottom of the section when compared to the top. Differences in labeling efficiency between the top and bottom decreased with increased incubation time. Although a fluorescence intensity gradient was observed for DAPI (Figure 4), the Nile Red profiles (Figure 5) demonstrated similar labeling efficiency between the top and bottom of the section. To further quantify the efficiencies of the labeling geometries for the two chemically distinct probe molecules, we estimated the effective diffusion distance as a function of time. For DAPI-labeled samples, we computed the effective diffusion distance from both the top and bottom surfaces to where the probe fluorescence intensity was decreased to a threshold defined as 10% of the peak value at the respective surfaces. For Nile Red, this threshold was set to 20% of the peak value. The choice of selecting different threshold values for DAPI and Nile Red was motivated by the observation that Nile Red penetrated faster than DAPI, and we wanted to analyze diffusion at similar depths in the tissue for a given labeling time such that the relative diffusion efficiency of the two dyes could be compared. This was performed as if probe molecules had diffused from the top and bottom sides and had not reached the same position within the tissue. Hence, estimation of diffusion length using Equation 1 is justified. The results for DAPI and Nile Red are shown in Tables 1 and 2, respectively.

Figure 4: Time-dependent fluorescence intensity profiles of DAPI through (a) uni- and (b) bi-directional diffusion. Top and bottom refer to the two surfaces of the tissue section.

Figure 5: Time-dependent fluorescence intensity profiles of Nile Red through (a) uni- and (b) bi-directional diffusion. Top and bottom refer to the two surfaces of the tissue section.
Table 1. Uni- and bi-directional diffusion of DAPI.

Table 2. Uni- and bi-directional diffusion of Nile Red.

By defining xrms as the root mean square of position x, we plotted the xrms2 (< x2 >) as a function of time for the top surface of the uni-directional geometry and for the average of the top and bottom surfaces of the bi-directional geometry in Figure 6. The linearity of the plots shows that Equation (1) is a good model for describing molecular transport in our diffusion geometries. Additionally, note that in each case the tissue processing and imaging time constant tp was needed. For a set of diffusion data with four different labeling times (t): 5 min, 45 min, 130 min, and 215 min, the graph of xrms2 as a function of t are shown in Figure 6. By applying a linear fit (Equation (2)), we found that tp varied between 9.4 and 30.1 min.

Figure 6: Plot of xrms2 as a function of time with (a) DAPI uni-directional diffusion, (b) DAPI bi-directional diffusion, (c) Nile Red uni-directional diffusion, and (d) Nile Red bi-directional diffusion.
Conclusions
In this work, we investigated the labeling efficiency of hydrophilic DAPI and hydrophobic Nile Red fluorescent probes in porcine liver slices. Multiphoton imaging was performed on cross sections of the slices after diffusion by uni- and bi-directional geometries. We found that bi-directional diffusion significantly enhanced the penetration of probe diffusion efficiency and that diffusion most accurately describes the labeling process. However, we found that after removal of the tissue slices from the labeling solutions, residual probe molecules in the tissue sections continue to be transported resulting in the labeling of additional tissue constituents. Our study supports the use of bi-directional labeling for enhanced efficiency in the labeling of thick tissues for applications in connectome and other biomedical topics in which structural information in three dimensions is needed.
Acknowledgement
This work was supported by the Ministry of Science and Technology, Taiwan, Republic of China (MOST 107-2112-M-002-023-MY3).


