


Introduction
From the first combustibles, black pigments and adsorbents to steels, reinforced composites, lubricants, refractories, bio-friendly platforms, and miniaturized electronic components, carbon-based materials represent a truly fascinating and challenging class of materials both from fundamental and applicative points of view. The origin of diversity in properties and applications lies within the manners in which carbon matter is organized at multiple scales. Carbons are conventionally classified after their dominant type of chemical bond and their crystalline structure such as sp 3-rich nanodiamonds, sp 2-rich crystalline carbons such as graphite, graphenes, carbon nanotubes, nanofibers, even sp-rich carbynes, and intermediates such as fullerenes and the sp 2/sp 3 amorphous carbons (Falcao & Wudl, Reference Falcao and Wudl2007; Hirsch, Reference Hirsch2010; Inagaki et al., Reference Inagaki, Kang, Toyoda and Konno2014). At larger scales, various nano-textures and micro-textures can be obtained by different assemblies of the carbon building blocks giving rise to highly oriented structures, hierarchic materials or random networks such as nano-foams, gels and complex composites (Georgakilas et al., Reference Georgakilas, Perman, Tucek and Zboril2015). In this respect, it is worth mentioning two important challenges that consist in: (i) developing robust techniques that can manipulate the carbon-based material or composite at multiple levels of organization so to achieve enhanced functional properties such as electrical conductivity, mechanical strength, or thermal and chemical stability, and (ii) finding appropriate methods to characterize these multiscale changes (Gnanasekaran et al., Reference Gnanasekaran, De With and Friedrich2016).
The high-temperature-assisted graphitization process is one of the most important examples of mechanisms through which both structural conversion and building block assembly can be influenced. Some types of carbon feedstock can be directly converted into graphites by applying high temperature pyrolysis—also known as graphitizing materials or soft carbons, while others require extreme conditions to reach the modest level of graphitization: the nongraphitizing materials or hard carbons (Inagaki et al., Reference Inagaki, Kang, Toyoda and Konno2014). Nevertheless, an extended range of experiments with different types of metals such as Fe, Ni, Co, and carbides turns to be very useful not only for achieving multiple functionalities in different applications but also for the efficient conversion of the raw carbon feedstock to new graphitic nanostructures in a process known as catalytic, heterogenous graphitization (HG) (Weisweiler et al., Reference Weisweiler, Subramanian and Terwiesch1971; Maldonado-Hódar et al., Reference Maldonado-Hódar, Moreno-Castilla, Rivera-Utrilla, Hanzawa and Yamada2000). Recently, it was shown that once activated, the metal nanocatalysts could abruptly increase the graphitization yields in less extreme conditions even for hard-graphitizing materials, paving the way to enhanced electric conductivity, mechanical strength, and chemical or thermal stability (Sevilla & Fuertes, Reference Sevilla and Fuertes2006; Zhai et al., Reference Zhai, Du, Li, Zhu and Kang2011; Kiciński et al., Reference Kiciński, Norek and Bystrzejewski2013).
Among the aforementioned sub-classes, the amorphous carbon gels (i.e., xerogels, aerogels, and cryogels) represent a popular route for obtaining carbon networks with tunable density, porosity, electron conductivity, being also thermally and chemically stable, with demonstrated patterning and miniaturization features (Maldonado-Hódar et al., Reference Maldonado-Hódar, Moreno-Castilla, Rivera-Utrilla, Hanzawa and Yamada2000; Al-Muhtaseb & Ritter, Reference Al-Muhtaseb and Ritter2003; Moreno-Castilla & Maldonado-Hódar, Reference Moreno-Castilla and Maldonado-Hódar2005; Sharma et al., Reference Sharma, Verma, Kulkarni, Upadhyay and Sharma2010). Such networks can be obtained by following a sol-gel synthesis based on phenols and formaldehyde, a subsequent solvent removal through different procedures, drying and a final pyrolysis treatment to yield porous carbons. Graphitic structures with stacking heights smaller than 5 nm were obtained only when high temperatures close to 2,600°C were reached (Théry et al., Reference Théry, Béguin, Kocon, Lillo-Rodenas, Linares-Solano and Rouzaud2004). However, in binary carbon-metal xerogel or aerogel composites, several studies confirmed that under certain conditions, catalyzed graphitization using Fe nanoparticles (as well as Ni, Co, etc.) led to the formation of a complex system of intertwined sp 2 carbon nanostructures such as nanoshells, ribbons, and nanofibers within the amorphous support (Maldonado-Hódar et al., Reference Maldonado-Hódar, Moreno-Castilla, Rivera-Utrilla, Hanzawa and Yamada2000; Hasegawa et al., Reference Hasegawa, Kanamori and Nakanishi2012; Kiciński et al., Reference Kiciński, Norek and Bystrzejewski2013). Furthermore, studies were performed on the impact of the different parameters influencing HG and related processes: type of carbon feedstock (Kiciński et al., Reference Kiciński, Dembinska, Norek, Budner, Polański, Kulesza and Dyjak2017), metal catalyst (Maldonado-Hódar et al., Reference Maldonado-Hódar, Moreno-Castilla, Rivera-Utrilla, Hanzawa and Yamada2000; Cotet et al., Reference Cotet, Gich, Roig, Popescu, Cosoveanu, Molins and Danciu2006; Carrott et al., Reference Carrott, Marques and Carrott2010; Liu et al., Reference Liu, Lv and Tan2013), metal precursors (Cotet et al., Reference Cotet, Gich, Roig, Popescu, Cosoveanu, Molins and Danciu2006), the catalyst concentration (Hasegawa et al., Reference Hasegawa, Kanamori and Nakanishi2012; Kiciński et al., Reference Kiciński, Norek and Bystrzejewski2013), and the pyrolysis conditions (Maldonado-Hódar et al., Reference Maldonado-Hódar, Moreno-Castilla, Rivera-Utrilla, Hanzawa and Yamada2000).
Recently, resorcinol–formaldehyde (RF)-derived xerogel nanocomposites based on carbon with integrated Bi and Fe nanoparticles (C–Bi–Fe) were introduced as multifunctional materials able to electrochemically detect both heavy metals (Pb2+) and biomarkers (H2O2) (Fort et al., Reference Fort, Rusu, Pop, Cotet, Vulpoi, Baia and Baia2021b). Bismuth, a non-graphitizing element, was initially chosen for applicative reasons. Its main functionality is based on its ability to form fusible alloys with heavy metals such as Pb and Cd, that further translated into highly sensitive electrochemical sensors relevant in the assessment of water quality and other environmental analyses (Jovanovski et al., Reference Jovanovski, Hočevar and Ogorevc2017). The integration of Bi into C–Bi–Fe nanocomposites attracted even more interest by opening new perspectives in the synthesis of bismuth iron oxide (BFO) structures, as peculiar BFO hybrid nanoparticles were observed in C–Bi–Fe xerogels with different iron concentrations (Fort et al., Reference Fort, Rusu, Cotet, Vulpoi, Florea, Tuseau-Nenez, Baia, Baibarac and Baia2021a). Nanostructured Fe components, including both oxidized and metallic states, were a natural choice considering their multiple features: magnetic, electro-optic, or adsorptive response, low cytotoxicity and their peroxidase mimicking features (Jin et al., Reference Jin, Wu, Ye and Ying2019). During earlier studies, changes in the composition, structure, and morphology of similar nanocomposites were investigated after variations in chemical synthesis (Fort et al., Reference Fort, Rusu, Cotet, Vulpoi, Florea, Tuseau-Nenez, Baia, Baibarac and Baia2021a, Reference Fort, Rusu, Pop, Cotet, Vulpoi, Baia and Baia2021b) and drying steps were performed (Rusu et al., Reference Rusu, Fort, Cotet, Vulpoi, Todea, Turdean, Danciu, Popescu and Baia2018), however we are unaware of any studies performed on the graphitization related activity and the pyrolysis effects met in ternary C–Bi–Fe systems.
Therefore, the aims of the present study are first to highlight both the Fe-catalyzed graphitization mechanism in complex nanocomposite systems by using transmission electron microscopy-derived data and from other complementary techniques, and second, to monitor the temperature-induced phenomena in C–Bi–Fe nanocomposite materials during the pyrolytic evolution stages. First, a thermogravimetric analysis (TG/DTG) was conducted to outline the thermal events occurring in the dried RF–Bi–Fe nanocomposite at elevated temperatures (up to 1,100°C), followed by a morphological and structural investigation of C–Bi–Fe samples obtained under different pyrolysis conditions (type of atmosphere, final temperature, monolithic/powder state, and use of intermediate treatments). The analysis of the C–Bi–Fe systems highlights the occurrence of uncommon BFO hybrid nanoparticles, the phase transformations taking place at elevated temperatures, and the particularities found in a heavily graphitized sample. Moreover, detailed in situ heating TEM experiments allowed the real-time analysis of the system dynamics, mainly the nanoparticle formation and growth, and the occurrence of any graphitization phenomena under vacuum conditions. The results obtained offer a solid background and valuable support for the future characterization and engineering of carbon gels and their nanocomposites.
Materials and Methods
Reagents
Unless otherwise indicated, reagents were purchased from Sigma-Aldrich and were used without any further purification: resorcinol (m-C6H4(OH)2, 99%), formaldehyde solution (37 wt% in H2O, stabilized with methanol, Chem-Lab), bismuth (III) nitrate pentahydrate [Bi(NO3)3⋅5H2O, 98%, Alfa Aesar], glacial acetic acid (CH3COOH, 99.7%), anhydrous iron (II) acetate (Fe(OOCCH3)2, minimum Fe content 29.5%), ammonium hydroxide water solution (NH4OH, 10 wt%), glycerol formal (47–67% 5-hydroxy-1,3-dioxane, 33–53% 4-hydroxymethyl-1,3-dioxolane). All reagents were of analytical grade. Bidistilled water was used for the preparation of all solutions.
Synthesis of C–Fe–Bi Xerogel Ternary Composite
Resorcinol (2.00 g) was introduced under intense stirring at room temperature to a solution produced by dissolving Bi(NO3)3⋅5H2O (1.20 g) into glycerol formal (10 mL). Formaldehyde (2.72 mL) was further added to the obtained orange solution. Ammonium hydroxide (10%, 4 mL) and glacial acetic acid (12 mL) were sequentially added to the solution followed by iron (II) acetate (1.2 g). For another 10 min, the solution was blended and then transferred in a sealed glass container that was held for 72 h at 60°C. The as-obtained organic gel impregnated with Bi3+ and Fe2+ metal ions was rinsed several times with acetic acid and ethanol. Next, the gel was dried in air at room temperature for 3 days to obtain a xerogel sample (further denoted as sample “A0”). A sample with clear signs of graphitization as evidenced by XRD and TEM analyses (further denoted as sample G) was obtained by following the same synthesis, only with lower iron (II) acetate content (0.06 g) (Fort et al., Reference Fort, Rusu, Pop, Cotet, Vulpoi, Baia and Baia2021b).
After performing a TG/DTG analysis on sample A0, pyrolysis experiments were performed in quartz tubes under inert gas purge, using a heating rate of 3°C/min to reach the final plateaus chosen between 600 and 1,050°C, where the samples were kept for 60 up to 120 min. To explore the reductive effects of different environments at various temperatures, three sets of experiments were considered:
(i) set A: the main pyrolysis experiments yielding samples denoted “A1” (Ar purge, at 600°C), “A2” (N2 purge, 750°C), and “A3” (N2 purge, 1,050°C). The graphitized sample G follows the same pyrolysis treatment as sample A3 and is included in this set of experiment as a reference. All samples include a pretreatment at 250°C, consistent with previous studies (Rusu et al., Reference Rusu, Fort, Cotet, Vulpoi, Todea, Turdean, Danciu, Popescu and Baia2018; Fort et al., Reference Fort, Rusu, Cotet, Vulpoi, Florea, Tuseau-Nenez, Baia, Baibarac and Baia2021a, Reference Fort, Rusu, Pop, Cotet, Vulpoi, Baia and Baia2021b).
(ii) set B: secondary experiments based on pretreatments under N2 purge followed by pyrolysis under a more reductive gas composition (95% Ar + 5% H2). The samples obtained at different temperatures are denoted “B1” (at 600°C), “B2” (at 750°C), and “B3” (at 900°C). The letter “p” is added to the sample notation when the xerogels are processed as powders prior to the thermal treatment.
(iii) set C: secondary experiments based on pyrolysis under Ar purge at 1,050°C yielding sample “C1” (pretreatment included) and “C2” and “C2p” (without pretreatment).
The Ar, N2, and mixed Ar/H2 were selected due to their different reactivity with oxygen species. The details of the three sets of pyrolysis experiments are summarized in Table 1.
Table 1. Investigated Samples Obtained Through Different Pyrolysis Programs.

Characterization Techniques
Thermogravimetric analysis (TG-DTG) was performed using a NETZSCH STA 409 PC/PG thermal analyzer. The powdered sample was placed in an alumina crucible and subjected to a 10°C/min heat increase from room temperature up to 1,100°C under N2 atmosphere using a 0.5 mL/min flow. X-ray diffraction (XRD) measurements were performed on powdered samples after pyrolysis with a Shimadzu 6,000 diffractometer using Cu-Kα radiation (λ = 1.5406 Å) equipped with a rear-side graphite monochromator. Raman spectra were recorded with a Renishaw in Via Reflex Raman Microscope equipped with a Ren Cam CCD detector. The 532 nm laser was used as the excitation source, and the spectra were collected using a 0.4 NA objective of 20× magnification. For the line profile scans, typical integration times of 20 s were used, and the laser power was 200 mW. The Raman spectra were recorded with a spectral resolution of 4 cm−1. The morphological and structural characterization of the pyrolyzed materials were performed using a FEI Tecnai G2-F20 microscope operating at 200 kV accelerating voltage and a Titan-Themis operating at 200 kV equipped with a Cs probe corrector and a SuperX detector that allowed chemical analyses via energy-dispersive X-ray spectroscopy (EDX) of light and heavy elements with a spatial resolution within picometer range. The experimental conditions were set so that the total current within the probe used for the STEM-HAADF -EDX chemical analysis was about 85 pA. For the STEM-HAADF-EDX chemical mapping, we selected characteristic X-ray energies for carbon with Kα = 0.277 keV, oxygen with Kα = 0.523 keV, bismuth with L = 10.839 keV and iron Kα = 6.401 keV. The STEM-HAADF images were recorded using a camera length of 110 mm where the intensity of the recorded STEM-HAADF image reflects variation of the average atomic number Z of the probed element.
The real-time in situ heating TEM experiments were performed using an environmental transmission electron microscope (Titan ETEM called "NanoMAX") operating at 300 kV equipped with a Cs image corrector, an UltraScan 2k × 2k CCD camera and a direct electron K2 camera. All in situ observations were done using the Protochips Fusion sample holder (Feng et al., Reference Feng, Chee, Sharma, Liu, Xie, Li, Fan and Jiang2011). For all the experiments, we used specific heating membranes with SiNx windows provided with the sample holder. The temperature is controlled by the sample holder and all the indicated temperatures are based on the company provided calibration. Prior to the in situ experiment, a freshly powdered organic xerogel (sample A0) was dispersed in ethanol and a drop of solution was deposited on the surface of the SiNx window and left to dry. At the beginning of the experiment, the sample was progressively heated using a 5°C/min step to 100, 250, 450, and 600°C, each step followed by 15–30 min stabilization period, during which different regions were imaged in a conventional bright-field (BF) mode. After the dwell at 600°C, the final 15 min plateaus were reached at 750, 800, and 900°C using a 50°C/min heating rate. The corresponding TEM micrographs and videos were acquired using the UltraScan 1000 Gatan CCD. For the videos, we used a speed rate of 4 fps. The gathered data was analyzed using image processing tools for particle size distribution and particle tracking algorithms (Tinevez et al., Reference Tinevez, Perry, Schindelin, Hoopes, Reynolds, Laplantine, Bednarek, Shorte and Eliceiri2017). Prior to particle tracking procedure, the videos were pre-processed using drift correction algorithms (Sugar et al., Reference Sugar, Cummings, Jacobs and Robinson2014). The results were further treated in FIJI software (Schindelin et al., Reference Schindelin, Arganda-Carreras, Frise, Kaynig, Longair, Pietzsch, Preibisch, Rueden, Saalfeld, Schmid, Tinevez, White, Hartenstein, Eliceiri, Tomancak and Cardona2012) for contrast enhancement and noise reduction to optimize particle detection during the segmentation and tracking algorithms. The particle size distributions were estimated at the beginning and end of each video sequence (Supplementary Videos V1–V3), while the nanoparticle motion relative to the carbon support was analyzed in terms of trajectory length, average velocity, and maximum velocity recorded during motion.
For the tomography studies, the acquisition of the tilt series was performed in BF mode using a Titan-Themis 300 transmission electron microscope, the serial EM acquisition software, and a 4,096 × 4,096 pixels cooled CMOS Ceta camera. The tomography software allows for an automatic variation of the tilt angle step by step, a correction of the focus of the image and the preservation of the object under study within the field of view. The tilt angle was varied in a range of −59° to +51°, with an image recorded every 2° giving a total of 56 images with a total acquisition time of about 10 min. The data treatment of the tilt series for preliminary image processing procedure was performed using the IMOD software (Mastronarde, Reference Mastronarde1997). The volume reconstruction was obtained using 10 iterations of the algebraic reconstruction technique algorithm (ART) (Gordon et al., Reference Gordon, Bender and Herman1970) implemented in the TOMOJ software (MessaoudiI et al., Reference MessaoudiI, Boudier, Sorzano and Marco2007).
Results
Thermal Analysis and the Post-Pyrolysis Characterization of C–Bi–Fe Nanocomposite
The TG-DTG analysis was performed on the xerogel composite obtained after the rinsing and drying steps (sample A0) to identify the temperature domains where the main thermal processes occur. In Figure 1, the presented thermogravimetric curve and the corresponding time derivative indicate several weight loss events taking place between room temperature and 1,100°C. Below 250°C, the RF gels are characterized by two thermal events leading to an overall mass loss of about ~24.5%, ascribed to water desorption, cross-linking reactions, and metal precursor decomposition (Pinheiro et al., Reference Pinheiro, Pereira de Abreu Filho, Galembeck, Correa da Silva and Vargas1987; Lin & Ritter, Reference Lin and Ritter1997; Yoshimune et al., Reference Yoshimune, Yamamoto, Nakaiwa and Haraya2008; Laurikėnas et al., Reference Laurikėnas, Barkauskas, Reklaitis, Niaura, Baltrūnas and Kareiva2016). The following ~37.5% mass loss events between 230 and 750°C are most significant as they relate to the progressive degradation of the sol-gel-derived polymeric chains through cleavage of C–O and C–H bonds (visible DTG signals at 315 and 560°C) (Lin & Ritter, Reference Lin and Ritter1997; Yoshimune et al., Reference Yoshimune, Yamamoto, Nakaiwa and Haraya2008). Beyond 600°C, processes such as metal oxide reduction (Cypres & Soudan-Moinet, Reference Cypres and Soudan-Moinet1980; Cyprès & Soudan-Moinet, Reference Cyprès and Soudan-Moinet1981; Guenther et al., Reference Guenther, Theissmann and Guillon2014) and potential losses of Bi will contribute to the ongoing pyrolysis of the carbonaceous support to yield a 23.6% weight loss.

Fig. 1. TG/DTG curves obtained during the thermal analysis of sample A0 (dried xerogel).
The global crystalline phase changes induced during the main pyrolysis experiments are reflected in the XRD profiles shown in Figure 2. One can observe for all samples a very broad signal in the range 2θ = 15°–35°, which corresponds to the vitreous carbon support. After applying 600°C treatment (sample A1), amorphous and crystalline signals are detected around 2θ = 30°, matching the development of β-Bi2O3 phase (AMCSD-0017238). For the sample treated at 750°C (sample A2), the broad feature highlighted at 2θ = 44° is linked with the (100) planes formed in sp 2 type carbons and graphite (AMCSD-0000049) and denotes the carbonization of the RF support. Additional crystalline contributions of γ-Fe2O3/Fe3O4 (AMCSD-0007898 and -0000945) and some features tracing to mullite Bi2Fe4O9 (AMCSD-0010664) are observed. At higher pyrolysis temperatures (1,050°C, sample A3), the main bismuth oxide contributions disappear, while new signals attributed to metallic Bi phase (AMCSD-0011254) are evidenced. During such pyrolysis treatments, the iron oxide phases continue to develop in parallel with co-existing metallic γ-Fe phase (AMCSD-0019406).

Fig. 2. X-ray diffraction profiles obtained for nanocomposite samples A1 (treated at 600°C), A2 (750°C), and A3 (treated at 1,050°C) and the graphitized G sample.
No clear graphitization signals are observed for the investigated nanocomposite monoliths. However, the XRD profile of sample G, obtained using the same synthesis protocol but lower Fe precursor concentrations (Fort et al., Reference Fort, Rusu, Pop, Cotet, Vulpoi, Baia and Baia2021b) revealed a strong signal at 2θ = 25.75 which is ascribed to (002) planes in graphitic carbons. Notably, even if the Bi precursor concentration was kept constant during the entire synthesis procedures (Fort et al., Reference Fort, Rusu, Pop, Cotet, Vulpoi, Baia and Baia2021b), no clear Bi signals were detected for sample G, while Fe signals were found both as metallic γ-Fe and oxidized (γ-Fe2O3/Fe3O4) reflections. The XRD profiles of the samples obtained during other pyrolysis experiments, where different reduction conditions were explored in Ar + 5% H2 atmospheres (Supplementary Fig. S1) and Ar (Supplementary Fig. S2), are detailed in the Supplementary material.
The morphological and structural changes produced at 750°C and 1,050°C were investigated by means of electron microscopy-based techniques such as low magnification STEM-HAADF-EDX, HR-TEM, and electron diffraction. As observed in Figure 3a, the pyrolysis at lower temperatures resulted in spheroidal NPs having a bi-modal size distribution roughly between 5 and 50 nm. From the STEM-HAADF micrographs of sample A2, we observed a double contrast in the larger 20–50 nm NPs, suggesting a Janus-like inhomogeneous composition. The corresponding STEM-HAADF-EDX maps illustrate that the nanoparticles are mainly composed of Bi, bright zones, while Fe is specific to the dim regions. Further results that link hybrid NPs with BFO compositions and structures are provided in SuppIementary Figure S3. The effect of the applied pyrolysis treatments on TEM-derived particle size distributions is also analyzed under Supplementary Figure S4.

Fig. 3. STEM-EDX investigations of C–Fe–Bi xerogel composites obtained after pyrolysis at various temperatures: (a) sample A2 (750°C), (b) sample A3 (1,050°C), and (c) sample G and (d) SAED patterns for samples A1 (600°C), A2 (750°C), A3 (1,050°C), and G (1,050°C). The EDX maps reflect the elemental distribution of C (red), O (green), Bi (blue), and Fe (orange) elements inside the monolithic composites.
As observed for sample A3, Z-contrast STEM micrographs complemented by EDX mapping (Fig. 3b) was again highly useful for discriminating between the Bi (bright NP features) and Fe components (dim NP features) found after applying treatments at 1,050°C. By analyzing different regions, it is revealed that the A3 sample contains a wide range of NP dimensions. More homogeneous nanoparticles based on Fe are well evidenced, while Bi-based NPs and BFO hybrids have a lower occurrence relative to sample A2. No graphitized structures were evidenced for composite sample A3, however, a closer analysis of individual Fe nanoparticles (Fig. 3b and Supplementary Fig. S3b) reveals a ~3 nm thin shell with dim features. The shell was suspected to originate from surface oxidation, however the EDX maps revealed the shell consists of Fe and C atoms, which suggests that C diffusion takes place at the surface of Fe NPs.
By comparison, the micrographs obtained for sample G (Fig. 3c) present textural deviations from the original xerogels mainly due to the presence of a complex network of carbon nanostructures coexisting with the amorphous carbon phase and the metal/oxide nanoparticles. As observed from the elemental distribution maps, the nanoparticles present a Fe-rich composition, while the Bi contributions are negligible. The inhomogeneous distribution of oxygen confirms that both metal and oxide nanoparticles coexist in the G sample. The HR-(S)TEM micrographs of the sample G reveal the presence of graphitic structures of 8–14 nm thick with an interplane distance of 3.4–3.6 Å specific to turbostratic carbons. The findings evidence that Fe plays the catalyst role in the graphitization mechanism, while Bi compounds are known to be ineffective graphitization catalysts (Weisweiler et al., Reference Weisweiler, Subramanian and Terwiesch1971; Oya et al., Reference Oya, Yamashita and Otani1979).
The structural changes induced through pyrolysis to the carbon support are reflected also in the SAED patterns shown in Figure 3d. From the patterns recorded using similar conditions, one can observe that after pyrolysis at 600°C (A1), no clear diffraction rings specific to carbon are distinguished. Starting with the 750°C treatment (A2), one can observe the emergence of two rings with similar intensities corresponding to ~2.0 and ~1.2 Å interplanar distances. The rings are ascribed to the (100)/(101) and (110)/(112) planes found in graphene, fullerene, and other sp 2 carbon-derived structures (Czigány & Hultman, Reference Czigány and Hultman2010). Furthermore, the enhanced crystallinity due to the graphitization mechanism at 1,050°C (G) is marked by the appearance of a high intensity ring (~3.4 Å) and another with low intensity (~1.7 Å) due to diffraction from the (002) and (004) planes in graphite nanocrystals and stacked sp 2 nano-carbons (Czigány & Hultman, Reference Czigány and Hultman2010).
Thus, it can be concluded that graphitization activity took place in the entire mass of the sample G, as specific signs are observed at multiple scales (HR-TEM, SAED, and XRD). Interestingly, such features were not observed for the A1–A3 samples even though higher catalyst content was present.
Composite Evolution During In Situ Heating TEM Experiments
The thermal evolution of the as-synthesized sample “A0” was further investigated by in situ heating inside the TEM experiment under vacuum conditions to evaluate if and how the micro-structures of samples A1–A3 can transit toward graphitized networks such as the ones observed for sample G. The evolution of one of the investigated C–Bi–Fe aggregates can be observed at various temperatures in Figure 4. The obtained results confirmed that in the thermal range between room temperature and 250°C, when processes such as water desorption, cross-linking reactions, and metal precursor decomposition take place, no significant morphological and structural changes were evidenced (Fig. 4a). During the temperature increase from 250 to 750°C, small nanoparticles start developing as dark features in isolated regions of the C–Bi–Fe aggregates (Supplementary Fig. S5). At 600°C, well-dispersed nanoparticles with sizes between 5 and 10 nm are clearly evidenced (Fig. 4a). No particle motion or traceable displacements were detected. By the time, the 750°C plateau is reached (Fig. 4b, left), spheroidal nanoparticles are formed within the xerogel aggregate, showing similarities with the pyrolysis experiments previously presented (see Fig. 3).

Fig. 4. BF-TEM micrograph sequences, nanoparticle size distributions and detected trajectories observed during in situ TEM experiment: (a) C–Bi–Fe aggregate at 250 and 600°C, (b) BF-TEM image extracted at 750°C, when a bi-modal distribution of nanoparticles typical for metal and oxide Bi and Bi–Fe composites is observed along with incipient splitting and graphitization processes, (c) BF-TEM image at 800°C and (d) during transition from 800 to 900°C, when the disappearance of small 5 nm nanoparticles is observed along with the migration of large droplet-like nanoparticles and an intense graphitization activity, (e) at 900°C after the maximum activity is observed.
In the particle size distribution, the primary mode is given by nanoparticles with a narrow peak at 9 nm, while the second contribution is given by nanoparticles with a much broader size range. During this quench time, the first nanoparticle movements, that is, translation and splitting were detected at scales of 101–102 nm, as observed in Supplementary Video S1. A small fraction of particles with larger diameters were displaced as illustrated in the nanoparticle trajectory map in Figure 4b (right). The same video footage discloses the first heterogeneous graphitization event during which a nanoparticle escapes the body of the nanocomposite aggregate. The nanoparticle exhibits an accelerated motion while undergoing a liquid/jellyfish shape shift during expulsion. After performing this curvilinear path across approximately 35 nm in the projected XY-plane, the motion of the nanoparticle is inhibited throughout the ongoing stages until the metallic core disappears at higher temperatures.
As temperature rises from 750 to 800°C, coalescence through Ostwald ripening takes place. The number of large 20–60 nm sized NPs increases (Fig. 4c), while the fraction of 5–10 nm NP is abruptly lost. Even though coalescence was initially expected to contribute to this, the main role is expected to be played by evaporation and sublimation of nanosized Bi2O3 under high temperature and vacuum conditions (Guenther et al., Reference Guenther, Theissmann and Guillon2014). During the dwell at 800°C, the average nanoparticle size is around 22 nm. Scattered textural changes associated with the growth of carbon nanostructures are observed. In Supplementary Video S2, the presence of liquid-like shape shifting nanoparticles with increasing displacement and velocities is observed, as well as in the corresponding trajectory map presented in Figure 4c.
During the thermal transition from 800 to 900°C (Supplementary Video S3), the NP mobility further expands, while the carbon support evidences a significant textural change in the regions where movement occurs. As presented in Figure 4d, the NP size distribution narrows. A larger number of accelerating nanoparticles is detected (Fig. 4d), with a maximum reached during the transition from 800 to 900°C (Supplementary Video S3). Simultaneously, the changes in texture are evidenced for the entire region and multiple nanoparticles also escape the contour of the C–Bi–Fe aggregate leaving behind short trails of 60–90 nm (Supplementary Fig. S6a). By analyzing the NP movement through particle tracking and observing the textural change from Supplementary Video S3, it is reasonable to state that NP movement correlates with the texture change. Further on, through HR-TEM investigations performed on multiple sites (i.e., Supplementary Fig. S6b), it is confirmed that the textural change is mainly due to the crystalline contrast in carbon nanostructures obtained through the Fe-catalyzed graphitization. The graphitized regions expand throughout the entire mass of the composite grain forming a complex network of graphitic structures, as the ones found in sample G. These are valuable observations that evidence that the graphitization mechanism can be activated in A0 type carbon nanocomposites.
During the hold at 900°C (Supplementary Video S3), the system approaches a stationary state, while some of the existing nanoparticles are removed from the system. As reflected in the particle size distribution (Fig. 4e), the nanoparticles tend to shrink. The average size drops to around 17 nm and the width of the distribution is reduced. Lower catalyst activities are also observed in the corresponding trajectory map (Fig. 4e, bottom right) as the number of detected trajectories and velocity values decrease.
Even though it is believed that at higher temperatures the carbon nanostructures would benefit an increase in crystallinity due to a lowering of the microstructural defects (Andrews et al., Reference Andrews, Jacques, Qian and Dickey2001), the heating experiment ceased as the nanocomposite system already exhibited a significant nanoparticle loss throughout the entire heating process, as a network of graphitized structures is obtained. During the cooling stage, no relevant changes were detected, and no significant contraction or expansion of the nanocomposite aggregate was observed for any of the investigated sites.
Discussion
Nanocomposite 4 Stage Classification
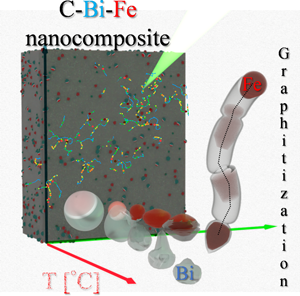
Based on the obtained results, such nanocomposites can be classified in terms of their composition, structure and morphology having in mind a set of thermally activated phenomena as proposed in Figure 5a. The system dynamics can be contoured in four main stages taking place during the pyrolysis step at temperatures below 1,100°C. The stages are termed here (1) incipient decomposition, (2) carbonization, (3) reduction, and (4) enhanced graphitization and will be described in the following paragraphs. The referred temperature regimes that govern the development of each stage are chosen from TG-DTG analysis, the in situ TEM observations and the morphological and structural analysis of the composites pyrolyzed under N2 or Ar flow (samples A1–A3, C1–C3). Since the characteristic temperatures may vary with atmosphere and pressure conditions, especially if more reductive conditions are used (samples B1–B3), the values should be grossly followed as guidelines.

Fig. 5. (a) Description of the pyrolysis of C–Bi–Fe nanocomposites showing features specific to the main thermal stages: (1) incipient decomposition (water desorption, RF crosslinking reactions and Bi/Fe precursor decomposition take place), (2) carbonization (polymer converts to glassy carbon, oxide nanoparticles are formed), (3) reduction (progressive reduction of Bi2O3 and Fe2O3 to metallic states, associated with nanoparticle growth, losses in time of Bi fractions, and scattered graphitization activity), and (4) enhanced graphitization (graphitization activity in the entire mass of the composite observed as graphitic carbon nanostructures). (b) Nanoparticle splitting process and (c) graphitization activity evidenced during the in situ TEM experiment.
Stage 1: Incipient decomposition (100–250°C)
During the incipient stage of heating the nanocomposite, Bi and Fe precursors start to decompose and water residues are extracted from the pores and from surface adsorption sites, as indicated in the thermal analysis. By-product volatiles can be released during the resorcinol and formaldehyde cross-linking reactions (80–300°C) (Lin & Ritter, Reference Lin and Ritter1997; Yoshimune et al., Reference Yoshimune, Yamamoto, Nakaiwa and Haraya2008). Simultaneously, Bi(NO3)3⋅5H2O starts decomposing at T = 55°C and T = 155°C to transform into Bi2O3 (La et al., Reference La, Huang, Luo, Lai, Liu and Chu2013), while the Fe(OAc)2 precursor decomposes in a two-stage process at T = 190–200°C and 300–320°C, yielding either magnetite Fe3O4 or hematite Fe2O3 phases, as a function of the oxygen levels from the pyrolysis atmosphere (Pinheiro et al., Reference Pinheiro, Pereira de Abreu Filho, Galembeck, Correa da Silva and Vargas1987; Laurikėnas et al., Reference Laurikėnas, Barkauskas, Reklaitis, Niaura, Baltrūnas and Kareiva2016). In the in situ heating TEM experiment, the formation of small nanoparticle is observed only after 250°C.
Stage 2: Carbonization (250–750°C)
As revealed by the TG/DTG analysis, the second stage is marked by the primary decomposition reactions that convert the RF xerogel into the amorphous carbon support. After pyrolysis temperatures will exceed 600°C, the amorphous carbon matrix will suffer further transformations toward a quasi-crystalline, carbon structure, as observed in the XRD and SAED diffraction patterns where crystalline features specific to the basal planes found in sp 2 carbons were depicted. To underline the importance of the phenomena taking place during this stage, one can link these events to the insulator to metal transition in RF-derived carbon xerogels observed at similar temperatures (Najeh et al., Reference Najeh, Mansour, Dahman, Alyamani and Mir2014). This was explained as a local densification of electrically conducting carbon structures leading to a conductive state when the system-specific percolation threshold is reached (Najeh et al., Reference Najeh, Mansour, Dahman, Alyamani and Mir2014).
As observed during the analysis of A1–B1 samples and also the in situ TEM analysis, nanoparticles are fully formed during this stage inside the evolving structure of the carbon support. Their structural features will be highly influenced by temperature, pressure of reductive gases and by oxygen levels. The data presented during the TEM analysis of A1–A3 samples suggest that due to the multiple interactions occurring during such pyrolysis conditions, hybrid nanoparticles are formed based on Bi/Bi2O3, Fe2O3, and the Fe-rich Bi2Fe4O9 phase, and serve as interfaces within the hybrid structure. These features are linked with oxygen-rich sites: O can bridge Fe and Bi proximal sites favoring the formation of BFO nanostructures with features depending on the local concentration of Bi and Fe oxides, analogous to the Bi2O3–Fe2O3 phase diagram (Maître et al., Reference Maître, François and Gachon2004).
Stage 3: Reduction (above 740°C)
During the reduction stage, the results suggest that Bi containing phases, such as β-Bi2O3, decompose into metallic Bi, while Fe can be obtained only under more reductive atmospheres (samples B1–B3) due to its high affinity to oxygen. By comparing the XRD profile of the nanocomposite pyrolyzed with different dwell times of 1 and 2 h (at 1,050°C), respectively, the intensity of Bi peaks relative to the carbon background is found to decrease with time and temperature. It is expected that under the given conditions (vacuum and/or inert atmospheres and nano-size constraints) the nano-sized Bi oxides are molten at temperatures below the bulk melting temperature of Bi2O3 (824°C) and further reduced, as observed in other studies as well (Guenther et al., Reference Guenther, Theissmann and Guillon2014). Also, as reflected from the TEM and in situ heating investigations, an increase in the nanoparticle size distributions is observed. Starting from T = 800°C, the bi-modal shape of the nanoparticle size distribution is lost, while the nanoparticles exhibit larger diameters and stronger shape irregularities. As phase transitions in Bi compounds were not observed to significantly alter the size or shape of the molten droplets (Guenther et al., Reference Guenther, Theissmann and Guillon2014), the present results suggest that the observed changes are mostly attributed to the growth of the Fe-based components and the migration and coalescence of multiple droplets, all mitigated by the transformations occurring in the matrix support. This may inevitably lead to increased losses in the Bi content if a high temperature and long dwell time pyrolysis is applied. During the in situ experiment, nanoparticle splitting events were evidenced as presented in Figure 5b, and in parallel, incipient graphitization processes in isolated regions toward the aggregate boundaries were observed (Fig. 5c). This may be underlined by the decomposition of hybrid BFO NPs and a further reduction and activation of the Fe-based catalysts. Even if the main explanation is based on the Bi–Fe phase separation at low oxygen impurity levels, further structural investigations performed during this stage would be necessary to support this scenario.
Stage 4: Enhanced graphitization (evidenced beyond 750°C)
As suggested by the XRD results, during the last stage, as Bi2O3 reduction and melting conditions are reached, high Bi losses occur, while metallic and oxidized Fe phases are more stable. A trend of decreased nanoparticle size distribution is evidenced in the in situ TEM experiment. These effects can be correlated with the reduction of iron oxide nanoparticles still progressing through a contracting sphere model (Barde et al., Reference Barde, Klausner and Mei2016; Oh & Noh, Reference Oh and Noh2017), noting also that losses in melted Bi fractions may contribute as well.
The main characteristic of this stage is the formation of graphitic nanostructures within the volume of the nanocomposite. During the in situ TEM experiment, a close inspection at higher magnification of these features confirmed that the textural changes are indeed due to the formation of graphitic nanostructures (Fig. 6a). These features were also evidenced for the G sample which was pyrolyzed at 1,050°C, for 60 min under N2 environment as it can be observed by analyzing the XRD profile, the corresponding SAED patterns and through the HR-TEM investigations presented in the previous sections. The graphitized carbon structures mostly reveal a nanoshell morphology and short nanofiber structures, best observed at aggregate boundaries. Our findings are consistent with those reported in the literature (Fort et al., Reference Fort, Cotet, Danciu, Turdean and Popescu2013; Wang et al., Reference Wang, Deng, Zhang, Zhang, Duan, Lu, Song, Tian, Song and Zhang2017) where complex graphene-like morphologies and longer multiwall carbon nanotubes, as well as other complex structures were reported after pyrolysis of nanocomposites based on C and Fe under similar conditions. For the present case, electron tomography studies performed in the conventional TEM mode provided a complete 3D characterization of a representative aggregate enabling the classification of such formations as a graphitized nanofiber. One of the typical 2D-TEM projections from the tilt series used to reconstruct the volume of an aggregate is presented in Figure 6b (left), where graphitized structures are recognized. Its structural continuity is maintained throughout the entire tilt series (Supplementary Video S4). The analysis of representative slices taken at various depths and orientations of the reconstructed volume (Fig. 6b, middle and right) also shows a rather continuous elongation of 120 nm, comparable with the estimated NP catalyst trajectories found during the in situ TEM experiment. There are two important questions that should be addressed here: what conditions are necessary for the graphitization mechanism to homogeneously grow carbon nanostructures and what parameters determine their average size?

Fig. 6. Graphitic nanostructures evidenced in C–-Bi–-Fe aggregates: (a) HR-TEM image after heating at 900°C with two highlighted regions during the in situ TEM experiment, (b) electron tomography results on a grain representative for the sample G. On left a 2D-projection extracted from the tilt series used to reconstruct the grain volume; middle and right two orthoslices taken at different depths within the reconstructed volume evidencing a tubular morphology of the graphitic structure having a length of roughly 120 nm.
Key aspects governing the graphitization mechanism
Similar to carbon nanotube production, the specific mechanisms, dynamics, and concurring phenomena can be described in several overlapped steps: (i) formation/reduction and thermal activation of metal catalyst as reached during the end of stage 3 (reduction of Fe oxide), (ii) dissociative adsorption of the carbon feedstock on the surface of metal catalyst, (iii) surface or bulk diffusion processes, and (iv) saturation and precipitation of carbon in the form of stacked graphene layers having various shapes such as nano-onions, -bamboo/herringbone fibers, -tubes, -filaments, or -ribbons (Kuznetsov et al., Reference Kuznetsov, Usoltseva, Chuvilin, Obraztsova and Bonard2001; Jourdain & Bichara, Reference Jourdain and Bichara2013; Kharlamova, Reference Kharlamova2017).
The efficiency of the reduction and thermal activation of metal catalyst nanoparticles is governed not only by temperature but also by the conditions found in the surrounding environment: the partial pressure of the reductive gases (H2, CO, etc.) and oxygen (Wang et al., Reference Wang, Deng, Zhang, Zhang, Duan, Lu, Song, Tian, Song and Zhang2017). During the pyrolysis of materials based on phenolic resins, by-product gases are emitted mainly as ethylene, hydrogen, water, carbon monoxide, and secondary carbon containing species (such as methane, ethane, propene and methyl, phenol, cresol groups) as a result of polymer chain decomposition (Ebrahimi et al., Reference Ebrahimi, Roghani-Mamaqani, Salami-Kalajahi, Shahi and Abdollahi2018). Species such as carbon, hydrogen, and carbon monoxide are expected to assist the progressive reduction of Fe2O3 into intermediate Fe3O4 and FeO until metallic states are reached. In other C–Fe systems, a three step CO and H2 mitigated reduction of Fe3O4 to Fe was observed at 400–550°C, 730–750°C, and 900–1,000°C (Cypres & Soudan-Moinet, Reference Cypres and Soudan-Moinet1980; Cyprès & Soudan-Moinet, Reference Cyprès and Soudan-Moinet1981). These processes may also contribute to the DTG signals observed for the present composites in the same temperature ranges (Fig. 1). The different sets of pyrolysis experiments were performed to evaluate if graphitization is strictly conditioned by the reduction efficiency. The role of the pretreatment step at 250°C is reflected by comparing the XRD profiles for samples C1 (with pretreatment) and C2 (without pretreatment). As observed in Supplementary Figure S1, a shorter pyrolysis with no intermediary dwells will lead to composites with higher metallic Bi content, due to lower losses of melted Bi which may hold an advantage for heavy metal sensing applications. From the point of view of achieving higher graphitization yields, however, the absence of the intermediary plateau generated higher concentrations of maghemite/magnetite and even hematite, which are clear signs of low reduction yields. On the other hand, the C1 sample having an intermediary plateau revealed lower intensities for the Bi peaks but more pronounced signals associated with Fe/Fe3C. Additionally, by using TEM and Raman investigations, the C1 sample revealed features specific to the incipient graphitization stage (detailed in Supplementary Fig. S7), thus being considered as a transient sample between A3 type composites, found in reduction stage, and G type composites, found in the accelerated graphitization stage. Furthermore, by comparing the XRD profiles of the A1–A3 samples (Fig. 2), C1–C2 (Supplementary Fig. S2) with the B1–B3 samples (Supplementary Fig. S1a), one can observe that the oxide species are more efficiently reduced for the B1–B3 set, even at low temperatures such as 600°C; without any signs of graphitization being observed as for sample G. Other parameters such as the compactness of the carbon support were also considered significant in the overall reduction scheme (Leventis et al., Reference Leventis, Chandrasekaran, Sadekar, Mulik and Sotiriou-Leventis2010) and since the accelerated graphitization stage was reached during the in situ TEM experiment performed on powdered samples, grinding before pyrolysis was also evaluated, without showing any clear graphitization activity (see Supplementary Fig. S2b for XRD data for samples B1p–B3p and Supplementary Fig. S1 for the C2p as well). The findings suggest that smaller C–Bi–Fe composite aggregates, that also lead to higher Bi losses, did not necessarily favor the graphitization activity, and that the overall efficiency of the reduction and thermal activation of metal catalyst is necessary but not sufficient to achieve graphitization.
Focusing now on the next step in the graphitization mechanism, the dissociative adsorption of the carbon feedstock on the surface of metal catalyst, some particularities are met for the HG mechanisms in sol-gel-derived nanocomposites, as the bulk carbon matrix must play a dual role, as mechanical support for the formation of catalyst nanoparticles and as feedstock source for the graphitization reactions. The present thermal investigations do not clearly indicate the nature of the carbon feedstock. One can infer that the actual amorphous solid is directly converted by the catalyst nanoparticles into graphitized structures as described in other similar studies (Ichihashi et al., Reference Ichihashi, Fujita, Ishida and Ochiai2004). It is also plausible that, as temperatures exceed 560°C, the main pyrolytic gases resulting from the decomposition of the RF matrix could also contribute to the graphitization mechanism, by considering their two possible roles: (i) as reducing agents that activate the catalytic nanoparticles and (ii) as actual feedstock for the growth of carbon nanostructures when the gas molecules are adsorbed and disassembled at the catalyst surface. For example, during their investigation of nanotube production through pyrolysis of Fe-implanted phenolic resins, Wang et al. observed that by increasing the chamber pressures in static atmosphere conditions, denser nanotube populations with improved crystallinity were obtained (Wang et al., Reference Wang, Deng, Zhang, Zhang, Duan, Lu, Song, Tian, Song and Zhang2017). Based on their results, the authors suggested the carbon containing gases, generated by the decomposition of the phenolic resin (mainly C2H4) to be the main carbon sources used for CNT formation and further linked the higher yields in CNT production under static high pressures with a higher diffusivity of hydrocarbon species (Wang et al., Reference Wang, Deng, Zhang, Zhang, Duan, Lu, Song, Tian, Song and Zhang2017). Signs of C–Fe interactions can be discussed by considering the XRD data recorded so far, and the different C–Fe and Fe–O phase diagrams as shown in Supplementary Figure S8. According to the literature, the presence stabilized γ-Fe is mitigated by temperature and the Fe–C interactions taking place at high temperatures (Khannanov et al., Reference Khannanov, Kiiamov, Valimukhametova, Tayurskii, Börrnert, Kaiser, Eigler, Vagizov and Dimiev2018). Above the peritectic temperatures (740°C), nucleation sites for γ-Fe can form by increasing the diffusive carbon content as described in other studies (Wirth et al., Reference Wirth, Bayer, Gamalski, Esconjauregui, Weatherup, Ducati, Baehtz, Robertson and Hofmann2012). At high C concentrations, metastable iron carbide is formed, followed by supersaturation with carbon and spontaneous re-deposition through the graphitization mechanism. The morphological and structural analysis performed on the entire batch of samples suggest that this is mostly reached in sample G, followed by sample C1. At low temperatures or low reduction yields, the high oxygen levels hinder any possible graphitization activity reflected for samples such as A2 and C2. For longer treatments with high reduction yields, the catalysts are activated. However, carbon is dominant as solid phase, while the mobile C species may be so low that either supersaturation is not easily reached and graphitization does not occur (i.e., samples A3, B2, and B3) or the formation of short tubes or nano-onions is obtained at most (as observed for samples C1 and G).
In order to reach a deeper insight regarding the growth limiting processes specific for the investigated systems, the nanoparticle dynamics observed during the in situ TEM experiment can be discussed starting from two approximations: (i) nanoparticle dynamics is correlated with graphitization activity and (ii) carbon nanotube growth models can similarly describe the graphitization process in the given composite system. These approximations are based on the present results, most specifically the in situ TEM experiment observations which indicate that the textural changes of the support and the accelerated graphitization concomitantly take place with nanoparticle motion (Supplementary Video S3) and upon the fact that carbon nanotubes were reported to be grown under similar conditions in other studies as well (Liu et al., Reference Liu, Lv and Tan2013; Wang et al., Reference Wang, Deng, Zhang, Zhang, Duan, Lu, Song, Tian, Song and Zhang2017).
The nanoparticle velocities determined during the in-situ TEM experiment (Supplementary Videos S1–S3) are represented in Figure 7a as a function of temperature and their corresponding trajectory index (algorithm generated number linked to each nanoparticle trajectory detected in the video sequence). The statistical parameters (average, median, maximum speed, and displacement for each detected trajectory) are further averaged across the total number of trajectories detected during each video sequence (Fig. 7b). The parameters derived for the sequence recording the 800–900°C transition were associated with an intermediate temperature of 850°C, due to the high heating rate. As observed, the maximum speed reached by the nanoparticles (V max) increases with the temperature from roughly 16 nm/s at 750°C, to 54 nm/s during the 800–900°C transit. The decrease in activity during the constant plateau at 900°C is noticeable when observing the mean speed (V mean), displacement, and the number of detected trajectories.

Fig. 7. Nanoparticle dynamics from the investigated area of the sample during in situ heating experiment. Results are expressed in terms of (a) statistics on the velocities measured for every detected nanoparticle found in motion as function of the relative trajectory index and experiment time, (b) values of trajectory length (nm) and mean and maximum velocities averaged over the total number of nanoparticles at given temperatures, and (c) apparent activation energies determined using the exponential growth model for carbon nanotubes.
Using the first approximation, displacement values are linked with the maximal length the graphitic structures can reach and the V max values with the growth rate for the graphitic structures. The next approximation refers to choosing the exponential model found for nanotube growth, which is generally described as:
 $${\rm \gamma } = B{\rm \;}e^{-{{E_{\rm a}} \over {k_{\rm B}T}}}{\rm , \;\;}$$
where γ is the growth rate, T is the absolute temperature, k B is the Boltzmann constant, E a is the activation energy, and B represents a proportionality coefficient. Finally, the activation energy associated with nanoparticle motion and HG mechanism can be determined by fitting ln(γ) against 1/(k BT). At lower temperatures, an activation energy E a = 0.68 eV was determined (Fig. 7c), while during the accelerated graphitization stage (800–900°C), values decrease to E a = 0.23–0.39 eV. The changes in the apparent activation energies explain the sudden decrease in catalyst activity, when the nanotube formation mechanisms are considered, so that the found values can be ascribed to regimes where different processes are rate limiting. For carbon diffusion on the Fe catalyst, which is the most frequently reported rate-limiting step for CNTs, the activation energy is found in the range of 0.70–1.68 eV for solid state catalysts, 0.32–0.6 eV for liquid state catalysts (Bartsch et al., Reference Bartsch, Biedermann, Gemming and Leonhardt2005), and 2–2.8 eV for carbide systems (Jourdain & Bichara, Reference Jourdain and Bichara2013). Smaller activation energies of 0.25, 0.36, and 0.57 eV were reported for adsorption, mass diffusion, and dissociation limited regimes that also lead either to catalyst poisoning or undersupplies of feedstock gas in the vicinity of the catalyst active sites (Van De Burgt et al., Reference Van De Burgt, Bellouard and Mandamparambil2014). The later values represent the greatest match for the values found during stage 4 in the C–Bi–Fe xerogel nanocomposite system. In opposition to the typical carbon nanotube growth installations, during pyrolysis, the concentration of feedstock species such as C2H4 and CO will depend on temperature, time and flow variables. Also, at higher temperatures, the carbon layers forming around the catalyst particles can passivate their graphitization activity. Based on the obtained results, we interpret that the observed accelerated graphitization stage is found within an adsorption/dissociation limited growth regime, where the availability of the total feedstock and/or catalyst poisoning end the process within a limited amount of time (several seconds) as observed during the in situ TEM experiment. At this point, it is proposed that further changes in compositions of the C–Bi–Fe xerogel and the pyrolytic gas may lead both to enhanced reduction of the catalytic nanoparticles and to an increase in the quality, length, and density of the graphitic nanostructures. Such new traits are expected to further increase the electrical conductivity of the involved materials and lead to improvements in target applications.
Conclusion
The Fe-assisted graphitization mechanism is analyzed using in situ TEM and particle tracking algorithms applied on C–Bi–Fe xerogel nanocomposites, recently presented as multifunctional electrode materials for heavy metal and hydrogen peroxide detection. The thermal evolution of the C–Bi–Fe nanocomposites was investigated by following different pyrolysis experiments, a TG/DTG analysis, XRD, TEM, Raman characterizations that complemented the real-time in situ TEM heating experiment. A four-stage thermal evolution of morphology and structure is used to classify the states of the nanocomposite during pyrolysis as follows: (1) incipient decomposition, (2) carbonization, (3) reduction, and (4) enhanced graphitization. For most pyrolysis experiments, the thermal evolution toward the final graphitization stage is hindered. Peculiar hybrid bismuth iron oxide nanoparticles are observed under various conditions. Their occurrence is observed to decrease, along with Bi at high temperatures, while γ-Fe2O3 and graphitization inducing α-Fe and γ-Fe nanoparticles are evidenced, at higher temperatures. During the in situ TEM heating experiment, nanoparticle growth was evidenced until 600–750°C. At temperatures in the range of Bi2O3 melting point, the abrupt disappearance of the small-sized nanoparticles is related to dynamic phenomena associated with reduction, coalescence, splitting, and Bi vaporization. Between 750 and 900°C, the nanoparticle dynamics revealed a strong link with the graphitization activity, with a maximum both in nanoparticle velocity and graphitization spread reached between 800 and 900°C. High-resolution TEM and electron tomography confirm the presence of graphitic nanoshells and ~60–120 nm long nanofibers, due to the catalytic activity of Fe nanoparticles.
Through analyzing the nanoparticle dynamics in terms of an exponential growth model specific to carbon nanotubes, the approximate activation energies were derived as: 0.68 eV during progressive reduction stage (750–800°C) and 0.23–0.39 eV during accelerated graphitization (between 800 and 900°C). The lower values found for the graphitization stage suggest that nanofiber growth is limited primarily due to adsorption, mass diffusion, and dissociation of the mobile carbon species at the catalyst interface, ultimately leading to catalyst poisoning or feedstock undersupplies. No evidence regarding the direct conversion of solid carbon feedstock into graphitic content was obtained so far. The present findings suggest that, if constraints related to bismuth and oxygen interference and also, the shortages in gaseous feedstock are released, the graphitization yields will increase. This may lead to new strategies for selecting the thermal treatments for carbon-based systems and nanocomposites with improved properties.
Supplementary material
To view supplementary material for this article, please visit https://doi.org/10.1017/S1431927622000241.
Acknowledgments
This work was supported by a grant of the Romanian Ministry of Research and Innovation, CCCDI–UEFISCDI, project number PN-III-P1-1.2-PCCDI-2017-0350 / 01.03.2018 (Graphene4Life), within PNCDI III. M.M.R. and I.F. acknowledge financial support from the “Direction Relations Internationales” at Ecole Polytechnique and French state managed by the National Research Agency under the Investments for the Future program under the references ANR-10-EQPX-50 pole NanoMAX, pole NanoTEM. The authors would like to acknowledge the Centre Interdisciplinaire de Microscopie électronique de l'X (CIMEX). Melanie Poggi is gratefully acknowledged for her technical aid with the TG analysis.


 Open access