


Obesity has a multifactorial origin, with increasing prevalence in recent decades worldwide and a high burden on the public health system due to its significant morbidity and mortality(Reference Apovian1). Over the years, increasing physical activity (PA) energy expenditure has become a commonly applied strategy to combat obesity, especially through the practice of physical exercises, a planned structured repetitive PA aimed at improving or maintaining one or more components of physical fitness(Reference Spiegelman and Flier2–Reference Caspersen, Powell and Christenson4).
The practice of physical exercise brings health benefits to individuals(Reference Ruegsegger and Booth5). Physical exercise can provide several metabolic changes, including thermogenesis, β-adrenergic stimulation, hepatic mitochondrial activity, decreased blood pressure, improved insulin resistance and decreased circulating leptin levels(Reference Ruegsegger and Booth5–Reference Zouhal, Jacob and Delamarche10). Due to its effects on lean mass, physical exercise is purported to increase an individual’s resting energy expenditure (REE)(Reference Speakman and Selman11). However, there is evidence that differences in REE between individuals are not fully explained by differences in body composition and aerobic fitness alone(Reference Arciero, Goran and Poehlman12).
On the other hand, it is noteworthy that physical exercise is not the only component of PA that plays a role in human health. PA is defined as any type of movement performed by the skeletal muscles that result in energy expenditure, at various intensities, durations and frequencies of muscle contractions. Low PA, which is related to sedentary behaviour (SB), is gaining attention for its deleterious effects on human health(Reference Caspersen, Powell and Christenson4). SB occurs through sitting/lying down or reclining while awake and leads to low energy expenditure (approximately 1·0–1·5 times metabolic equivalent of task (MET)), being associated with an increased risk of overweight/obesity, arterial hypertension and type 2 diabetes(Reference Tremblay, Aubert and Barnes13–Reference Guo, Zhou and Zhang15). A decrease in SB is associated with decreased postprandial levels of glucose and insulin(Reference Dempsey, Larsen and Sethi16). In addition, sitting/lying down time alone has also been linked to diseases and conditions associated with obesity, such as greater risks of morbidity and mortality from type 2 diabetes, cancer and CVD and is sometimes mentioned as being as harmful as or even worse than smoking(Reference Vallance, Gardiner and Lynch17).
Thus, decreasing SB is an essential goal for improving the health of populations, and the practice of physical exercises is the most usual measure adopted(18). However, several governmental organisations, such as the National Health Services of the UK(19), and expert panels, such as the Mayo Clinic(20) advises that to decrease SB, individuals could implement simple tasks throughout their days, such as stand while in public transport and while talking on the phone, work in a standing desk, etc. Hence, it is important to investigate the associations between these SB indicators (SBI) and PA indicators (PAI), such as standing time, walking time, the number of steps/d and not only physical exercise , on the human health. Considering the recommendations to decrease SB and increase PAI to prevent chronic diseases(19,20) , it is interesting to investigate the relationship between these indicators with REE, insulin resistance, leptin and thyroid hormones, especially in individuals with obesity.
The study of these associations gains further importance in the context of low-income regions. Individuals of lower socio-economic status are the ones with the lowest probability of following fitness advice, given their difficulties in having access to adequate facilities to practice physical exercises or their inability to go for a walk in a poor and violent neighbourhood, even in developed countries(Reference Booth, Creatore and Moineddin21). In Brazil, adult women living in low-income regions have the highest obesity prevalence and are the group with the lowest frequency of physical exercise in their free time(22). Furthermore, taking objective measurements of PAI and SBI in these populations may be difficult given the high costs associated with the use of properly developed devices such as triaxial accelerometers. Thus, the objective of this study was to evaluate whether there is an association between PAI (standing, walking time and the number of steps/d) and SBI (sitting/lying down time) with the hormonal profile and REE of adult women with obesity living in a low-income region.
Materials and methods
Ethical aspects
The study was approved by the Research Ethics Committee of the Universidade Federal de Alagoas (no. 2535·99). All participants were informed about the procedures and signed an informed consent form.
Study type
This was a cross-sectional study.
Study population
The sampling was non-probabilistic, and recruitment was performed through advertisements in the community and direct invitations to women who had some ties with the Center for Recovery and Nutritional Education (CREN) located in the 7th administrative region of Maceió-Alagoas, Brazil, which has the lowest human development index in the municipality. The CREN serves about 100 children with chronic malnutrition in 24 slums in the city and provides health care to their mothers and other guardians.
Adult women (19–44 years old) with obesity and stable weight for at least 1 month were included. Obesity was defined as the presence of two of the three following criteria: I. BMI ≥ 30 kg/m2 but < 45 kg/m2; II. waist circumference ≥ 88 cm and III. percentage of fat defined by a bioimpedance of ≥ 35 %. The exclusion criteria were use of chronic medications (antidiabetic, antihypertensive, antiretroviral, immunosuppressive and antidepressants); currently postmenopausal, pregnant or breast-feeding, a history of having undergone surgical intervention for weight loss, or currently performing a physical exercise regimen.
Anthropometric evaluation and body composition
Body weight data were collected using a digital scale (Filizola, São Paulo, Brazil), while height was determined using a portable stadiometer. BMI was calculated as recommended by the WHO (1995)(23). Body composition was assessed using tetrapolar bioimpedance, mono-frequency (50 kHz) Sanny BI 1010 (Sanny). The participants were instructed to fast for 10 h and not perform any type of physical exercise or drink alcohol in the preceding 24 h. For the examination, four electrodes were attached to the patient’s right hemibody while in a supine position, wearing light clothing, barefoot and not wearing metallic ornaments. The resistance and reactance data obtained in the evaluation were inserted in the Bio Tectronic Sanny software version 1.2.2 for the determination of the percentage and quantity (in kilograms) of fat-free mass (FFM) and body fat.
Hormonal analysis
Through blood sample collection by peripheral venepuncture, the hormones insulin, leptin, thyroid-stimulating hormone (TSH), free thyroxine (FT4) and free triiodothyronine (FT3) were measured. The chemiluminescence technique (Unissel DxI 800, Beckman Coulter) was used to determine the insulin and thyroid hormone (TSH, FT4 and FT3) levels. The enzyme immunoassay method (Linco Research) was used to determine leptin levels. The homoeostatic insulin resistance model (HOMA-IR) was calculated from plasma levels of insulin and fasting glucose using the equation developed by Matthews et al. (1985) to assess insulin sensitivity(Reference Matthews, Hosker and Rudenski24).
Resting energy expenditure
REE was measured by indirect calorimetry using a gas analyser (Quark, Cosmed). The equipment was calibrated before each test session according to the manufacturer’s specifications, with gases at a concentration of 20·9 % O2 and 5 % CO2 and a 3 l syringe with a secondary manometer adjustable to 40–60 psi.
The participants were transported by car to the Laboratory of Sciences Applied to Sports at the Universidade Federal de Alagoas. Measurements were made between 07.00 and 09.00 in a room with lighting and temperature adjusted to ensure their comfort. The participants followed the same preparation used to perform the electrical bioimpedance test, since the measurements took place at the same time. Vital signs of blood pressure (HEM-4030, Omron) and axillary temperature (Techline, São Paulo) were measured to identify fluctuations in hyperthermia (> 37·5°C) and tachycardia (> 100 bpm). The volumes of inspired oxygen (VO2) and the volume of expired carbon dioxide (VCO2) were captured for 15 min using a silicone mask. The data from the first 5 min were discarded to avoid discrepancies due to unfamiliarity with the location or equipment(Reference Borges, Langewanmattsr and Cirolini25). After VO2 and VCO2 were measured, the REE was calculated using the equation proposed by Weir (1949)(Reference Weir26).
Physical activity
PA was estimated using triaxial accelerometer motion sensors (ActivPAL, Glasgow, UK) that measured the acceleration in three body axes: anteroposterior, lateral and vertical. These accelerometers were placed on the participants in the CREN facilities and fixed at the midpoint between the inguinal line and the upper edge of the patella exactly on the anterior muscles of the right thigh. The region was previously sanitised using cotton and 70 % hydrated ethyl alcohol, and then the accelerometers were fixed to the skin with the aid of two transparent film dressings (VitaMedical®) that were both hypoallergenic and impermeable to water. The participants used the accelerometers for three consecutive days in the same week in which they underwent the electrical bioimpedance and indirect calorimetry tests. The participants were advised to continue their routine activities as normal and remove the equipment only before engaging in any water-based activities. The data were exported to ActivPAL3™ software version 7.2.32. The system calculates the periods spent sitting/lying down (awake or sleeping), standing and walking every 10 s for the entire time the device was used based on the acceleration of the three-body axes previously mentioned. It also provides an estimated MET value for the entire period in which individuals used the device by multiplying the MET value for each activity by its duration based on the standard values: sitting/lying down (1·25 MET), standing (1·40 MET) and walking at 120 steps per minute (4 MET). For cadences that differed from 120 steps per minute, the following equation was used to calculate the MET estimate:
 $$MET.h = \left( {1.4 \times d} \right) + \left( {4 - 1.4} \right) \times \left( {{c \over {120}}} \right) \times d$$
whose value of c corresponds to the cadence (steps per minute) and d is the duration of the activity (in hours)(Reference Ainsworth, Haskell and Whitt27). The MET value expressed by the accelerometer analysis is closely related to the concept of the PA ratio (total energy expenditure/REE)(28). In this study, the total MET value obtained for the 3 d was divided by the total number of hours that individuals used the accelerometer (72 h) to reach an estimated daily MET/h. Such a method for estimating the daily MET/h has already been applied to a sample similar to the one used in the present study and showed good agreement with the total energy expenditure measured by doubly labelled water(Reference Macena, Pureza and Melo29).
Statistical analysis
All categorical variables are presented as frequencies and continuous variables as means and standard deviations. We performed multivariable linear models to assess the association of SBI (sitting/lying down) and PAI (standing, walking time, number of steps and total MET) with the hormonal profile and REE with the adjustment for age and FFM as a proxy for body composition. A value of α = 5 % was adopted. All analyses were performed using the software R v 3·6·1, with the package ‘Rcmdr’.
The sample size was determined based on the feasibility of recruitment. Hence, considering our sample size (n 58), an α value of 5 % and a statistical power of 80 %, we would be able to detect an effect size (f²) of 0·14. In a multiple linear regression model, including age, FFM and sitting/lying down time as predictors and REE as outcome, this effect size would yield a total R² of 30 % and a partial R² of the main variable (sitting/lying down time) of 10 %. Calculations were conducted using Gpower v. 3.1.9.2 (University of Dusseldorf, Dusseldorf, Germany).
Results
Fifty-eight women with a mean age of 31 ± 7 years were included. The participants had an average BMI of 33·34 ± 4·11 kg/m2 and an average sitting/lying down time of 16·08 ± 1·44 h/d. The other descriptive characteristics of the sample are presented in Table 1.
Table 1. Descriptive characteristics (Mean values and standard deviations, n 58)
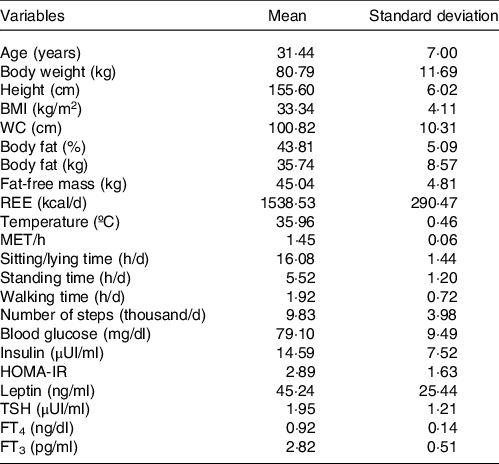
WC, waist circumference; REE, resting energy expenditure; MET, metabolic equivalent of task; HOMA-IR, homoeostatic insulin resistance model; TSH, thyroid stimulating hormone; FT3, free triiodothyronine; FT4, free thyroxine.
In univariable analyses, PAI and SBI were not associated with REE, HOMA-IR, leptin and TSH. Sitting/lying down time was only associated with FT4 ((β = −0·56 ng/dl; 95 % CI = −1·08, −0·03; P = 0·03), while standing time was only associated with FT3 (β = −2·85 ng/dl; 95 % CI = −5·48, −0·22; P = 0·03).
Regarding multivariable analyses adjusted for age and FFM, the PAI and SBI still did not show association with REE, HOMA-IR, leptin and TSH. In contrast, sitting/lying down time showed a statistically significant association with FT4 (β = −0·56 ng/dl; 95 % CI = −1·10, −0·02, P = 0·04) as well as and standing time (β = 0·75 ng/dl; 95 % CI = 0·01, 1·48; P = 0·04). Standing time was also associated with FT3 (β = −2·83 pg/ml; 95 % CI = −5·56, −0·10; P = 0·04) (Table 2).
Table 2. Effects of physical activity and sedentary behaviour indicators on the hormonal profile and resting energy expenditure (Coefficient values and 95 % confidence intervals, n 58)*
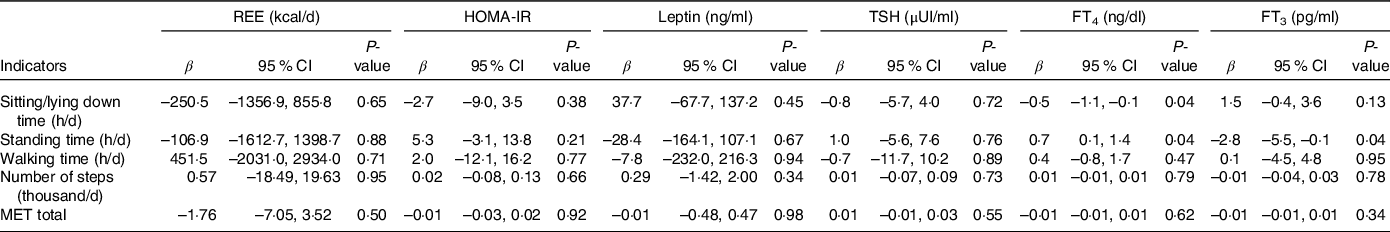
REE, resting energy expenditure; HOMA-IR, homoeostatic insulin resistance model; TSH, thyroid stimulating hormone; FT4, free thyroxine; FT3, free triiodothyronine; MET, metabolic equivalent of task.
* Multivariable analyses adjusting for age and fat-free mass.
About statistical power, the model including sitting/lying down time, age and FFM as predictors, and REE as outcome showed a total R² of 10 % and the sitting/lying down time showed a partial R2 of 0·3 %.
Discussion
The present study showed that the sitting/lying down time showed an inverse association with the thyroid hormone FT4, while standing time was directly associated with FT4 and inversely associated with FT3 after adjusting for age and FFM in women with obesity living in low-income regions. PAI and SBI were not associated with REE, HOMA-IR, leptin and TSH levels.
Studies of the relationship between PAI and SBI with thyroid hormones are scarce. Commonly, studies have evaluated the effects of physical exercise on these hormones; however, findings are still controversial(Reference Hackney, Davis and Lane30). The main associations between thyroid hormone levels and PA could be related to the role of FT3 in the skeletal muscle, mainly by activating the expression of uncoupling protein-3 genes, which could lead to an increase in REE(Reference Cunningham, McElligott and Carroll31,Reference Schrauwen and Hesselink32) . In addition, FT3 mediates the expression of important genes related to the metabolic activity of muscles, such as the genes of the α-myosin heavy chain and sarcoplasmic reticulum Ca ATPase, which are positively regulated, and the genes of the β-myosin heavy chain and phospholamban, negatively regulated, which could increase the efficiency of muscle contraction(Reference Clement, Viguerie and Diehn33,Reference Arruda, da Silva and Carvalho34) .
It is important to note that in our analyses, the SBI ‘sitting/lying down time’ encompasses sleeping time, which can further confound our findings. However, it is difficult to isolate the possible effects of sleep on the thyroid axis hormonal profile of individuals with obesity. Most studies that correlate these variables assess this relationship in individuals with sleep deprivation or thyroid disorders. Some studies have already shown that sleep deprivation, which was not the case of our sample, could reduce circulating levels of leptin and be associated with increased TSH, FT3 and FT4 levels(Reference Gary, Winokur and Douglas35–Reference Taheri, Lin and Austin37).
We hypothesise that the finding that standing time is directly associated with FT4 levels and inversely associated with FT3 levels is due to a regulatory action of these hormones on the REE to keep it within a normal range. FT4 is considered a pro-hormone that depends on the deiodination process to become FT3, the main hormone acting on this axis(Reference Kohrle38). One of the main functions of FT3 is to increase REE in several ways, highlighting the decoupling of cellular metabolism from the synthesis of ATP(Reference Kim39). As standing time could reflect a greater energy need than in sitting/lying down activities, the body may decrease the deiodination process to avoid an increase in energy expenditure, keeping it low instead. This may also explain why the REE did not seem to have been affected by PAI or SBI in the present study.
Furthermore, we are unaware of any study to date that has evaluated the effects of PAI and SBI on REE. Given that decreasing SBI and increasing PAI is advised to prevent obesity, it would be expected that they could be associated with REE, but the limited existing evidence fail to show this association. Johannsen et al. (Reference Johannsen, Welk and Sharp40) evaluated twenty community-dwelling women, ten with and ten without obesity, and observed that the group with obesity had a longer sedentary time (+2·7 h/d) on weekdays. However, no intergroup differences in REE were found after the adjustment for FFM, indicating that differences in body composition alone could explain the differences in REE. Nevertheless, the authors recognise the lack of statistical power to detect significant differences despite the high effect sizes found. In another investigation, evaluating REE and PA levels in routine contexts without interventions and in individuals of both sexes with mixed body weight classifications and occupations, there seems to be no association between PA measured as counts per minute and REE(Reference Pontzer, Durazo-Arvizu and Dugas41).
Individuals with obesity have disorders in HOMA-IR and leptin levels, and the practice of physical exercise associated with the loss of body fat helps with hormonal control(Reference Fedewa, Hathaway and Ward-Ritacco8,Reference Boyer, Johnson and Fitzhugh42,Reference Farr, Gavrieli and Mantzoros43) . Nevertheless, our study, which did not evaluate physical exercise , did not find significant associations between these hormones and the PAI and SBI. Once again, as decreasing SBI and increasing PAI is advised as a way to prevent type 2 diabetes mellitus, it would be expected an association with HOMA-IR. We highlight the lack of studies that have assessed the impact of PAI and SBI time rather than physical exercise on these outcomes.
Regarding the sample size of our study, we should note that our recruitment used a criterion based on feasibility. We chose as primary analysis the relationship between sitting/lying down time and REE with adjustments for age and FFM, which was the model that we used to estimate our statistical power, expecting a partial R² of 10 % for the sitting/lying down time. However, the effect of this relationship was much smaller than we expected, with a Partial R2 of only 0·3 %. Thus, for our primary variable, we had no statistical power to find significance. It is noteworthy that for this effect size to be statistically significant, 2611 individuals would be needed, which would be impractical. We also emphasise that we were able to find significant associations with secondary variables in our study, indicating that for greater effect sizes, our sample was adequately powered.
The limitations of the present study include the inaccuracy of the triaxial accelerometers for detecting upper-body movements. However, the accelerometers used here are already widely validated in adults and produce reliable estimates for light physical activities, such as walking, sitting and getting up, which was the focus in our current sample(Reference Florez-Pregonero, Meckes and Buman44–Reference van Nassau, Chau and Lakerveld47). Another limitation is that the women spent 72 straight hours with the accelerometers, which raises some concerns. First, we were unable to distinguish the exact sleeping time throughout the period in which the women used the accelerometer, which may prevent us from following the exact definition of SB. Second, 3 d of accelerometer use may be insufficient to accurately represent the PA pattern of each individual, as some studies suggested 5-d use for older adults(Reference Aguilar-Farias, Martino-Fuentealba and Salom-Diaz48). A Brazilian study using a wrist-worn accelerometer suggested that, for younger adults, 3 d would sufficiently show light PA patterns(Reference Ricardo, Wendt and Galliano49). A third limitation is that individuals did not wear the accelerometer on weekend days when they usually show lower PA levels. Ricardo et al. (Reference Ricardo, Wendt and Galliano49) also indicated that, for younger adults, the ‘week v weekend’ difference pattern is not observed; rather, it is more common in adults older than 30 years of age. Finally, we emphasize that because our study is cross-sectional, we cannot make inferences of causality between the analysed variables nor we can disregard reverse causation bias.
Despite the limitations of our study, some strengths may be highlighted, such as the fact that our sample was a group of interest, women with obesity of lower economic classes in a developing country, the group with the highest prevalence of obesity worldwide. In addition, we used a reliable objective method to assess five PAI and one SBI in this population living in low-income regions, which in conjunction with REE and the hormonal profile of these women increased our ability to document this debated relationship.
In conclusion, sitting/lying down time was inversely associated with the FT4 levels while standing time was directly associated with FT4 and inversely associated with FT3 levels after the adjustment for age and FFM, in women with obesity living in low-income regions. There were no associations between the other indicators of SB and PA evaluated with REE, leptin and insulin resistance. We highlight the need for more studies that explore the effect of these PAI and SBI on energy expenditure and hormonal profile of individuals in order to elucidate the possible mechanisms that justify the beneficial effects of decreasing SB and increasing PA on the human health.
Acknowledgements
The authors are grateful to Professors Gustavo Gomes Araújo and João Araújo de Barros Neto for making access to the Laboratory of Applied Science to Sport available for analysis of resting energy expenditure and the use of electrical bioimpedance to estimate body composition, respectively.
This study was partially funded by Fundação de Amparo à Pesquisa do Estado de Alagoas (no. 14/2016) and by the Coordenação de Aperfeiçoamento de Pessoal de Nível Superior with a research grant for MLM and IRP (under the numbers of process 23065.005919/2021-75 and 1793050).
M. L. M. wrote the original draft preparation and was responsible for the reviewing and editing of the manuscript and the formal analysis. A. E. S. J., D. R. S. P., I. R. O. M. P., L. G. L. V. and M. L. M. were responsible for the investigation, methodology and data curation as well as the writing, reviewing and editing of the manuscript. T. M. M. T. F. was responsible for the resources and the writing, and reviewing of the manuscript. N. B. B. provided resources, supervision, conceptualisation, methodology, and the writing, reviewing, and editing of the manuscript. All the authors read and approved the final version of the manuscript.
There are no conflicts of interest.


