


INTRODUCTION
Drought can have serious impacts on local economies and agricultural production (Ghulam et al. Reference Ghulam, Qin, Kusky and Li2008). There have been many regional drying trends worldwide over the last three decades (Reference DaiDai, in press), and many world regions have suffered from water crises (Ghulam et al. Reference Ghulam, Qin, Kusky and Li2008). Crop water stress is a complex phenomenon that is difficult to detect because crops are able to adjust their physiological status and water consumption by opening and closing stomata. Crop water stress is associated with soil water balance, evaporation, root water uptake and transpiration and other plant biophysical parameters (Yang et al. Reference Yang, Fenga, Huang and Lin2008). Therefore, drought-monitoring methods such as satellite remote sensing of surface moisture status and drought conditions are of great interest for sustainable development and management of agricultural production.
Ghulam et al. (Reference Ghulam, Qin and Zhan2007a, Reference Ghulam, Qin, Teyip and Lib, Reference Ghulam, Qin, Kusky and Li2008) and Qin et al. (Reference Qin, Ghulam, Zhu, Wang, Li and Nan2008) introduced and developed perpendicular drought indices (PDIs) that were derived from images taken by various satellites over case study locations in China. They found significant relationships between these indices and soil moisture (SM) over different study areas that differed in vegetation coverage from full vegetation cover to bare soil. They recommended applying these methods as drought monitoring indices in semi-arid and arid areas. Shahabfar & Eitzinger (Reference Shahabfar, Eitzinger, Eitzinger and Kubu2009) evaluated these perpendicular indices by comparing them with three meteorological drought indices, including Z-score (Z), China-Z index (CZI) and modified China-Z index (MCZI) over different climatic regions in Iran; the analysis included measurements from over 180 weather stations. The results of the present study indicated a strong and significant correlation between the PDI and the three meteorological drought indices. These results also indicated a high, significant correlation between the perpendicular indices and precipitation recorded at the weather stations. The PDI was effective for bare soil applications and in the early stages of vegetation growth, but is not useful for surfaces covered with vegetation. In contrast, the modified PDI (MPDI) showed acceptable performance in vegetated areas.
Iran, situated in western Asia, has an area of more than 1·6 million km2. The annual precipitation varies from c. 25 mm in the Central Plateau to over 2000 mm in the Caspian coastal plain, with a national annual average of 250 mm. Central Iran is a steppe-like plateau with a hot, dry climate (annual rainfall <200 mm; average summer temperatures >38°C) surrounded by desert and mountains (Zagros on the western border and Alborz to the north); c. 0·9 of the country is arid or semi-arid (Fig. 1).

Fig. 1. Geographical locations of agro-ecological zones and selected meteorological stations in Iran – numbers refer to the agro-ecological zones as given in Table 1 (modified from Malakouti et al. Reference Malakouti, Khoughar and Khademi2004).
Iran has been broadly divided into different agro-ecological zones based on climatic conditions and type of crops grown (Fig. 1 and Table 1). Approximately 0·44 of the cultivated crops in Iran are rain-fed, but they produce only 0·12 of the country's total crop production. However, rain-fed wheat accounts for c. 0·35 of the total crop production, and rain-fed barley accounts for c. 0·34 of the total production. In comparison, 0·9 of all orchards in Iran are irrigated (Malakouti et al. Reference Malakouti, Khoughar and Khademi2004) (Table 2).
Table 1. Description of the agro-ecological zones of Iran (source: Malakouti et al. Reference Malakouti, Khoughar and Khademi2004) and the selected representative weather stations (weather station data used for calculations of the water balance indicators and surface conditions of 1 km2 used for the remote sensing drought indices)

Table 2. Major crop areas of Iran in 2004
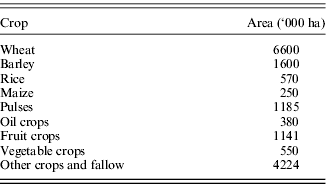
Source: Malakouti et al. Reference Malakouti, Khoughar and Khademi2004.
Iran frequently experiences recurring droughts. The most recent (1998–2001) was the worst in 30 years, with rainfall deficits consistently falling below 0·6 of the mean annual rainfall in most of the country. The severity of these droughts placed an extreme strain on water resources, livestock and agriculture. Crops from a rain-fed area of 4 million ha and those from an irrigated area of 2·7 million ha were completely destroyed during the drought period. By 2001, the total agricultural and livestock losses were estimated as US$2.6 billion. Eighteen out of the country's 28 provinces were affected, but the impact of the drought differed throughout the country (Morid et al. Reference Morid, Smakhtin and Moghaddasi2006).
In view of these problems, the present study re-examines newly developed remote sensing-derived drought indices for applications in the agricultural sector in Iran to contribute for a better preparedness to drought. The focus is on finding relationships between crop water balance (CR) indicators, such as potential and actual evapotranspiration or CR deficits. The main objective is to contribute to the construction of a simple drought-monitoring and crop irrigation decision-making system in Iran that is based on PDI.
MATERIALS AND METHODS
Data sources and preparation
Aiming to construct an agricultural drought-monitoring system for Iran and retest the remote sensing indices over ten agro-climatic zones of Iran, test sites with weather stations were selected. In total, 13 meteorological stations, representing each of the ten agro-climatic zones, were used as shown in Fig. 1. All stations are located within agricultural areas that are far from urban areas and represent the typical agricultural land use of the relevant agro-climatic region including vegetation coverage, crop type, rain-fed or irrigated crops. These stations are used operationally as agro-climatological stations by the Iran Meteorological Organization (IRIMO; Table 1). The data comprised monthly meteorological parameters, mean temperature, maximum temperature, minimum temperature, relative humidity, precipitation, wind speed at a height of 2 m and average daily sunshine from February 2000 to December 2005. The data, obtained from the IRIMO, were quality checked for potential errors (e.g. human or instrumental-based errors) and for data homogeneity. These data were applied to both the climatic water balance (CL) model and the crop water balance model. From Satellite images recorded during the same period by moderate resolution imaging spectroradiometer (MODIS) were applied to derive remote sensing-based drought indices. The indices included in the study are the PDI, the MPDI, the enhanced vegetation index (EVI) and the vegetation condition index (VCI). The Global MOD13A3 (Terra Vegetation Indices Monthly L3 Global 1 km SIN Grid) Version 5 product was used, which is provided monthly at 1 km spatial resolution as a gridded level-3 image in the Sinusoidal projection. This image includes 11 different data sets, which are freely available at the MODIS website in hierarchical data format. In generating these monthly images, the algorithm uses 16 day composite images at 1 km resolution to overlap the months and employ a weighted temporal average for each pixel if data from both periods are cloud free. In the case of clouds within the two 16 day periods, only the maximum reflectance value of each pixel out of the two periods is selected for the monthly image. To assess the advantages and disadvantages of each index in detecting and measuring drought intensity, all calculated indices were compared on the basis of their temporal and spatial extensions.
All of the images were converted to tagged image file format (TIFF), which is applicable for remote sensing and geographic information systems (GIS) software using the MODIS reprojection tool (MRT). By using MRT, four data sets including the EVI, the normalized difference vegetation index (NDVI), the near-infrared (NIR) and red (NIR–Red) reflectance were derived.
Crop-related water balance indicators, including CL, CR, monthly reference crop evapotranspiration (ET0), crop evapotranspiration (ETc) and required irrigation water (I), were computed at the weather station sites according to the suggestions of the Food and Agriculture Organization of the United Nations (FAO) for wheat in Iran (Allen et al. Reference Allen, Pereira, Raes and Smith1998). The details of this computation are presented below. Pixel values covering an area of about 1 km2 were used at the weather stations for comparison of the remote sensing indices with the CR indicators. With regard to the test site's description, it was assumed that every pixel represents an overall surface condition of the typical closed cropping areas of the relevant agro-climatic region (Table 1). This is a common method that has been used in other, similar remote sensing studies (Hartmann et al. Reference Hartmann, di Bella and Oricchio2003; Ji & Peters Reference Ji and Peters2003; Ghulam et al. Reference Ghulam, Qin and Zhan2007a, Reference Ghulam, Qin, Teyip and Lib, Reference Ghulam, Qin, Kusky and Li2008; Qin et al. Reference Qin, Ghulam, Zhu, Wang, Li and Nan2008; Jain et al. Reference Jain, Keshri, Goswami, Sarkar and Chaudhry2009).
Finally, linear regressions were calculated between the applied remote sensing indices (as the drought indicator) and CR indicators in the different agro-climatic zones using the monthly values. In these calculations, remote sensing data were assumed as independent variables and CR data were assumed as dependent variables. Calculations were performed over several growing seasons at the selected stations from February 2000 to December 2005. The Pearson correlation coefficient (r), has been used previously in similar studies (Lu et al. Reference Lu, Tao and Wu2007; Yue & Tan Reference Yue and Tan2007), and was used here to compare the relationships of PDI, MPDI, VCI and EVI with CL, CR, ET0, ETc and I.
Drought indicators based on CR
The CL model
Several methods and models for assessing CL values have been used by meteorologists and geographers (Wang et al. Reference Wang, Zhou, Zhang and Zang1998; Zhao et al. Reference Zhao, Xu, Zhong and Mao2000). The present study applies the following CL model:
where CLi is the climatic water balance in month i of the year, P i represents the precipitation in month i, and ET0 denotes the monthly ET0.
Calculations using the Penman–Monteith method, which is recommended by FAO (Allen et al. Reference Allen, Pereira, Raes and Smith1998), were based on monthly weather data and the ET0 in the following form:
where ET0 is the reference level of evapotranspiration of a short grass surface without water shortage (mm/day), R n represents the net radiation at the crop surface (MJ/m2/day), G denotes the density of soil heat flux (MJ/m2/day), r is the psychrometric constant (kPa/°C), T is the mean air temperature at a height of 2 m (°C), U 2 represents the wind speed at a height of 2 m (m/s), e s is the saturation vapour pressure (kPa), e a denotes the actual vapour pressure (kPa), e s−e a represents the saturation vapour pressure deficit (kPa) and Δ denotes the slope of the vapour pressure curve (kPa/°C). Due to a lack of data, the net radiation, R n, and the density of soil heat flux, G, were estimated using empirical formulas (Allen et al. Reference Allen, Pereira, Raes and Smith1998; Yang et al. Reference Yang, Fenga, Huang and Lin2008).
The CR model
In the present study, the CROPWAT V4.2 model developed by the Land and Water Development Division of FAO was used to calculate CR parameters (Clarke Reference Clarke1998). The CR is a measure of the difference between the precipitation and the water requirements of crops during crop growth periods. From studies by Zhao (Reference Zhao1996), Li et al. (Reference Li, Gao and Gua2004) and Yang et al. (Reference Yang, Fenga, Huang and Lin2008), the water balance model can be written as
where CRi is the crop water balance in month i (mm), P i represents the precipitation during month i (mm) and ETc is the monthly crop reference evapotranspiration (mm).
ETc is the amount of water used by a specific crop without water shortage and can be calculated using the crop coefficient approach (Allen et al. Reference Allen, Pereira, Raes and Smith1998; Fan & Cai Reference Fan and Cai2002). This approach can be written as
where K c is a crop-related coefficient (Yang et al. Reference Yang, Fenga, Huang and Lin2008). Winter wheat, being one of the most important agricultural crops in Iran and able to grow in all of the country's different climatic regions, was selected as a reference in the present study. In general, the growing period of winter wheat starts in late October and lasts until July (Ziaei & Sepaskhah Reference Ziaei and Sepaskhah2003). The K c was simulated by the CROPWAT model and varies depending on the developmental stage (Allen et al. Reference Allen, Pereira, Raes and Smith1998).
The I/crop water deficit
The I accounts for the difference between the effective precipitation and the water requirements of crops during crop growth periods; therefore, it also represents the crop water deficit. The following equation was used to calculate this parameter:
where Ii is the required irrigation water or crop water deficit in month i (mm) and Re i represents the effective precipitation during month i (mm), which is related to the mean monthly precipitation and the mean monthly consumptive water use considering soil and crop type (Dastane Reference Dastane1978). The soil-type data from the Land and Water Development Division of FAO were used (Land and Water Development Division 2003).
Remote sensing-based drought indices
PDI – background
Vermote et al. (Reference Vermote, Tanre, Deuze, Herman and Morcrette1997) and Ghulam et al. (Reference Ghulam, Qin and Zhan2007a) found that in a scatter plot of the atmospheric corrected near-infra-red (NIR) and red (NIR–Red) reflectance spectrum of any satellite image, a typical triangle shape is evident that reflects vegetation and SM conditions (Fig. 2). In Fig. 2, the AD line represents the change of surface vegetation from full cover (A) and partial cover (E) to bare soil (D). In contrast, BC refers to the SM status of the wet area (B) to the semi-arid surface and the extremely dry surface (C). As demonstrated, BC shows the direction of drought severity. Close but complex relationships exist between the surface spectrum, land cover types and surface drought conditions. In addition, different land cover types manifest a certain regular distribution in the NIR–Red spectral space. From this information, the vegetation coverage can be described and the surface drought severity can be characterized quantitatively in the space. Ghulam et al. (Reference Ghulam, Qin and Zhan2007a) proposed the construction of an orthogonal axes system above the previously mentioned triangular shape (Fig. 3) and presented two perpendicular remote sensing-based drought indices from this orthogonal axes system.

Fig. 2. A typical triangle shape on NIR–Red spectral space (source: Ghulam et al. Reference Ghulam, Qin and Zhan2007a).

Fig. 3. Construction of an orthogonal axes system on NIR–Red spectral space (source: Ghulam et al. Reference Ghulam, Qin and Zhan2007a).
PDI
The mathematical formula for PDI can be written as follows:
where R NIR and R Red are the atmospherically corrected surface reflectances of NIR–Red and NIR bands of remotely sensed data, and M represents the slope of the soil line in the NIR–Red feature space (Ghulam et al. Reference Ghulam, Qin and Zhan2007a). The PDI is a line segment parallel to the soil line and perpendicular to the normal of the soil line that dissects the coordinate origin. The PDI describes the distribution of SM in the NIR–Red feature space. Points far from the normal line in the NIR–Red space correspond to surfaces with a low SM, whereas points near the normal line represent wet surfaces. The PDI, based on the NIR–Red spectral space, is simple and easy to obtain. The PDI values vary between 0 and 1. A large PDI indicates severe water stress, whereas small PDI indicates low water stress. Since many soil biophysical features, including soil surface colour and vegetation conditions, affect NIR and NIR–Red reflectance, this index requires a local calibration to obtain the coefficient M over the different study areas or sample windows.
The PDI is effective for bare soil applications. However, there are some limitations that challenge the performance of the PDI in areas where the surface cover types vary from bare soil to densely vegetated surfaces and are characterized by non-flat topography with different soil types (Ghulam et al. Reference Ghulam, Qin, Teyip and Li2007b).
MPDI
According to the definition of the PDI, areas with full vegetation cover, partial cover and dry bare soil may have the same perpendicular distance from a reference line and, therefore, have the same PDI value. The maximum PDI value, which is expected over dry bare soil, might also be observed over a vegetated surface. As a consequence, the PDI indicates ‘drought’ for agricultural lands when the corresponding bare soil is defined as stressed, even if there is no drought. Ghulam et al. (Reference Ghulam, Qin, Teyip and Li2007b) introduced the term f v into the PDI to separate the effects of vegetation on the index and called it the MPDI, expressed as
where f v is the fraction of vegetation defined as the fraction of ground surface covered by vegetation (Baret et al. Reference Baret, Clevers and Steven1995), R v,Red and R v,NIR are the pure vegetation reflectances in the NIR–Red and NIR bands, respectively, and may be regarded as coefficients. When leaf water content, leaf angle distribution, sun and viewing geometry are assumed to be fixed, variations in canopy reflectance are dependent on f v (i.e. it is f v, not R v,Red and R v,NIR, that causes the canopy reflectance variations). In the present study, R v,Red and R v,NIR have estimated values of 0·05 and 0·5, respectively (Ghulam et al. Reference Ghulam, Qin, Teyip and Li2007b). Similar to the PDI, the MPDI is derived using the NIR–Red and NIR reflectances, but it is dependent on the SM status and on vegetation growth, which is characterized by activity rates, greenness and stress levels.
EVI
The EVI was developed by Huete et al. (Reference Huete, Didan, Miura, Rodriguez, Gao and Ferreira2002) for use with MODIS data. Unlike NDVI, it takes advantage of multiple bands. The EVI is calculated as follows:
where R Blue is the blue band reflectance, C 1 and C 2 are the atmosphere resistance red and blue correction coefficients, respectively, L is the canopy background brightness correction factor and G a is the gain factor.
VCI
This index was first described by Kogan (Reference Kogan1995, Reference Kogan1997). It effectively shows how close the current month's NDVI is to the minimum NDVI, as calculated from the long-term record of remote sensing images. This index is calculated as follows:
where NDVImax and NDVImin are calculated from the long-term record (20 years) for that month (or week), and i is the index of the current month (or week). The condition (health) of the vegetation, represented by the VCI, is reported as a proportion and may serve as an approximate measure of the dryness of the current month. During extremely dry months, the vegetation conditions are poor and the VCI is close to or equal to zero. A VCI of 0·5 reflects fair vegetation conditions. At optimal vegetation conditions, the VCI is close to 1·0. At this condition, NDVI for the current time step (month, week) is equal to NDVImax.
RESULTS
The results of the present study are presented in two parts: spatial and temporal analyses.
Spatial analysis of remote sensing indices
The spatial comparison between the test sites of the relevant agro-climatic zones is based on the monthly drought indicators from 2007 to 2009 (3 years). The results indicate that there are different relationships between the remote sensing indices PDI, MPDI, VCI and EVI v. the different CR indices, depending on location and the relevant agro-climatic zone (Table 3).
Table 3. Significant correlations between the monthly drought indices and crop-related water balance indicators for the different agro-ecological zones of Iran from February 2000 to December 2005 (from highest to lowest; numbers refer to the agro-ecological zones as given in Table 1 – only regions with significant correlations are shown)
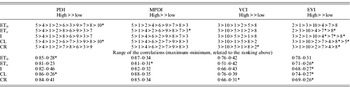
* Correlation in this zone is significant at P<0·05 (2-tailed); others are significant at P<0·01 (2-tailed).
In zone 1, which is characterized by dry climatic conditions (Table 1), the test site is covered by irrigated crop fields, and MPDI performs better than PDI, VCI and EVI. For example, the correlation between MPDI and I is 0·68 (P<0·01), but for PDI, VCI and EVI this correlation is 0·63, 0·45 and 0·63 (P<0·01, data not shown). This zone includes the largest irrigated area, reflecting the lack of precipitation during the growing season, and the fact that the majority of the zone is covered by agricultural fields. MPDI showed the highest correlation with the crop water deficit indicator I in zone 1.
In zone 2, the test site with full vegetation coverage, the remote sensing indices behave very similar to those in zone 1. This zone is characterized by wet and humid conditions, and the majority of this zone, including the test site, is dominated by rain-fed cropping.
In zone 3, which covers a large part of the high mountainous area of Iran, VCI and EVI perform better than PDI and MPDI. Under these agro-climatic conditions, EVI and VCI perform well for detecting CR conditions. Similar results have been demonstrated previously (Shahabfar & Eitzinger Reference Shahabfar, Eitzinger, Eitzinger and Kubu2009).
Zone 4 is located in the semi-mountainous area of Iran. According to the present results at this station, PDI has the highest correlation with ET0 (r=0·73), ETc (r=0·65), I (r=0·64), CL (r=0·74) and CR (r=0·68) (all P<0·01) and MPDI perform better than the other remote sensing indices VCI and EVI (not statistically significant).
The test site in zone 5 is located within densely irrigated farms in Khuzestan province. Extreme transpiration and very hot and humid conditions are the main climatic characteristics of this zone (Table 1). This zone also belongs to the most productive agricultural region in Iran. The main crop is winter wheat, which grows during the cold season. During the warm season, dates and orchard fruits are produced. Here, MPDI and PDI show the highest correlations with CR parameters (Table 3). For example, the highest correlations between PDI and MPDI v. ET0 are 0·85 and 0·87, respectively (for both correlations P<0·01).
The test sites in zones 6–9 represent arid or semi-arid regions of Iran, where the major climatic characteristics are low precipitation and humidity, and hot, dry seasons. The major agricultural crop in these zones is irrigated winter wheat. Ground water and seasonal rivers that flow during rainfall seasons are the main irrigation resources in these semi-arid to arid regions. In these zones, the correlation between the MPDI and ET0, ETc, I, CL and CR is stronger than those of the other remote sensing indices including PDI, VCI and EVI.
The selected weather station in zone 10 is located in a semi-mountainous area surrounded by different vegetation types including complex rain-fed and irrigated farms. At the study site of this zone, VCI showed the best correlation to the water balance indicators, similar to zone 3 (Table 3).
Temporal analysis of remote sensing indices
Figure 4 shows monthly comparisons of several indices in two different agro-climatological zones, 1 and 10, which are the two regions with the best and worst results. The study period from February 2000 to December 2005, includes five separate growing seasons. For comparison, all indices were standardized (index values minus the average of the index during the study period divided by standard deviation). Figure 4a indicates that in several winter wheat-growing periods, there is a strong relationship between the PDI and MPDI and the applied CR parameters. With the exception of zones 3, 4 and 10, during the first three growing seasons of 2000/01, 2001/02 and 2002/03, there were significant correlations between fluctuations in the PDI and MPDI and the CR indicators. Therefore, the PDI and MPDI were able to reflect drought conditions but were subject to variation in different years, showing a higher temporal relationship with all of the five studied CR parameters compared to the other remote sensing indices, especially in periods of wheat development (Table 4) from February 2000 to December 2005.

Fig. 4. The temporal distribution of remote sensing indices v. crop water parameters for the period from February 2000 to December 2005 in two agro-climatological zones of Iran: (a) zone 1 and (b) zone 10.
Table 4. Significant correlations between drought indices and crop-related water balance indicators over Iran for the different months (from highest to lowest; numbers refer to months, starting with January=1 and ending with December=12 – only months with significant correlations are shown)

* Correlation in this zone is significant at P<0·05 (2-tailed); others are significant at P<0·01 (2-tailed).
DISCUSSION
A good agricultural drought monitoring system should be able to account for the variable susceptibility of crops during different stages of crop development, focusing on precipitation shortages, differences between actual and potential evapotranspiration and soil water deficits (Rhee et al. Reference Rhee, Im and Carbone2010). Therefore, the present study evaluated several drought indices for Iran, focusing on MPDI and PDI and other remote sensing based indices to detect the severity of drought phenomena for agricultural crop production. Both the temporal and spatial variations were evaluated and compared with CR indicators at selected agricultural sites in different agro-climatic zones.
In a previous study by Shahabfar & Eitzinger (Reference Shahabfar, Eitzinger, Eitzinger and Kubu2009), PDI and MPDI were compared with meteorological drought indices at 180 meteorological stations over Iran. Those authors also found that in the northern region of zone 10, where the vegetation coverage varies from dense to average, MPDI performed best for drought detection. In comparison, in the middle and southern region, which has poor vegetation coverage or bare soil, PDI showed the best relative performance.
There are several previous studies where indices such as NDVI, VCI and EVI were used for vegetation condition monitoring in arid and semi-arid regions (Diouf & Lambin Reference Diouf and Lambin2001; Singh et al. Reference Singh, Roy and Kogan2003; Song et al. Reference Song, Saito, Kodama and Sawada2004; Sun et al. Reference Sun, Gao, Liu and Li2004; Anyamba & Tucker Reference Anyamba and Tucker2005; Bhuiyana et al. Reference Bhuiyana, Singha and Kogan2006; Martiny et al. Reference Martiny, Camberlin, Richard and Philippon2006; Bajgiran et al. Reference Bajgiran, Darvishsefat, Khalili and Makhdoum2008; Murthy et al. Reference Murthy, Sesha Sai, Chandrasekar and Roy2009; Quiring & Ganesh Reference Quiring and Ganesh2010). All of these studies concluded that NDVI, VCI and EVI could be used as indicators in drought early warning systems based on the received correlations between precipitation and/or biomass.
For example, Diouf & Lambin (Reference Diouf and Lambin2001) found that over the test sites in Ferlo, Senegal, the mean correlation between NDVI and biomass during 1988–1995 was 0·68 (P<0·01). Anyamba & Tucker (Reference Anyamba and Tucker2005) found that the correlation between NDVI and rainfall anomaly time series for 1981–2000 was positive and significant at 0·78 in the Sahel region. Sun et al. (Reference Sun, Gao, Liu and Li2004) concluded that annual evapotranspiration is highly correlated with integrated NDVI with a correlation coefficient of 0·77. These results were obtained from recorded data in meteorological stations located in the Yellow River Basin, China, in 1992. According to Quiring & Ganesh (Reference Quiring and Ganesh2010), the mean relationship between VCI and meteorological drought indices including Zscore, Palmer Drought Index, Standardized Precipitation Index (1-, 2-, 3-, 6-, 9-, 12- and 24-month), proportion of normal and deciles based in 254 Texas counties are 0·33, 0·51 (P<0·05), 0·20, 0·38, 0·44, 0·53 (P<0·05), 0·51 (P<0·05), 0·44, 0·34, 0·17 and 0·20, respectively.
In the present study, the VCI and EVI in all zones are less correlated with the applied water balance indicators compared to PDI and MPDI, except at the sites in zones 3 (northwest of Iran) and 10 (northeast of Iran). Bajgiran et al. (Reference Bajgiran, Darvishsefat, Khalili and Makhdoum2008) also found that in the northwest of Iran VCI (and NDVI) showed a strong correlation with average 3-month precipitation. They concluded that both VCI and NDVI show good performance in monitoring of vegetation condition in this area and suggested VCI as drought index in this area at regional scale. However, they recommended that for obtaining more reliable results their approach must be tested in different climates, using a combination of different climatic factors (such as temperature and precipitation). The present study confirms that at the test sites covered with complex and heterogeneous vegetation types, neither the MPDI nor the PDI perform satisfactorily. Their performances could be improved, however, with increased spatial resolution of the applied satellite images.
As shown by the results of the temporal analysis, the correlations between the remote sensing drought indices and crop-related water balance indicators vary by month. The MPDI shows the best results in April during the heading and flowering stages of winter wheat. In contrast, the PDI show the best results during January, February and April during the jointing stage of winter wheat with less vegetation coverage. Therefore, both PDI and MPDI in combination show the best performance during the full winter wheat-growing season, where this crop is very sensitive to drought. Referring to Eqn (6), PDI is a function of infrared (IR), NIR and the slope of the soil line in the NIR–Red feature space (M), and unlike MPDI does not contain a vegetation component. Therefore, this perpendicular index is a good indicator of SM for bare soil or partially uncovered soil. However, the VCI and EVI performed better than the perpendicular indices in June and July. These months represent the final growing stage of winter wheat when the use of drought monitoring or water management is less beneficial.
Overall, the spatial analysis results show that the strongest correlation between the studied remote sensing indices and crop-related water balance indicators belongs to PDI in regions or sites with homogeneous vegetation, which was the case in eight out of ten agro-ecological zones in Iran. The temporal analysis shows that PDI performs best at the early growing stages and MPDI is better for full vegetation coverage or late crop development stages. In contrast, the remote sensing indices VCI and EVI performed better in heterogeneous vegetated areas or very late crop development stages of wheat. The present study confirms the results presented by Ghulam et al. (Reference Ghulam, Qin and Zhan2007a, Reference Ghulam, Qin, Teyip and Lib, Reference Ghulam, Qin, Kusky and Li2008) and Qin et al. (Reference Qin, Ghulam, Zhu, Wang, Li and Nan2008). Because of the semi-arid and arid conditions found throughout Iran and considering that winter wheat is a major agricultural crop in Iran, PDI (for partly covered vegetated areas) and MPDI (for fully covered vegetated areas) can be used as simple and cost-efficient drought indices derived from MODIS satellite images. This finding has potential significance for agricultural crop growing regions in other developing countries with similar climatic conditions. To further improve the accuracy of the achieved results and reduce the level of uncertainties, the use of additional field observations, more ground-based soil water content measurements, considering other important crops or crop rotations and increasing the temporal resolution of remote sensing indices (weekly or daily images) is recommended.
This work was supported by the Austrian Agency for International Cooperation in Education and Research (OeAD). The authors would like to thank Dr. Abuduwasiti Wulamu for his constructive comments. They would also like to thank the Iran Meteorological Organization (IRIMO), which provided the meteorological data required for this study, and the US Geological Survey (USGS) Earth Resources Observation and Science (EROS) Center, which provided the MODIS satellite images that were used in this paper. The authors would like to extend their thanks to the anonymous reviewers for their valuable comments and suggestions.


