


Recent investigations have identified that high protein consumption in young children may be associated with excess weight gain( Reference Gruszfeld, Weber and Gradowska 1 – Reference Voortman, van den Hooven and Tielemans 3 ). In the UK, the National Diet and Nutrition Survey (NDNS) and the 2011 Diet and Nutrition Survey in Infants and Young Children show that children in the complementary feeding phase were consuming protein in excess of their requirements( 4 ). In the Gemini cohort, the largest contemporary dietary dataset in the UK for children of approximately 2 years of age, children aged 21 months consumed on average 40 g of protein per d, compared with the 15 g/d recommended by the Department of Health for children aged 1–3 years( Reference Syrad, Llewellyn and van Jaarsveld 5 ).
Protein intake is a known dietary determinant of circulating insulin-like growth factor-1 (IGF-1) levels in humans( Reference Martin, Holly and Gunnell 6 ), an important factor in linear growth in childhood( Reference Rogers, Emmett and Gunnell 7 ), but also in adipocyte differentiation and maturation through direct induction of cellular multiplication( Reference Wabitsch, Hauner and Heinze 8 ), and through feedback inhibition of the lipolytic effect of growth hormone. Intakes of total, animal and dairy protein (from dairy and meat sources), but not vegetable protein (from cereal, fruit and vegetable sources), have been independently correlated with serum IGF-1 concentration, in observational studies of young children( Reference Thorisdottir, Gunnarsdottir and Palsson 2 , Reference Hoppe, Udam and Lauritzen 9 ). Trials of milk supplementation in both infants (9–12 months) and young children (6–8 years) have resulted in higher IGF-1 levels( Reference Larnkjaer, Hoppe and Mølgaard 10 , Reference Hoppe, Molgaard and Juul 11 ). These results suggest that different sources of protein may have varying metabolic effects with consequences for growth in the early years.
Studies that have sought to identify associations between different protein types and excess adiposity in children, have led to mixed findings: in the Second Icelandic Infant study, total animal protein, but not vegetable protein at 12 months, was associated with a higher BMI at 6 years. However, dairy protein and meat protein were not individual predictors of BMI at 6 years( Reference Thorisdottir, Gunnarsdottir and Palsson 2 ). A small Dutch cohort of 120 children also found significant associations between higher animal protein intake and increased BMI at 8 years and greater odds of overweight and obesity at 9 years( Reference Weijs, Kool and van Baar 12 ). However, it is unclear whether specific sources of animal protein can explain the association between animal protein and BMI in this study. Total protein and total animal protein (including dairy and meat protein) at 12 months, but not at 18–24 months, showed the same positive association with BMI and adiposity at 7 years, in a study of 203 German children( Reference Günther, Remer and Kroke 13 ). Analysing the sources of protein at 12 months separately, found only dairy protein, but not protein from meat or cereals, was associated with BMI at 7 years. Interpretations of these studies are limited by their small sample sizes, variation in ages at exposure and outcome measurement, duration of follow-up and single-point outcome measurement. In addition, these studies were often not comparable in their definition of protein sources; for example, some combine dairy protein with other animal protein into one single exposure variable.
Establishing which types of proteins are associated with weight gain and the dietary patterns by which they are consumed will help to both better understand their relationships and to translate this information into public health advice. Defining diets as a pattern of foods through analytic techniques such as reduced rank regression (RRR) helps explain the variation in specific nutrients of interest (e.g. protein) and makes it easier to interpret the dietary exposures at a food level. This approach takes into account hypothesised mechanisms such as the potential role of the protein–IGF-1–growth hormone axis( Reference Martin, Holly and Gunnell 6 , Reference Rogers, Emmett and Gunnell 7 ), or alterations of methyl donor metabolism and epigenetic processes( Reference Lind, Larnkjær and Mølgaard 14 ) to allow clearer detection of the association with weight increases over the early childhood period.
The aims of this study were to (i) examine the prospective associations between specific protein sources, weight and obesity risk; (ii) derive a prevalent dietary pattern that explains intakes of specific protein sources and (iii) examine the prospective associations between this dietary pattern, weight gain and obesity, in a cohort of young UK children.
Methods
Study population and design
The population consisted of 4804 twins enrolled in the Gemini study, a large population-based birth cohort of British families with twins born in England and Wales in 2007. Details of this cohort have been described previously( Reference van Jaarsveld, Johnson and Llewellyn 15 ). In brief, all families with live twin births during March to December 2007 (n 6754) were invited to participate by the Office for National Statistics. A total of 2402 families (35·6 % response rate) were recruited and completed a baseline questionnaire when the children were approximately 8·2 (sd 2·2) months old, collecting information on child anthropometrics, activity behaviours, birth complications, medical conditions, appetite traits and the introduction of solid foods, as well as parental feeding style, demographics, anthropometrics, health behaviours, parent illnesses and medical conditions. Data collection included dietary data collected at an average of 21 (sd 1·2) months of age and repeated measures of anthropometrics from birth to 60 months of age (see Fig. 1). The University College London Committee for the Ethics of Non-National Health Service Human Research granted ethical approval for the Gemini study.
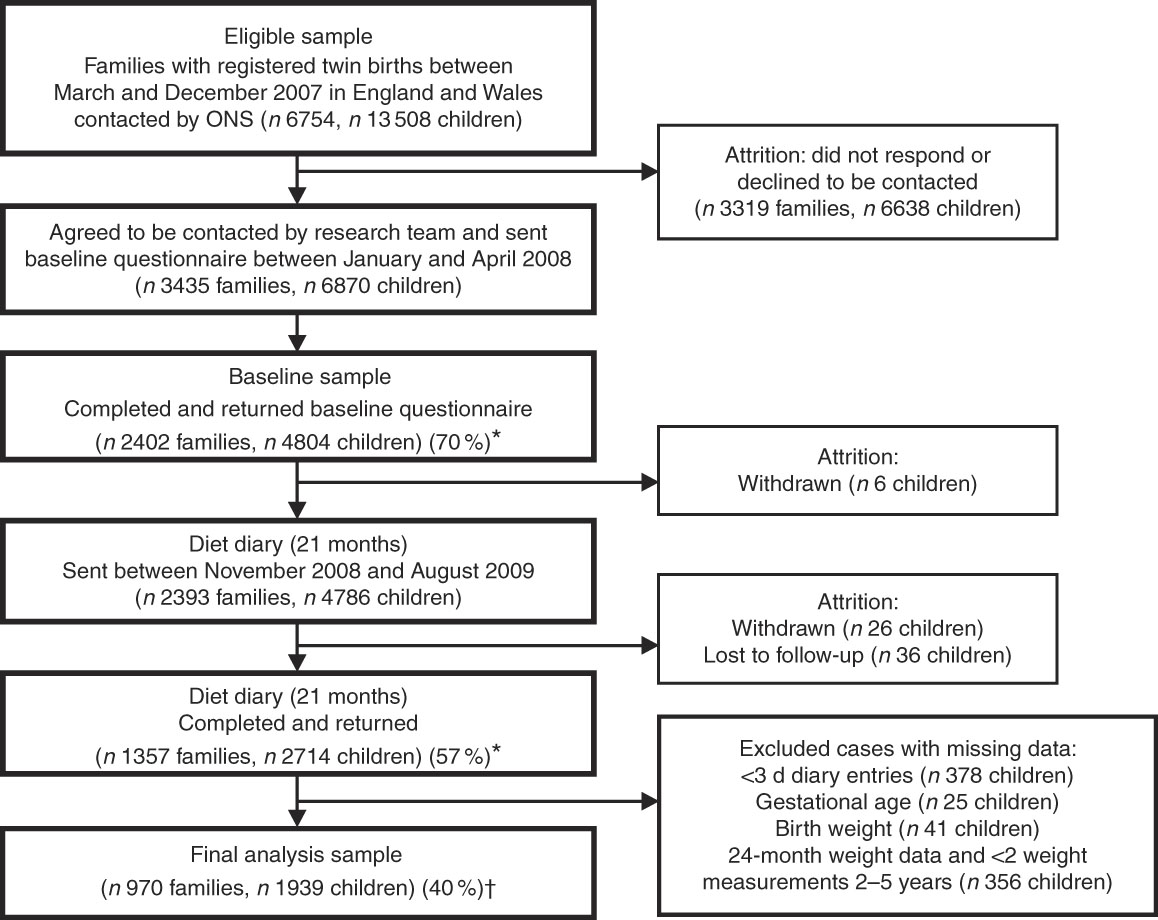
Fig. 1 Flowchart of Gemini study participants. * Response rates are given in parentheses (%). † Retention rate of cohort for present analyses. ONS, Office for National Statistics.
Dietary variables
In all, 3-d diet diaries were sent to all Gemini families for completion between November 2008 and August 2009. Parents were provided with detailed instructions and portion guides adapted from the preschool food atlas, to facilitate accurate estimation of intakes of different types of foods. Parents were asked to record all food and drinks consumed by each twin over 3 d (including any two weekdays and one weekend day). Completed diet diaries for 2714 children (56 % of twins originally recruited) were received. The average age when the 3-d diet diary was completed was 21 (sd 1·2) months. Diaries including only one recorded day, completed for children outside of the 18–27 months age range, or completed with more than 28 d between the first and last day of diary entry were excluded to ensure the data represented dietary intake for a given month of age. Diaries from twins of unknown zygosity were excluded. These exclusion criteria combined resulted in including 1216 diaries for a total of 2432 twins for analysis (50·6 % of the original cohort). Despite instructions, some diaries were not completed using a combination of weekdays and weekend day (n 684), but these were included as diet for this age group is unlikely to be greatly biased by the day of the week reported, as it is thought to be for adults( Reference Thane and Stephen 16 ).
The estimated 3-d diet diary method is similar to that used in the UK NDNS( Reference Bates, Lennox and Prentice 17 ), coded using a continually updated food composition database( Reference Fitt, Cole and Ziauddeen 18 ) based on McCance and Widdowson’s Composition of Foods, 6th edition( 19 ), related supplemental material and manufacturer information.
To quantify the consumption of protein more accurately, composite foods and meals were disaggregated( Reference Fitt, Mak and Stephen 20 ). Portion sizes of discrete protein-based foods were based on reference portion sizes( 21 ).
Individual food items were classified into forty-five food groups reflecting broad food groups used in NDNS, with further disaggregation of groups (e.g. milks) to allow animal, plant, dairy protein sources to be separated (see online Supplementary information). Animal protein was defined as protein in g/d and as a proportion of total energy (%E) sourced from red and white meat, processed meats, fish and eggs, but excluded dairy protein, as this was a specific protein source of interest. Using %E as a measure of protein intake reduces measurement error, as a consequence of the correlation between errors in macronutrients and energy as the total energy intake is the sum of the energy from the individual macronutrients( Reference Kipnis, Subar and Midthune 22 ). Use of self-reported energy intake energy adjustment of other self-reported dietary constituents has been proposed to also improve risk estimation in studies of diet–health associations. Subar et al.( Reference Subar, Freedman and Tooze 23 ) suggest that while self-reported energy intake as a measure of true energy intake may not be valid, it is valid to use self-reported energy intake for energy adjustment of other self-reported dietary constituents to improve risk estimation in studies of diet–health association.
No distinction was made between processed and unprocessed meat. Milk protein constituted a significant part of total dairy protein and was separated from other dairy products such as cheese, yogurts, butter and cream, to characterise intake of milk protein only. Formula milk and breast milk protein were classified under dairy protein. Although their composition differs from cow or goats’ milk, the source of protein is closest to dairy and few consumers with low consumption levels in this cohort mean that this difference was unlikely to affect results strongly. Protein intake from cereals, fruit, vegetable, nuts, pulses and potatoes and plant-based milks was combined as plant protein.
Dietary pattern analysis
RRR was used to identify a combination of food intakes constituting a dietary pattern that could explain the maximum variation in intake of animal, dairy and plant protein( Reference Hoffmann, Schulze and Schienkiewitz 24 ). The RRR model included all forty-five food groups (g/d) as predictors and the three intermediate variables of interest: animal protein, dairy protein and plant protein (all %E). As three intermediate variables were included, the RRR model identified three dietary patterns. The dietary pattern of most relevance was identified according to how much of the total variation in intermediate variables it explained. The RRR model scored each study participant for each dietary pattern with a z-score, indicating the degree to which their reported dietary intake reflected the observed dietary pattern, relative to others in the cohort.
Anthropometric variables
Methods for data collection of anthropometric and dietary variables have been described elsewhere( Reference Syrad, Llewellyn and van Jaarsveld 5 , Reference van Jaarsveld, Boniface and Llewellyn 25 ). Briefly, parental reports of child weight and height were collected every 3 months by electronic and postal questionnaires, from birth to 60 months of age, along with the date of each measurement. This was collected up to 24 months of age from healthcare professionals’ records, after which parents were sent electronic weighing scales and height measurement wall charts along with detailed instructions on how to measure, record, and report their twins’ weights and height every 3 months. Measurements were recorded and reported to researchers up to a median age of 55·0 (interquartile range (IQR) 42·0–60·7) months for the last recorded measurement at the time of this analysis. A total of 2154 twins with included diet diaries provided at least two anthropometric measurements up to 60 months. BMI was calculated as kg/m2 and age specific International Obesity Task Force cut-offs used to provide data on subjects’ overweight/obesity status and to allow results to be comparable with other studies conducted in other countries( Reference Cole and Lobstein 26 ). Data on overweight/obesity status between 33 and 39 months and between 57 and 63 months were combined to provide data on overweight/obesity at 36 (sd 3) and 60 (sd 3) months, respectively, to maximise data at these two specific time points. Children were also coded as ever or never being overweight or obese from diet diary to end of follow-up (at 60 months/5 years of age).
Statistical analyses
Protein intakes were analysed as absolute amounts (g/d) and as a %E intake, to investigate the role of total protein intake as well as the contribution of protein to the overall macronutrient composition of the diet. Associations between animal protein, plant protein and dairy protein intake at 21 months and repeated measures of weight and BMI were analysed using linear mixed-effect models. These used repeated measurements of BMI and weight from the first measurement available after the diet diary (median age 24·1 (IQR 22·1–24·8) months) up to 60 months of age as the outcome variable, time at measurement (months) as the level-1 predictor and measures of protein intake as the level 2 predictor variable. The best-fitting models (according to likelihood ratio testing) included a random intercept and slope and unstructured covariance between the random effects at both the twin pair and the individual level. To adjust for the within-pair clustering of twins, all regression models included a cluster term for family.
Logistic mixed-effect models, with the same random effects structure as described above, evaluated the prospective association between specific sources of protein intake at 21 months and the odds of being overweight or obese at 36 (sd 3), 60 (sd 3) months, and at any point up to 60 (sd 3) months of age.
Dietary pattern z-scores at 21 months of age were investigated in relation to repeated measures of weight and BMI up to 5 years of age using the linear regression mixed-effects models, and odds of overweight and obesity using logistic mixed-effects models, as mentioned above.
Covariates were tested for inclusion in both the linear and logistic regression models using forward stepwise selection. These included factors identified in the literature as having a relationship with dietary intake and adiposity: demographic variables for sex, age at diet diary entry (months), zygosity, ethnicity (white v. other) and family socio-economic status (three categories). We also tested the following variables which indicate prior nutrition and growth: feeding method in the first 3 months of life (seven categories ranging from exclusively breast-fed to exclusively bottle-fed), mean daily energy intake (kJ), maternal BMI at baseline (four categories for underweight, normal weight, overweight and obese), rate of prior weight gain between birth and time of dietary intake measurement (derived using mixed-effect regression( Reference Pimpin, Jebb and Johnson 27 )) and birth weight (kg). Height (cm) was included in weight models only. Total intake of fat was additionally included in the model to allow interpretations of macronutrient substitution. In models where protein intake was analysed as %E, mean daily fat as a proportion of energy intake (%E fat) was included, while models of protein intake in g/d included total g/d fat intake.
After covariate testing, the adjusted models included exact age at dietary assessment, sex, birth weight, rate of previous growth (in weight gain), fat intake (%E fat or g/d), total energy intake and height (where weight was outcome). As there was no interaction between %E from total protein and age in our previous analyses( Reference Pimpin, Jebb and Johnson 27 ), no interaction was included these models.
Results
Dietary information was available for 2432 children. The number of participants who provided weight and height up to 60 months varied according to the outcome measure. The prevalence of overweight and obesity was 12 % at 36 months, 6 % at 60 months and 16 % at any time point between 21 and 60 months (data not shown).
Intake of types of protein
Dairy sources represented almost half of all protein intake (Table 1 and online Supplementary Table S2) of which three-quarters was from milk. Animal protein (defined as protein derived from meat, chicken, fish and eggs) and plant protein combined accounted for most of the remaining protein intake. Animal and dairy protein intakes were modestly negatively inversely correlated in this population (r −0·24), and there was a strong inverse correlation between intakes of dairy and plant protein (r −0·54). There was no correlation between animal and plant protein (r −0·04) (data not shown).
Table 1 Intake of protein by source (g/d, percentage of total protein and percentage of total energy)* (Mean values, standard deviations and ranges; n 2432)
* Animal protein defined as protein derived from meat, chicken, fish and eggs, dairy protein defined as protein derived from milk, cheese and yogurt products.
Association between intake of types of protein and weight, BMI or odds of overweight/obesity
Table 2 shows that intake of dairy protein and milk protein in g/d and as a %E intake were both associated with greater weight and higher BMI up to 60 months. A 1% higher %E from dairy protein at 21 months was associated with 46 g (95 % CI 21, 71) greater weight and with 0·04 (95 % CI 0·004, 0·070) greater BMI on average, at any age between 21 and 60 months, after adjusting for confounders. Similarly, a 1 g/d higher dairy protein intake was positively associated with greater weight and BMI on average up to 60 months (Table 2). Intake of milk protein showed slightly stronger associations with weight and BMI. The difference in milk protein intake between children in the 10th and 90th centile in the Gemini study was 15·1 g/d (equivalent to approximately 415 ml of semi-skimmed milk). Applying the coefficient to this difference equates to a 300 g difference in weight and 0·35 BMI units, between children in the 10th and 90th percentile of milk protein intake.
Table 2 Association between intake of animal, dairy and plant protein (% total energy and g/d) and repeated measures of weight and BMI between 21 and 60 months* (β-Coefficients and 95 % confidence intervals)
* Animal protein defined as protein derived from meat, chicken, fish and eggs, dairy protein defined as protein derived from milk, cheese and yogurt products. β per 1-unit increase in dietary variable, linear mixed-effects model (P value is for test of null hypothesis: β=0). Model 1 includes protein exposure variable of interest and repeated measures of weight (kg) or BMI between the first measurement available after diet diary and the last measurement up to 60 months as the outcome, adjusted for total energy intake (kJ) and height (cm, weight models only). Model 2 includes all variables from model 1 and adjusts for sex, age at diet diary (months), birth weight (kg), modelled rate of prior weight gain, or BMI, depending on the response variable, from birth to time of diet diary, and total fat intake (% energy from fat or g/d), depending on measure of protein modelled.
† Estimates are P values <0·05 (Bonferroni correction for multiple testing indicates a P value of <0·0001 to reject the null hypothesis)
These results were similar when examining the odds of overweight or obesity. In adjusted models, intake of dairy protein (in both %E and g/d) at the expense of energy from other protein or carbohydrates at 21 months, was weakly associated with increased odds of overweight or obesity at 3 years, but not up to or at 60 months of age (Table 3). The association for milk protein was of a similar magnitude but more consistent. A higher milk protein (g/d or %E) at the expense of other protein and carbohydrates was associated with increased odds of overweight or obesity at 36 and 60 months (Table 3).
Table 3 Association between intake of animal, dairy and plant protein (% total energy and g/d) and odds of overweight and obesity during follow-up to 60 (sd 3) months of age* (Odds ratios and 95% confidence intervals)
* Animal protein defined as protein derived from meat, chicken, fish and eggs, dairy protein defined as protein derived from milk, cheese and yogurt products. OR per 1-unit increase in dietary variable, logistic mixed-effects model (P value is for test of null hypothesis: OR=1). Model 1 adjusts for total energy intake (kJ). Model 2 additionally adjusted for age at diet diary (months), sex, birth weight (kg), modelled rate of prior weight gain and total fat intake (% energy from fat or g/d, depending on measure of protein modelled).
† Estimates are P values <0·05 (Bonferroni correction for multiple testing indicates a P value of <0·0001 to reject the null hypothesis).
No association was observed between animal protein or plant protein and weight, BMI or the odds of overweight or obesity at any age (Tables 2 and 3).
Dietary patterns of protein type
The three dietary patterns identified through the RRR analysis described combinations of foods consumed that explain protein intakes: dietary pattern 1 was modestly correlated with %E from animal protein (r 0·23) and had a strong negative correlation with %E from dairy protein (r −0·75) and a strong positive correlation with % E from plant protein (r 0·62). Factor loadings (Fig. 2) show that this ‘low-dairy, high-plant protein’ pattern was characterised by low intakes (negative factor loadings) of animal milk (largely cows’ milk), cream and cheese, chocolate, yogurts and dairy desserts and positively associated with intakes of plant-based milks (e.g. soya milk), pulses, fruit, bread, vegetables, potatoes, pasta, rice and white meat (positive factor loadings). The other two patterns explained very small amounts of total variation in protein sources (17 and 7 %) and were, therefore, less meaningful. Table 4 shows the proportion of total variation in protein sources explained by each of the three dietary patterns identified. Pattern 1 explained the most variation in all three protein source variables (41 %). As the first pattern explained the most variation in all protein sources, we took this pattern forward for analysis in relation to anthropometric measurements. The z-scores for this dietary pattern had a mean of 0 (sd 0·96) and ranged from −3·6 to 5·6.
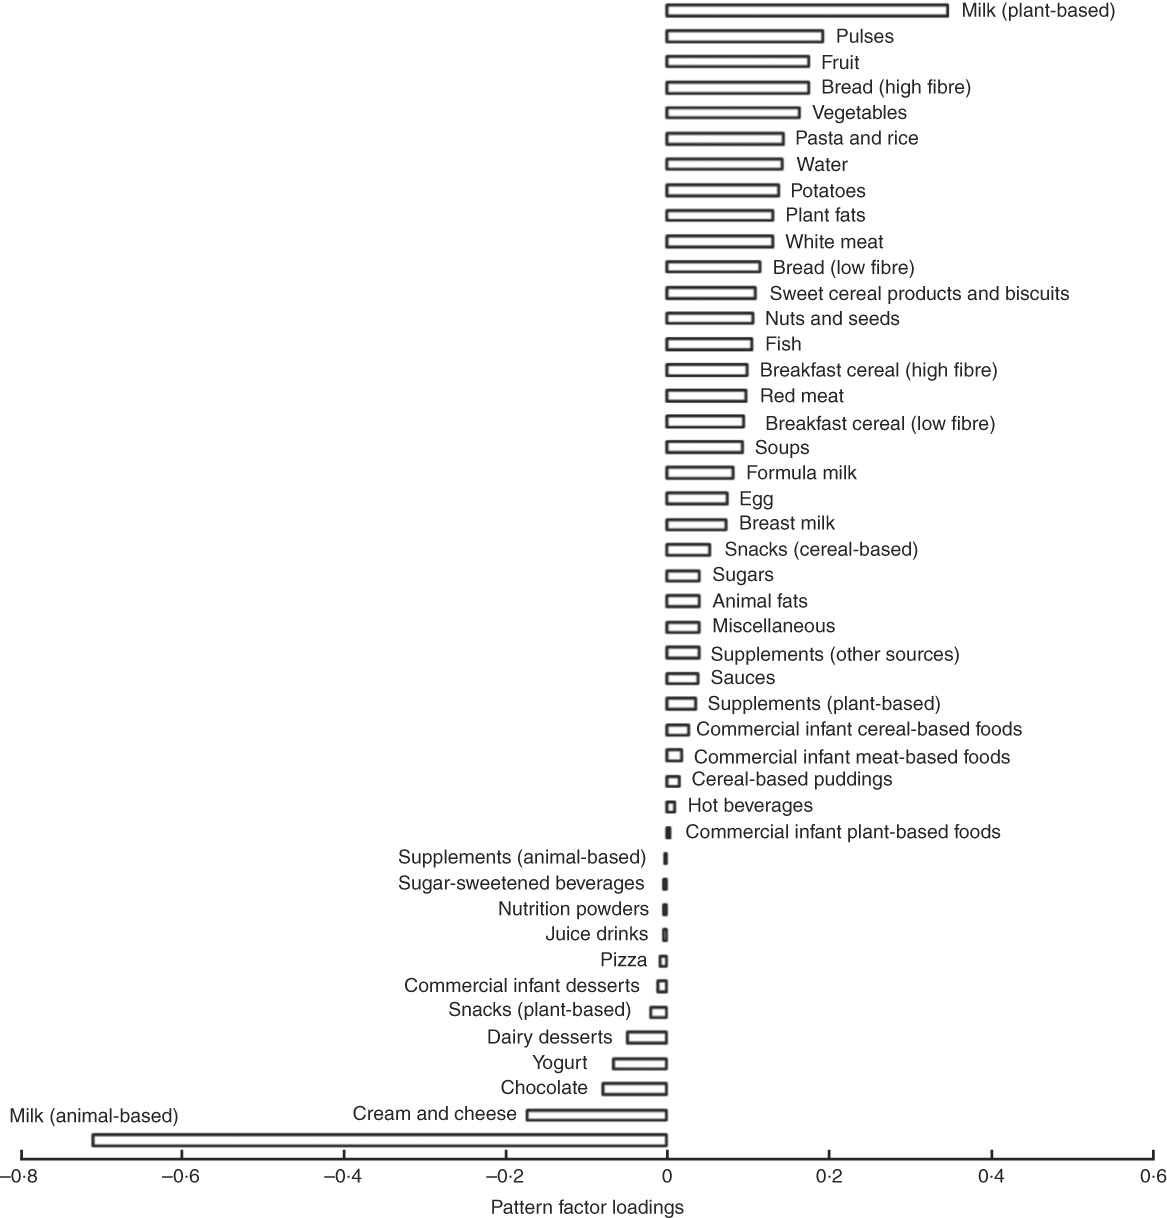
Fig. 2 Food group factor loadings for the ‘low dairy’ dietary pattern (characterisations of the food groups in supplementary data).
Table 4 Proportion of variation in intermediate variables explained by each dietary pattern extracted*
RRR, reduced rank regression; %E, proportion of total energy.
* Animal protein defined as protein derived from meat, chicken, fish and eggs, dairy protein defined as protein derived from milk, cheese and yogurt products.
† Variation of all three intermediate variables is not an additive process so is not a sum of the variation for each variable separately.
‡ Dietary pattern 1 represents high intake of plant-based milks (mostly soya milk), pulses, fruits and vegetables and high fibre bread and with a low reported intake of milk from dairy sources, dairy products and chocolate. As such it can be referred to as a ‘low dairy’ dietary pattern.
§ Dietary pattern 2 represents: high intakes of animal protein, from meat and fish, but very little intake of dairy protein.
|| Dietary pattern 3 represents: a mixed intake of all protein types, with no clearly discernible combination of foods consumed (only 7 % of total variable in source of %E protein explained by this pattern).
Association between ‘low-dairy, high-plant protein’ dietary pattern z-score and weight, BMI or odds of overweight/obesity
The ‘low-dairy, high-plant protein’ dietary pattern was negatively associated with weight up to 60 months (Table 2): a 1 sd higher z-score for this dietary pattern at 21 months of age was associated with 50 g lower weight (95 % CI 6, 107 g) at any age between 21 and 60 months. There was a significant association between z-score for this dietary pattern and lower odds of being overweight or obese at 36 months (OR 0·78; 95 % CI 0·63, 0·98) but not at 60 months, and some evidence of an association at any time point between 21 and 60 months (OR 0·84; 95 % CI 0·70, 1·00). Alternatively, a 1 sd unit lower z-score for this dietary pattern at 21 months, indicating a high dairy protein and low plant protein intake, would be associated with 1·22 (95 % CI 1·02, 1·37) greater odds of being overweight or obese at 36 months of age.
Discussion
This analysis shows that the association between total protein intake at 21 months of age and later weight gain is largely explained by dairy protein (especially milk), which showed the strongest and most consistent associations with weight (adjusted for height) and BMI, compared with other protein types.
We identified a low-dairy, high-plant protein dietary pattern prospectively associated with lower weight gain, BMI and lower risk of overweight and obesity. This pattern was strongly characterised by low intakes of animal milk (and to a lesser extent other dairy products) and high intakes of plant-based milks and a range of food groups representing plant and animal protein sources. The factor loading for animal-based milk was three times that of other food groups, which corroborates our finding that milk intake at this age explains a protein-based dietary pattern predictive of greater weight gain and increased obesity risk.
A low score for this low-dairy, high-plant protein dietary pattern (and subsequently increased risk of excess weight gain), could be achieved by a high consumption of animal-based milk (as indicated by the strongest factor loading) as well as high intakes of other dairy products, and a low consumption of fruits, vegetables, pulses, bread, potatoes, pasta, rice, breakfast cereals, white meat, fish and red meat. Such a dietary pattern at 21 months of age is indicative of a diet reflecting incomplete weaning, whereby milk remains an integral part of dietary intake, potentially substituting food-based meals or supplementing the energy intake in children who are already consuming other meals. Collectively, these results suggest that children who are consuming cows’ milk as their predominant source of protein at the expense of other sources of protein and food-based meals by 18–27 months of age, are at a greater risk of excess weight gain, while those with a diet characterised by lower intakes of milk are at lower risk of excess weight gain.
About 300 ml of milk (just over half a pint or 310 g) will provide 350 mg of Ca in a day required by children of 1–3 years of age from Britain( 28 ) and is below the threshold associated with a risk of Fe deficiency, as has been showed in children who consume a large amount of milk (>500 ml/d)( Reference Maguire, Lebovic and Kandasamy 29 ). The median intake for animal milk for children of this age in the Gemini sample was 375 (IQR 246–490) g, but children above the 75th centile for milk intake had intakes averaging 610 (sd 113) g/d, up to a maximum intake of 1091 g/d. Milk intakes between 490 and 1091 g/d would provide between 1347 and 3012 kJ/d (322 and 720 kcal/d), or 30–70 % of the average energy requirements in this population. Our findings are supported by other analyses of the Gemini dataset, which found that the cohort greatly exceeded the recommended levels of Ca, another marker of milk intake, with a mean intake of 842 (sd 4·8) mg representing 240 % of the recommended nutrient intake for children aged 1–3 years( Reference Syrad, Llewellyn and van Jaarsveld 5 ). Furthermore, an analysis by McDonald et al.( Reference McDonald, Wardle and Llewellyn 30 ) of sleep and night-time energy intake in the Gemini study highlighted that excess energy intake at night-time primarily came from milk. Milk was hypothesised to be provided by parents as an aid to encourage children to sleep through the night rather than for nutritive purposes. This offers one insight into how milk may be supplementing other food consumption. However, the factor loadings for meal-based foods in our dietary pattern also suggest that milk may be displacing energy from foods, as well as supplementing it.
Comparison with other studies
The Second Icelandic Infant Nutrition Study reported a significant relationship between animal protein intake, but not plant protein intake, and BMI at 6 years of age( Reference Thorisdottir, Gunnarsdottir and Palsson 2 ). There was no specific association for meat or dairy protein alone, although the sample size of 199 children in this study potentially limited the detection of effects from smaller subgroups of intake. Quintile analyses also revealed a difference between consumers in the top and bottom quartiles of animal protein in the Icelandic cohort. Similarly, the Generation R study of 2911 children found an association between dietary protein intake measured at 1 year (using a FFQ and BMI standard deviation score (SDS) and body fatness SDS measured at 6 years. However, this association was only significant for animal protein and not for vegetable protein (relative risk 0·06 BMI SDS) (95 % CI 0·01, 0·1) per 10 g animal protein intake per d. This study did not investigate the specific role of dairy protein, however, as animal protein included both dairy and non-dairy sources( Reference Voortman, Braun and Kiefte-de Jong 31 ).
To our knowledge, this is the first study to extract a dietary pattern based on different protein sources using RRR in a population of this age. The dietary pattern observed in this study is different from that of other studies of obesity in older children, which focus more strongly on fibre, energy density and fat intakes( Reference Ambrosini 32 ). It does not preclude the possibility that dietary patterns evolve as children age, perhaps shifting from a milk-protein dominated pattern to an energy-dense, low fibre pattern through childhood, but further research is required to study changing dietary patterns throughout childhood and adolescence.
Strengths and limitations
The largest contemporary dietary dataset for toddlers in the UK combined with repeated measures of weight makes this study well powered to detect small associations. The dietary pattern approach in this study corroborates the previous analysis of individual protein sources. Moreover, it provides important information about food sources of protein that is linked to greater or lower adiposity risk in young children and offers insights into which foods may be displacing others. We used RRR to derive dietary patterns that can be used to test specific hypothesis on pathways from diet to development of a disease. The effects of the whole diet in the form of dietary patterns can help improve the interpretation of the protein source analysis into evidence that can be more easily translated into food-based advice, for instance milk intake, which is the single most important food group contributing to protein intake in children of this age. However, the pattern observed in this study explained variations in protein type only, not other nutrients. Accordingly, it does not necessarily represent the most common dietary pattern in UK children of this age, but rather the pattern of foods that best explain animal, plant and dairy protein intakes in this cohort of young children.
Using dietary data collected at one time point is a limitation of this study, as it may not capture dietary variation. However, there is evidence that dietary patterns are determined early in life and track in both infancy( Reference Lioret, Betoko and Forhan 33 ) and older childhood( Reference Ambrosini, Emmett and Northstone 34 ). The average age at dietary intake for 21 months and the use of repeated measurement for anthropometrics mean that the window between exposure and outcome will vary across individuals in the cohort.
Misreporting of food consumption is a potential limitation to all self-reported dietary assessment methods, although younger ages are associated with lower rates of dietary under-reporting( Reference Lioret, Touvier and Balin 35 ). However, we have used dietary records, the ‘gold standard’ in self-reported dietary assessment, as shown by comparisons with doubly-labelled water to assess energy intakes( Reference Freedman, Commins and Moler 36 ). Furthermore, a recent biomarker study in 450 postmenopausal women found that an FFQ, a 4-d diet record, and three 24-h recalls each explained, respectively: 3·8, 7·8 and 2·8 % of biomarker variation for energy; 8·4, 22·6 and 16·2 % of biomarker variation for protein; and 6·5, 11·0 and 7·0 % of biomarker variation for protein density( Reference Prentice, Mossavar-Rahmani and Huang 37 ). There is potential for underestimating food wastage, resulting in over-reporting of actual consumption in this age group( Reference Lennox, Sommerville, Ong, Henderson and Allen 38 , Reference Forrestal 39 ). While the ‘gold standard’ procedure for diet diaries involves weighing intakes, a validation study by Lanigan et al.( Reference Lanigan, Wells and Lawson 40 ) using seventy-two children aged 6–24 months found no evidence that estimated food records are less accurate than weighed records for assessing energy and nutrient subclass intakes in this age group. The nutrient disaggregation method may also be source of possible errors due to data entry and misclassification, although automation of the process avoided this to some extent. Interestingly, this study’s intake estimates for animal, dairy and plant protein were similar to that described by Thorisdottir et al.( Reference Thorisdottir, Gunnarsdottir and Palsson 2 ). The analysis may be confounded by interactions with other nutrients which were not included. The Ca content of dairy products has been hypothesised to have a negative impact on body composition and growth, while fibre could play a role in the observed differences in effects seen between different types of protein. However, the analyses were adjusted for total energy intake and total fat intake to account for different composition of foods providing protein from different sources, as well as measurement error( Reference Willett, Howe and Kushi 41 ). Obesity rates at 60 months of age in this study were lower than the national average of 22 % in children aged 4–5 years in the 2012–2013 National Child Measurement Programme( 42 ). Results from the smaller Health Survey England 2012 found a 23–28 % prevalence of overweight and obesity in children aged 2–10 years between 2010 and 2012( 43 ). This may be due to the younger age of the Gemini children, compared with these national estimates, but also the smaller birth weight of twins. The over-representation of children from higher socio-economic status and white ethnicity families may also contribute to the slightly lower rates of overweight and obesity( Reference Pimpin, Jebb and Johnson 27 ). The 16 % of children in the Gemini sample who were classified as overweight or obese at any time point from time of diet diary to follow-up may be a more accurate representation of overweight and obesity status during the follow-up period, which greatly reduces sample size, and therefore may lead to further limitation. Indeed, the analysis of dietary intake on odds of obesity at 3 and 5 years is based on a much smaller sample size than longitudinal analyses, which can use repeated data from individuals measured several times, but at any time point in follow-up. With a decrease in sample size, particularly in analysing individuals with BMI data at 60 months, comes loss of power, which may go some way to explaining the stronger association with dairy and milk protein in younger ages (36 months).
Conclusion
Total protein intakes in this cohort of young UK children are high and are largely sourced from milk. Intake of higher dairy and milk protein is prospectively associated with greater weight gain and higher risk of overweight or obesity in this cohort. A more diverse dietary pattern with less emphasis on dairy protein, particularly animal-based milk, and greater intakes of plant and animal foods, appears to be associated with more appropriate weight gain. This analysis provides important information on food groups to target in intervention, education and recommendations to prevent excessive weight gain in early life. Future research must consider the quality and source of protein in addition to the absolute amount. Parents and carers may need more detailed advice about appropriate weaning practices to avoid over-reliance on milk and reduce the risk of excessive weight gain.
Acknowledgements
The authors would like to acknowledge the substantial intellectual contribution by Professor Jane Wardle who sadly passed away before publication.
Supported by a program grant from the UK Medical Research Council (U105960389 to SAJ) and MRC PhD studentship (L. P.). The Gemini study was supported by a programme grant from Cancer Research UK (C1418/A7974 to Jane Wardle). Diet diary coding was funded by consultancy fees from Danone Baby Nutrition (to Jane Wardle and L. J.). The funders had no role in study design, data collection and analysis, decision to publish or preparation of the manuscript. S. A. J. is supported by the National Institute for Health Research (NIHR) Collaboration for Leadership in Applied Health Research and Care Oxford at Oxford Health NHS Foundation Trust and the Oxford NIHR Biomedical Research Centre. The views expressed are those of the author(s) and not necessarily those of the NHS, the NIHR or the Department of Health and Social Care.
The authors’ responsibilities were as follows: L. P., S. A. J. and G. L. A. designed the research (developed and conceived of the study); Jane Wardle was principal investigator of the Gemini study with responsibility for data collection; C. L. coordinated the collection of demographic and anthropometric data; L. J. designed and coordinated the collection and coding of dietary data; L. P. undertook the food disaggregation, performed statistical analyses and drafted the manuscript; all authors advised on the analyses or interpretation of data and contributed to manuscript preparation.
Jane Wardle received grants from Cancer Research UK and from Danone Baby Nutrition during the conduct of the study. Jane Wardle and L. J. received institutional consultancy fees from Danone Baby Nutrition from 2009 to 2012. All other authors declared no conflict of interest.
Supplementary material
For supplementary material/s referred to in this article, please visit https://doi.org/10.1017/S0007114518002052


