


Introduction
Legionnaires’ disease (LD) is pneumonia caused by Legionella species that disproportionately affects elderly and immunocompromised persons and can be fatal [Reference Cunha, Burillo and Bouza1]. Transmission occurs primarily through inhalation of aerosolised droplets from a contaminated water source. Known sources include large building water systems, cooling towers, soil, hot tubs and residential potable water systems [Reference Cunha, Burillo and Bouza1]. LD outbreaks can result in substantial morbidity and mortality [Reference Garrison2].
Rapid detection of disease clusters is critical to prevention and control. Statistical cluster detection has been shown to successfully identify LD outbreaks quickly and accurately using both prospective and retrospective methods [Reference Rudbeck3–Reference Sansom5]. The New York City Department of Health and Mental Hygiene (NYC DOHMH) has performed daily analyses since 2014 using the prospective space-time permutation scan statistic available through a free software program called SaTScan to detect clusters in 35 reportable communicable diseases, including legionellosis [Reference Greene6]. Advantages of using this scan statistic method include that it does not impose any artificial boundaries on the spatial or temporal extent of a cluster, does not require population-at-risk data and accounts for multiple testing [Reference Kulldorff7]. This scan statistic method has also been applied effectively for surveillance for clusters of dead birds as an early warning of West Nile virus activity, hospital emergency department visits, ambulance dispatch calls, pharmacy sales, shigellosis and campylobacteriosis [Reference Kulldorff7–Reference Mostashari13].
Several outbreaks were first detected using the NYC DOHMH system, including in 2015 the second largest community-acquired LD outbreak in the USA, which was associated with 138 cases and 16 deaths [Reference Greene6, Reference Weiss14]. In this instance, the NYC DOHMH system automatically detected a significant cluster 3 days before NYC DOHMH staff independently noted an increase in LD cases and 4 days before hospital staff notified NYC DOHMH of an increase in LD among emergency department patients [Reference Greene6, Reference Weiss14]. A resource-intensive epidemiologic, environmental and laboratory investigation identified the source, a cooling tower on a hotel [Reference Weiss14]. The NYC DOHMH cluster detection system contributed to the timeliness of outbreak detection, investigation and mitigation and was useful for tracking the scope of the outbreak after initial detection, as additional cases were reported.
In the USA, only 4% of LD cases have been shown to be outbreak-associated [15]. Allegheny County, Pennsylvania, USA, with a population of 1.2 million people including the city of Pittsburgh and its surrounding suburbs [16], had an age-adjusted legionellosis rate of 4.4 per 100 000 in 2009 [17], which was fourfold higher than the national legionellosis rate [Reference Garrison2]. About 25% of cases diagnosed during 2013–2016 among Allegheny County residents were healthcare-associated; the remaining 75% of cases were classified as community-acquired sporadic (non-outbreak-associated). Allegheny County Health Department (ACHD) staff routinely conduct patient interviews to identify risk factors and then review collected data to assess common exposures among cases. However, detecting community-acquired clusters through human review of case investigation data relies on astute staff noticing unusual clustering in time and space and recognising links between cases, is time- and resource-intensive to conduct and can lag days to weeks behind an increase in reported cases. This issue can be exacerbated in densely populated urban areas with large numbers of background cases.
During 2003–2017, only one community-acquired LD outbreak, occurring in 2008, was identified in Allegheny County. Traditional patient interview-based surveillance methods have not identified common exposures among other community-acquired Allegheny County LD cases. Relying solely on human review and descriptive epidemiology to detect clusters could result in missing clusters, such that cases are assumed to be sporadic rather than investigated as potentially having a common source. More timely detection of LD cases clustered in space and time that might signify a cooling tower-associated outbreak would lead to faster outbreak investigation, source mitigation and disease prevention. The objective of this study was to determine the adaptability, utility and performance of NYC DOHMH's prospective cluster detection system using its particular SaTScan parameter settings to detect LD outbreaks of various sizes in Allegheny County, a smaller, less densely populated jurisdiction.
Methods
Data on legionellosis cases among Allegheny County residents reported by laboratories and healthcare providers during 2014–2016 were obtained through Pennsylvania's National Electronic Disease Surveillance System (PA-NEDSS). Legionellosis comprises two conditions caused by Legionella: LD and Pontiac fever, which is a milder febrile illness and therefore, less commonly diagnosed and reported. A confirmed case of legionellosis is defined by the Council of State and Territorial Epidemiologists as a clinically compatible illness confirmed by laboratory culture, urine antigen or antibody seroconversion [18]. Age-adjusted annual incidence was calculated using direct standardisation and weighting to the US 2000 standard population [Reference Klein and Schoenborn19]. Date of report and latitude and longitude coordinates of the centroid of the census tract of residence were used to represent the temporal and spatial aspects of each case.
Three simulated outbreaks were created based on data published on community-acquired LD outbreak investigations [Reference McCormick20–Reference Cohn22]. These outbreaks were selected because they represent three distinct LD community-acquired outbreak types that could potentially be detected by the space-time permutation scan statistic: (1) 50 cases presumed to be associated with a cooling tower occurring rapidly over 38 days, (2) 84 cooling tower-associated cases occurring at a moderate speed over 82 days and (3) 10 community potable water system-associated cases occurring slowly over 163 days. The outbreaks varied by environmental source, number of cases, duration, the growth of epidemic curve, the radius of the affected area and season (Table 1). The cases from each individual outbreak were inserted into Allegheny County baseline data based on a simulated report date to mimic the published epidemic curve. No published epidemic curve for simulated outbreak 3 was available [Reference Cohn22] and, therefore, we used information on the timing of cases available in the publication to simulate an epidemic curve.
Table 1. Legionnaires’ disease simulated outbreak characteristics based on published outbreak investigations
Each published outbreak used for a simulation included a point map of the spatial distribution of case residences. For each simulated outbreak, we mimicked the published outbreak spatial distribution by calculating the distribution of published outbreak cases within circular bands of increasing radius centred on the outbreak source (i.e. ‘outbreak radii’) and then assigning locations to simulated outbreak cases to achieve a similar distribution relative to the simulated outbreak area. The publication used as the basis for simulated outbreak 2 also included the spatial distribution of cases during two time periods. We used this information to further refine the case spatial distribution of simulated outbreak 2.
We analysed the simulated study data for Allegheny County, which included baseline or routine public health surveillance data spiked with simulated outbreak cases, using a SAS program created by NYC DOHMH [Reference Greene6] and modified for use by ACHD. The original NYC DOHMH SAS program was easily modified by an ACHD epidemiologist with intermediate SAS skills. Minor modifications included editing portions of the original code to conform to PA-NEDSS-specific nuances, removing code related to secondary addresses and editing code referencing NYC-specific geographic resolutions [Reference Greene6].
The space-time permutation scan statistic evaluates potential clusters as space-time cylinders, with the circular base representing space and the height representing time, encompassing all possible clusters within the spatial and temporal limits defined in the analysis parameter settings. A likelihood ratio-based test statistic is calculated for each cylinder as a function of observed and expected case counts, inside and outside the cylinder. The cluster with the maximum test statistic is identified. A large number of random replications of the input dataset are generated under the null hypothesis that the same process generated disease counts inside and outside the cylinder [Reference Kulldorff7]. The P-value for the cluster with the maximum test statistic is obtained through Monte Carlo hypothesis testing, by comparing the rank of the maximum likelihood from the real case dataset with the maximum likelihoods from the randomly generated datasets. A recurrence interval (RI) is calculated as the reciprocal of the P-value [Reference Kulldorff23]. If analyses are conducted daily, the RI represents the number of days of analyses required for the expected number of clusters at least as unlikely as the observed cluster to be equal to 1 by chance alone [Reference Kleinman24].
The NYC DOHMH standard maximum spatial cluster size of 50% of all cases reported during the study period was used for this analysis. The SaTScan method also requires selection of a maximum temporal cluster size, which should be short (e.g. 30 days) to have optimal power to detect a rapidly growing outbreak like simulated outbreak 1, or long (e.g. 180 days) to be able to detect a slowly growing outbreak like simulated outbreak 3 [Reference Greene6]. The epidemic curve for simulated outbreak 2 was neither clearly rapidly nor slowly growing, so we did not know a priori which maximum temporal window would be preferable. Therefore, we analysed simulated outbreak 2 using both 30- and 180-day maximum temporal windows to determine which performed better. For maximum temporal cluster sizes of 30 and 180 days, we used 365 and 730 days of historical baseline data, respectively.
We assessed 2014–2016 Allegheny County legionellosis case reports for previously unidentified clusters through a retrospective analysis using the space-time permutation scan statistic in SaTScan. These years were analysed given they represented the full range of possible baseline data used for prospective analyses (e.g. when analysing a period ending on 1 January 2016 using a maximum temporal cluster size of 180 days, the case file for analysis would include cases for a 730-day period starting 2 January 2014). We spiked the 2016 baseline data with cases for each of the three simulated LD outbreaks. Analyses for each of the three outbreaks were performed separately. We mimicked daily prospective analyses for the entire year of 2016 and defined signals using three RI thresholds: 20 days (a low threshold that is sometimes nevertheless used as it corresponds to P < 0.05, failing to account for repeated analyses performed daily instead of once), 100 days (the threshold used by NYC DOHMH for reportable diseases [Reference Greene6]) and 365 days (a threshold sometimes used for less specific data streams, e.g. syndromic surveillance data [Reference Wahnich25, Reference Kulldorff and Kleinman26]). Analysis days were restricted to days in which a baseline or simulated case was reported, as only these days had the potential to yield informative signals. Analysis days with at least one cluster exceeding the RI threshold were classified as positive, while analysis days with no clusters exceeding the RI threshold were classified as negative. A true positive required ⩾3 simulated cases included in the cluster detected. A false positive required <3 simulated cases included in the cluster detected. A true negative required <3 simulated cases reported in the maximum temporal window OR zero simulated cases reported that day. A false negative required ⩾3 simulated cases reported in maximum temporal window AND ⩾1 simulated case reported that day.
These daily analysis classifications were used to calculate the validity statistics of sensitivity, specificity, positive predictive value (PPV) and negative predictive value (NPV) at the three RI signalling thresholds for each simulated outbreak. Sensitivity was defined as the proportion of true positive daily analyses amongst all daily analyses that met cluster signalling criteria. Specificity was defined as the proportion of true negative daily analyses amongst all daily analyses that did not meet cluster signalling criteria. PPV was defined as the proportion of true positive daily analyses amongst all signalled daily analyses. NPV was defined as the proportion of the true negative daily analyses amongst all non-signaled daily analyses. Time to outbreak detection was calculated for each simulated outbreak by subtracting the earliest outbreak detection date from the report date of the third simulated outbreak-associated case, assuming a common source, community-acquired outbreak reasonably could not be recognised nor a source identified with fewer than three reported cases. All analyses were performed using SAS (v.9.4) and SaTScan (v.9.4.4).
Results
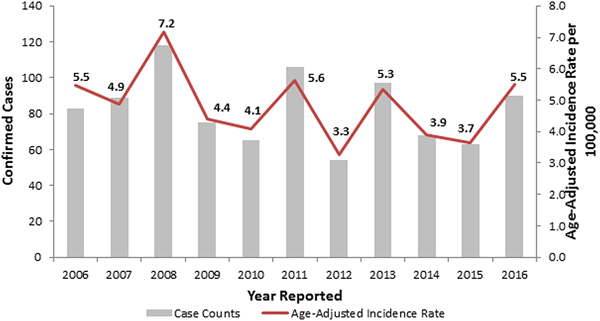
During 2006–2016, the observed number of legionellosis cases reported per year in Allegheny County ranged between 54 and 118, and 90 cases were reported in 2016 (Fig. 1). When retrospectively analyzing these 2014–2016 Allegheny County legionellosis surveillance data, no clusters were detected.
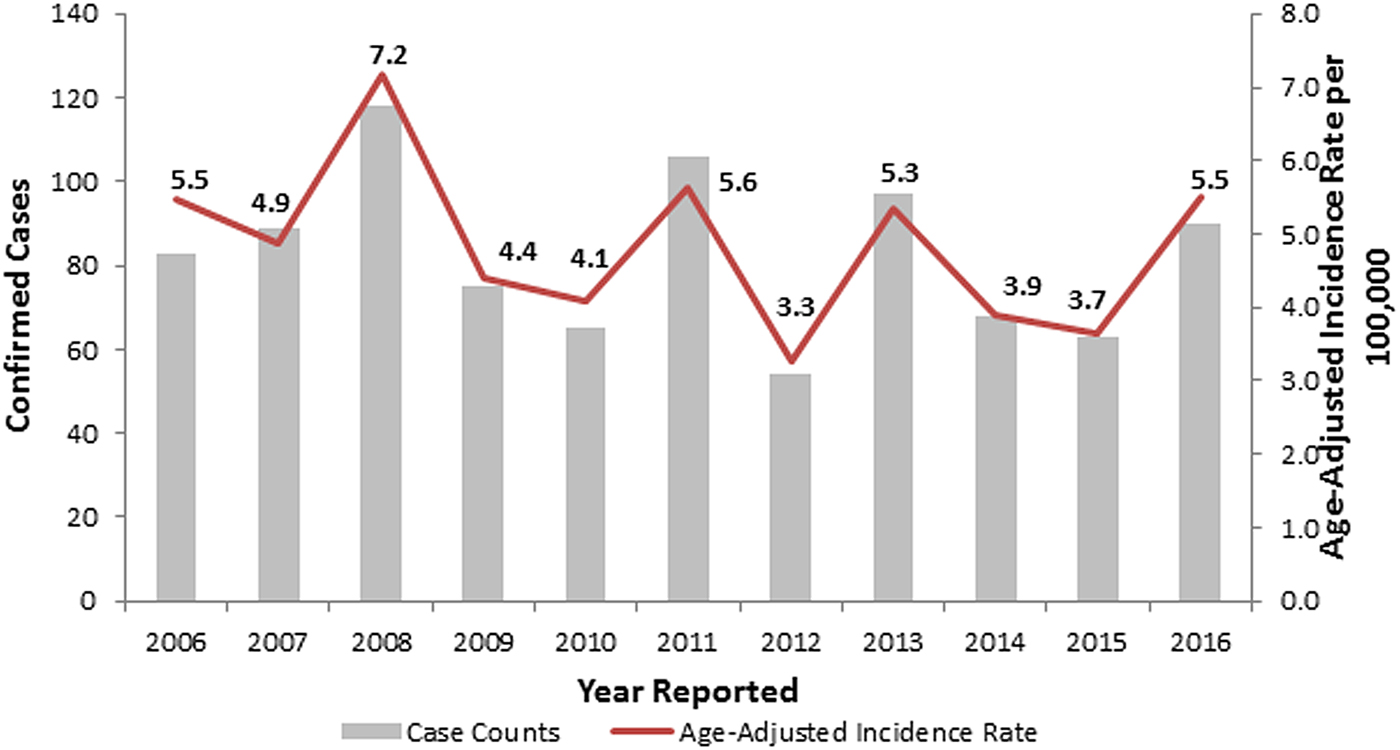
Fig. 1. Confirmed legionellosis cases and age-adjusted legionellosis incidence rates, Allegheny County, Pennsylvania, USA, 2006–2016.
A total of 144 outbreak cases were added as part of three separate outbreak simulations (Figs. 2–5). The time-to-detection using a RI ⩾ 100-day threshold was 5 days for outbreak 1 and 38 days using a 30-day maximum temporal window for outbreak 2; outbreak 3 was not detected (Table 2). Time-to-detection was shortened by using a lower RI threshold. Using a RI ⩾ 100-day threshold, time-to-detection was shortened to 33 days for outbreak 2 when a 180-day maximum temporal window and longer baseline period were used (Table 2). The maximum recurrence interval observed for outbreak 1 was over 3000 years using a 30-day maximum temporal window (Table 3). The maximum recurrence interval observed for outbreak 2 was higher when using a 180-day compared with a 30-day maximum temporal window (Table 3).
Fig. 2. (a–c) Observed baseline and simulated outbreak-associated legionellosis cases, Allegheny County, Pennsylvania, USA, 2016.

Fig. 3. Simulated outbreak 1-associated Legionnaires’ disease cases, simulated outbreak radii and legionellosis cases by census tract, 2014–2016, Allegheny County, Pennsylvania, USA.
Fig. 4. Simulated outbreak 2-associated Legionnaires’ disease cases, simulated outbreak radii and legionellosis cases by census tract, 2014–2016, Allegheny County, Pennsylvania, USA.
Fig. 5. Simulated outbreak 3-associated Legionnaires’ disease cases, simulated outbreak radii and legionellosis cases by census tract, 2014–2016, Allegheny County, Pennsylvania, USA.
Table 2. Time-to-detection, defined as days from third outbreak-associated case report to first signal exceeding recurrence interval (RI) threshold, for three simulated Legionnaires’ disease outbreaks, Allegheny County, 2016
a A maximum temporal window was chosen for each simulated outbreak based on the temporal span of the outbreak. The n/a designation was listed when a maximum temporal window was not used for analysis of a particular outbreak. Outbreak 2 did not clearly fit an appropriate maximum temporal window, thus both 30-day and 180-day were used.
Table 3. Maximum recurrence interval (days) observed for a cluster of greater than three simulated cases
Signals identified spatial and temporal extents of clusters of excess disease activity but did not attribute individual cases within clusters as outbreak-related vs. background. The maximum number of background cases included in any identified cluster was two, with total numbers of observed cases (i.e. simulated outbreak cases plus background cases within such clusters) ranging from 17 to 38 cases.
Using a 30-day maximum temporal window and an RI signaling threshold ⩾20 days or ⩾100 days, all validity statistics for simulated outbreak 1 daily analyses were ⩾90%; thus, few false negative and false positive days were produced (Table 4). Using a 30-day maximum temporal window, the sensitivity of outbreak 2 detection was low using a RI ⩾ 20 days threshold and very low using a RI ⩾ 100 day threshold, whereas all other validity statistics were ⩾64% (Table 5). When using a 180-day maximum temporal window and any RI signalling threshold, the sensitivity of outbreak 2 daily analyses was ⩾43%. The other validity statistics were ⩾76% (Table 5). Using a 180-day maximum temporal window and any RI signalling threshold, outbreak 3 was not detected, so sensitivity was 0%. The specificity was ⩾97% (Table 6).
Table 4. Simulated outbreak 1 daily analyses validity statistics (n = 105 days with any reported cases in 2016)
Table 5. Simulated outbreak 2 daily analyses validity statistics (n = 125 days with any reported cases in 2016)
Table 6. Simulated outbreak 3 daily analyses validity statistics (n = 94 days with any reported cases in 2016)
Discussion
We demonstrated that the space-time permutation scan statistic in SaTScan as applied in the NYC DOHMH cluster detection system identified two larger simulated outbreaks of varying intensity and duration and failed to detect one smaller, slowly growing simulated outbreak in Allegheny County. Outbreak 1 was detected within a few days and outbreak 2, which was slower growing, was detected within a few weeks. The validity statistics of the second simulation were higher when using the 180-day maximum temporal window and 2-year baseline period compared with the 30-day maximum temporal window and 1-year baseline. This observation supports using both the 30-day and 180-day maximum temporal windows for prospective cluster detection since it is unknown in advance whether any given outbreak will be rapidly or slowly growing, although this method does not account for the multiple testing of the same temporal windows up to 30 days in each analysis. Both simulated outbreaks 1 and 2 were based on cooling tower-associated outbreaks, which can be difficult to quickly detect through human review alone.
Simulated outbreak 3 was not detected, as it occurred over a longer period and included few excess cases. Illustrating the type of outbreak, the system is not optimised to detect and highlight the continued importance of astute public health investigators to complement automated detection methods. Through traditional human review of case data, the New Jersey Department of Health detected the outbreak that simulated outbreak 3 after cases occurred in nearby senior apartment buildings. In addition, non-statistical analyses can identify multiple cases within a defined period sharing a common potable water source or building water system; for example, NYC DOHMH runs automated analyses to detect ⩾2 Legionnaires’ disease patients with the same address within a year [Reference Levin-Rector27].
Health departments should consider using the prospective space-time permutation scan statistic in SaTScan for routine reportable disease cluster detection, as, in particular, this might help to detect cooling tower-associated LD outbreaks. In practice, the signalling threshold of RI ⩾ 100 days balanced optimising sensitivity (which favours a low RI threshold) and PPV (which favours a high RI threshold). Each outbreak was detected more quickly using an RI threshold of 20 days; however, with the lower PPV associated with this threshold, more false positives were produced that could overextend limited public health resources. This method could also corroborate spatiotemporal trends observed by public health investigators and provide additional evidence to support the need for further investigation. Detecting a significant cluster, using this method should prompt an investigation of a potential source including enhanced patient interviews and environmental sampling. Cooling tower registries, such as the one established in NYC in 2015, can be useful for identifying cooling towers for sampling, especially in dense urban environments where cooling towers are not necessarily visible from the street [Reference Bassett and Balter28, Reference Fitzhenry29]. Given the circular shape of the scanning window, the space-time permutation scan statistic most successfully detects circular and highly focal outbreaks, such as some LD cooling tower-associated outbreaks. Nevertheless, non-circular shaped outbreaks have been successfully detected by this method [Reference Kulldorff12].
Our assessment has several limitations. First, the PA-NEDSS case report date was the only date used in our simulations mimicking published epidemic curves. Using onset or diagnosis date would have been a better proxy of when the exposure occurred but would have required strong assumptions regarding reporting lags. In practice, report dates can be delayed because of batched electronic laboratory reporting and might have a temporal pattern appreciably different from the date of exposure, which could impact the results of outbreak detection analyses.
Second, the residential address was the only address simulated for each case. NYC DOHMH also performs LD cluster detection using all available address information, including work addresses, which improves sensitivity for detecting clusters where a patient's exposure occurred in a location other than the home [Reference Peterson and Greene30]. PA-NEDSS does not systematically include data on work address; thus, this analysis reflects a current limitation of PA-NEDSS. However, the home address is often a good approximation of where individuals might have been exposed to Legionella and each publication used to simulate outbreaks described case spatial distributions based solely on residential address.
Third, daily analyses were simulated only over 1 year. Results might vary if repeated over several years, given fluctuation in baseline Allegheny County legionellosis case counts, or if repeated by inserting simulated outbreak cases into different parts of Allegheny County with different baseline counts. Only three simulated outbreaks were generated for this analysis, selected to represent three distinct types of community-acquired LD outbreaks. Many simulations of one outbreak type could have been generated with parameter specifications; however, we chose to simulate one outbreak of each type as accurately as possible based on published information including spatial distributions and epidemic curves. Information about the epidemic curve of outbreak 3 was limited and whether our simulation accurately reproduced the outbreak is unknown.
The method used to simulate the spatial distribution of each outbreak has limitations. The outbreaks used for simulation occurred outside of Allegheny County in jurisdictions that differ from Allegheny County in many ways. Creation of these simulations required making assumptions about the spatial distribution of cases that in actuality might take a different form because of differences in Allegheny County population density and distribution, differences in terrain and wind patterns. Also, we did not take into account area-based poverty when considering the spatial distribution of simulated cases. Increased legionellosis rates have been shown to be associated with increased area-based poverty [Reference Greene31–Reference Farnham33]. This might have affected our ability to detect increases in case counts relative to baseline legionellosis. If our simulated case clusters were embedded in areas of high poverty, these clusters might have been more difficult to detect given potentially higher baseline legionellosis burden in these areas.
Finally, these findings might not be fully generalisable to jurisdictions with low legionellosis incidence. A small, slowly growing potable water outbreak was not detected in our simulations, but might be easier to detect in other jurisdictions with lower baseline case counts. Similarly, inserting the same simulated cooling tower-associated outbreaks into data from jurisdictions with a lower count of background sporadic cases might result in shorter time-to-detection, higher RIs and improved validity statistics.
Conclusion
This cluster detection system was easily adapted for use in Allegheny County and quickly detected simulated cooling tower-associated outbreaks that otherwise might have required more time to detect by surveillance methods that rely on the human review of descriptive epidemiology. Health departments should consider adopting this system for improved community-acquired LD outbreak detection and potential disease prevention. In September 2017, Allegheny County began using this system for weekly prospective LD cluster detection.
Acknowledgements
SaTScan is a trademark of Martin Kulldorff. The SaTScan software was developed under the joint auspices of Martin Kulldorff, the National Cancer Institute and Farzad Mostashari of the New York City Department of Health and Mental Hygiene.


 Open access