


Introduction
Morphological change has long been the currency of studying evolutionary trends in the fossil record. A good deal of this change is likely brought about by some combination of changes in growth rate and/or life span (i.e., heterochrony), but for too long these data have been missing from paleobiology. Sclerochronology, the study of periodic features archived in skeletal portions of animals that grow by accretion, provides a tool with which to collect these data and offers the potential to dramatically expand our understanding of the evolution of life. For many organisms, the annual cycle of environmental variation is recorded in thickness patterns and/or geochemical variations in the growth increments of skeletal structures, providing a chronometer that allows for the calibration of life histories in time (e.g., Jones and Quitmyer Reference Jones and Quitmyer1996; Ivany Reference Ivany2012; Schöne and Surge Reference Schöne and Surge2012). These so called “paleontological clocks” (Pannella and MacClintock Reference Pannella and MacClintock1968) allow us to determine the age-at-size relationships crucial to a deeper understanding of morphologic change through ontogeny and within phylogenies.
Sclerochronology is not new, nor is it completely unknown to paleobiologists. The oft-cited story of Leonardo da Vinci using external growth lines on bivalve shells to argue that the so-called figur'd stones found in the Italian mountains were in fact the remains of ancient, once-living, marine organisms and did not belong in the mineral class may very well be one of the earliest examples of sclerochronology (Jones and Gould Reference Jones and Gould1999). Unfortunately, it took almost five centuries for paleobiologists to pick up on the idea of using hard parts to tell time (though fisheries biologists started decades earlier; see, e.g., Belding Reference Belding1910; Orton Reference Orton1923; Weymouth Reference Weymouth1923; Chamberlin Reference Chamberlin1931, Reference Chamberlin1933), and when they did, it was often applied to questions of geochronometry to refine constraints on astronomical cycles of the Phanerozoic (e.g., Wells Reference Wells1963). But this appears to have largely been where the union of sclerochronology and paleobiology stopped. Even with the surge of studies on heterochrony in the 1970s (e.g., Gould Reference Gould1977; Alberch et al. Reference Alberch, Gould, Oster and Wake1979) calling for constraints on life span and growth rate—the very data sclerochronology can provide—the two fields remained disjointed. Jones and Gould (Reference Jones and Gould1999) showed the way forward when they used age-calibrated life histories to reveal the nuanced mechanisms of heterochrony in the oyster Gryphaea spp. from the Jurassic of the United Kingdom. Yet, despite some notable exceptions (e.g., Goodwin et al. Reference Goodwin, Anderson and Roopnarine2008; Geary et al. Reference Geary, Hoffmann, Magyar, Freiheit and Padilla2012; Collins et al. Reference Collins, Crampton, Neil, Euan, Gazley, Collins, Crampton, Neil, Smith and Gazley2016), the tools of sclerochronology never quite gained wide usage in the paleobiological realm.
More recently, questions of how metabolic rate might contribute to Phanerozoic trends in ecology and bioenergetics (Vermeij Reference Vermeij1987; Bambach Reference Bambach1993; Finnegan et al. Reference Finnegan, McClain, Kosnik and Payne2011; Clapham Reference Clapham2017) and body size (Finnegan et al. Reference Finnegan, McClain, Kosnik and Payne2011; Heim et al. Reference Heim, Knope, Schaal, Wang and Payne2015; Pyenson and Vermeij Reference Pyenson and Vermeij2016), perhaps as related to oxygen (Payne et al. Reference Payne, McClain, Boyer, Brown, Finnegan, Kowalewski, Krause, Lyons, McShea, Novack-Gottshall, Smith, Spaeth, Stempien and Wang2011; Vermeij Reference Vermeij2016), again showcase the value of information about growth rate and life span for fossil taxa. Frustratingly though, the connection between evolutionary and ecological processes and the tools that sclerochronology offers has yet to be fully realized. The result is that sclerochronology is often thought of as little more than a “handmaid” to the fields of geochronometry and paleoenvironmental reconstruction, just as paleontology was famously relegated in reference to the field of stratigraphy (though at the time, this was a compliment; e.g., Lapworth and Wilson Reference Lapworth and Wilson1871). Norman Newell opined that paleontology is far more than this, and in fact has much more to offer to evolutionary biologists than to geologists (quoted in Sepkoski Reference Sepkoski2012). So too do we here argue that sclerochronology has far more to offer than the admittedly useful, but perhaps theoretically uninspiring, service to fields that require such information for other reasons.
Insights provided by growth rate and life span can and will enrich the ways we look at the organisms and assemblages that make up the fossil record and give them new and different stories to tell. The fossil record is full of animals with skeletons that grow by accretion (e.g., mollusks, brachiopods, corals, vertebrates, and more). From our perspective though, fossil bivalves offer one of the most promising and intriguing paths forward. Bivalve growth increments are often visible even in the oldest of fossils (e.g., Runnegar Reference Runnegar1974; Yancey and Ozaki Reference Yancey and Ozaki1986; Nützel et al. Reference Nützel, Joachimski and Correa2010), and in some cases preservation is even sufficient to retain original shell chemistry (Brand Reference Brand1982; Seuß et al. Reference Seuß, Nützel, Mapes and Yancey2009; Ivany and Runnegar Reference Ivany and Runnegar2010; Beard et al. Reference Beard, Ivany and Runnegar2015; Jimenez et al. Reference Jimenez, Ivany, Judd and Henkes2019). Given that bivalves also exhibit an extreme range in life histories—from a matter of months (e.g., Donax variabilis; Jones et al. Reference Jones, Quitmyer and Andrus2005) to more than 500 years (e.g., Arctica islandica; Butler et al. Reference Butler, Wanamaker, Scourse, Richardson and Reynolds2013)—they offer tremendous potential for novel insight. In this paper, we review the types of information and methodological approaches most relevant to paleobiological questions, articulate the value of sclerochronology to studies of evolution, and propose some exciting avenues of investigation explicitly related to the role of life histories in macroevolution and evolutionary ecology. Though we largely illustrate possibilities through the lens of bivalve life histories, all organisms with accretionary structures offer similar potential.
Growth Increments, Time, and the “Right Kind” of Data
Visual and chemical patterns accrued in accretionary skeletal hard parts give rise to the potential for a chronometer if growth can be calibrated to time. In bivalves, indicators of growth include commissure-parallel lines on the shell surface and dark/translucent bands in cross section, both produced by changes in growth rate that change the proportion of organic matrix compounds (Lutz and Rhoads Reference Lutz and Rhoads1977) and/or the texture and regularity of crystal microstructure (Ropes et al. Reference Ropes, Jones S, Murawski and Jearld1984) in the shell (Fig. 1). Shell growth bands and the increments they define (e.g., Jones Reference Jones1980) are visible in both reflected and transmitted light and can be made more apparent with treatments such as acid etching (Ropes Reference Ropes1984) and staining with Mutvei's solution (Mutvei Reference Mutvei1979; Schöne et al. Reference Schöne, Dunca, Fiebig and Pfeiffer2005a).
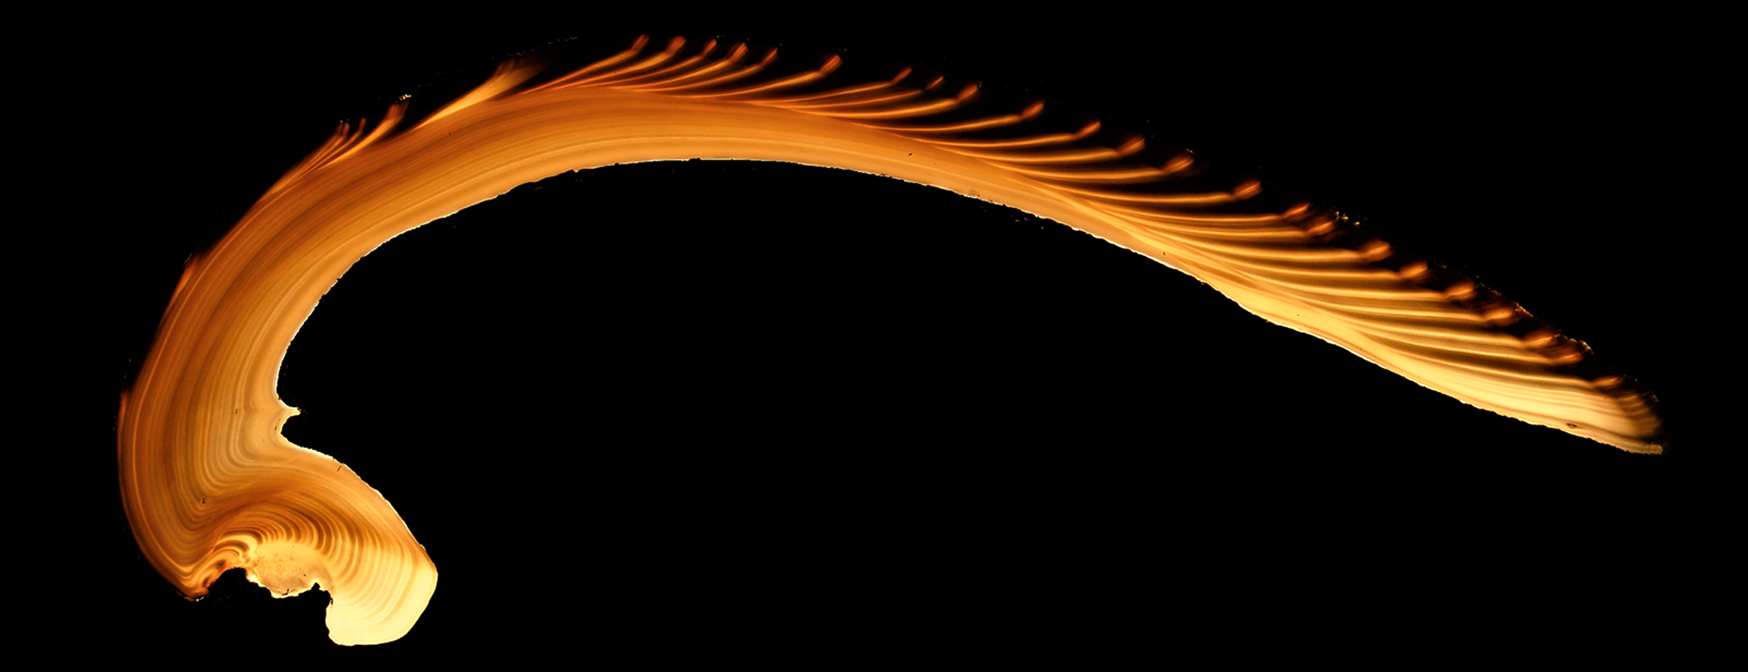
Figure 1. Backlit thin section of Mercenaria campechiensis (UF Z12524, University of Florida Museum of Natural History). Shell height 137.08 mm; collected from Cedar Key, Florida, USA. Annual growth increments (translucent/bright in this view) are visible in hinge area and all shell layers.
Variation in the rate of accretion that produces bands and lines is driven by some combination of environmental, ecological, and physiological factors (Lutz and Rhoads Reference Lutz, Rhoads, Rhoads and Lutz1980). Distinguishing the markers of annual growth, which allow for age determination, from the myriad of other potential lines indicating growth slowdowns or cessations on a range of timescales, both periodic and not (Pannella and MacClintock Reference Pannella and MacClintock1968; Clark Reference Clark1974), is crucial to how sclerochronology can be applied to evolutionary questions related to growth and life span. Disturbance lines reflecting growth interruptions induced by storms, predation attempts, or abnormal environmental conditions (Clark Reference Clark1974) can complicate the recognition of patterns with temporal significance, but these can often be distinguished from periodic lines by abrupt changes in microincrement widths that would otherwise decrease uniformly in advance of true annual increments (Schöne and Surge Reference Schöne and Surge2012). Periodic lines in shells have been demonstrated to reflect at least five different frequencies: tidal, daily, fortnightly, monthly, and annual (e.g., Clark Reference Clark1974; Pannella Reference Pannella1976; Richardson et al. Reference Richardson, Crisp, Runham and Gruffydd1980; Goodwin et al. Reference Goodwin, Flessa, Schöne and Dettman2001; Schöne et al. Reference Schöne, Lega, Flessa, Goodwin and Dettman2002, Reference Schöne, Houk, Freyre Castro, Fiebig, Oschmann, Kroncke, Dreyer and Gosselck2005b; Hallmann et al. Reference Hallmann, Schöne, Strom and Fiebig2008). Scales of environmental variation in the habitat determine which suite of periodic bands a shell will record. Some of these can be quite subtle and surprising (e.g., even deep-sea chemosymbiotic bivalves show tidal growth banding; Schöne and Giere Reference Schöne and Giere2005; Nedoncelle et al. Reference Nedoncelle, Lartaud, Contreira Pereira, Yücel, Thurnherr, Mullineaux and Le Bris2015). Annual growth bands, most useful for age determination, are found in almost all modern bivalves outside the tropics and typically form in response to seasonal extremes in temperature (Jones and Quitmyer Reference Jones and Quitmyer1996), salinity (Richardson Reference Richardson2001), or food availability (Schöne et al. Reference Schöne, Houk, Freyre Castro, Fiebig, Oschmann, Kroncke, Dreyer and Gosselck2005b; Ballesta-Artero et al. Reference Ballesta-Artero, Witbaard, Carroll and van der Meer2017) and/or during spawning (Jones et al. Reference Jones, Williams and Arthur1983; Sato Reference Sato1995). Winter growth cessations are common for species living above 25° N or S latitude, summer cessations tend to predominate between 15° and 30° N or S latitude, and some species within 15° of the equator record no cessations at all (Killam and Clapham Reference Killam and Clapham2018). Species that span a wide range of latitudes can form annual growth lines at different times of the year in different parts of their range. For example, Mercenaria mercenaria in the southern extent of its range forms lines in the summer, while in the north, annual lines reflect winter growth cessations (Jones et al. Reference Jones, Arthur and Allard1989; Quitmyer et al. Reference Quitmyer, Jones and Arnold1997; Elliot et al. Reference Elliot, DeMenocal, Linsley and Howe2003).
Without independent temporal calibration, the assumption that growth bands are annual is not always a safe one (Jones Reference Jones1981)—in some cases (e.g., many oysters; Surge et al. Reference Surge, Lohmann and Dettman2001; Tynan et al. Reference Tynan, Dutton, Eggins and Opdyke2014), visible growth increments bear no clear relation to intra-annual environmental variation. Geochemical variation along the axis of growth, however, often provides a means by which to confirm the timing of visible growth bands and reveal the annual cycle, thereby allowing calculation of growth rates and/or determination of ontogenetic age. Stable oxygen isotope values of shell carbonate are temperature dependent (Urey et al. Reference Urey, Lowenstam, Epstein and McKinney1951; Epstein et al. Reference Epstein, Buchsbaum, Lowenstam and Urey1953; Grossman and Ku Reference Grossman and Ku1986) and therefore can track the seasonal temperature cycle experienced during an individual's lifetime, providing the chronometer for growth (Williams et al. Reference Williams, Arthur, Jones and Healy-Williams1982; Jones and Quitmyer Reference Jones and Quitmyer1996; Ivany Reference Ivany2012). Elemental ratios can also be useful for delimiting years, though the specific relationship to environment is often complicated by growth rate or other so-called vital effects (e.g., Gillikin et al. Reference Gillikin, Lorrain, Navez, Taylor, Andre, Keppens, Baeyens and Dehairs2005; Poulain et al. Reference Poulain, Gillikin, Thébault, Munaron, Bohn, Robert, Paulet and Lorrain2015). A number of caveats exist regarding the use of ancient skeletal carbonate for paleotemperature determination, such as understanding the δ18O value of ancient seawater and confirmation of preservation of originial skeletal material (reviewed in Grossman Reference Grossman2012); nonetheless, this approach has been widely successful and broadly applied to questions of paleoclimate and seasonal variation. Some of these caveats are relaxed when the goal is simply the recognition of annual cycles rather than precise paleotemperature reconstructions, making stable isotope sclerochronology especially applicable to questions of life span, growth rate, and body size as distributed in time or space. Indeed, many of the studies referenced in this piece employ this approach to calibrating time in accretionary records.
Quantifying Growth and Life Span
Bivalves grow by accretion and have indeterminate growth. Counts and widths of annual growth increments provide an opportunity to collect quantitative, rather than qualitative, data on growth rates of ancient organisms over their lifetimes that can then be applied to evolutionary questions. A potential limitation to this kind of work is the need to section shells in order to reveal internal growth increments, which is not always possible in museum collections housing specimens from remote or no longer available localities. Making new collections expressly for this purpose obviates the problem, though in some cases this will not be possible. As a work-around, once the size–age relationship is known from a few individuals, sizes of intact shells can be measured along that same axis (be it the axis of maximum growth or some other dimension consistently repeatable among individuals) to produce rough estimates of ontogenetic age for large numbers of individuals. Note, however, that this approach is not without complication (see “Investigating Life Span”).
Promises and Pitfalls of the von Bertalanffy Growth Equation
A number of equations have been used to describe bivalve shell growth, including various logarithmic and logistic equations (e.g., Jones et al. Reference Jones, Arthur and Allard1989; Sato Reference Sato1994), but the von Bertalanffy growth equation (VBG; von Bertalanffy Reference Bertalanffy1938) is the one most commonly applied to bivalves. The VBG fit to measurements of cumulative growth increment width from umbo to commissure yields statistically robust age–size relationships:
 $$L_t = L_\infty \lpar {1-e^{{-}k\lpar {t-t_0} \rpar }} \rpar $$
where L t is the length at some time, L ∞ is the asymptotic height of the individual, k is the rate at which L ∞ is approached, and t 0 is the time at which L t = 0. This relationship states that the shell increases in size by adding successive annual increments that exponentially decrease in thickness with age, as measured perpendicular to the growth axis. Commercial fisheries have long used the VBG to approximate age–size relationships (e.g., Murawski et al. Reference Murawski, Ropes and Serchuk1982). These relationships can then be used to establish age–length keys (ALKs) (Harding Reference Harding2007; Pace et al. Reference Pace, Powell, Mann, Long and Klinck2017) that, along with information on sexual maturity, are useful in properly maintaining sustainable population stock levels (Thorarinsdóttir and Jacobson Reference Thorarinsdóttir and Jacobson2005). ALKs are perhaps best suited for shorter-lived taxa, though, as the significant variation in age-at-size for most long-lived taxa creates much uncertainty in age assignment.
Though the VBG is the most common approach, it is not without limitation. First, L ∞ can be thought of as the “maximum” size when the VBG is fit to data from a single individual. However, L ∞ from an individual or group of individuals should not be used to estimate or predict the maximum body size for the taxon. When fitting age–size data from a population, the best-fit growth model will yield as many shells whose sizes fall above L ∞ as shells that fall below it, because the best-fit line minimizes differences in expected and predicted values. While the mean VBG line might give a general description of growth for the taxon, it creates an issue when trying to predict the age of individuals from their sizes using the equation. To illustrate, the VBG equation can be solved algebraically for age:
 $$t = t_0-\displaystyle{1 \over k}\,\ast\, {\rm ln}\lpar 1-\left({\displaystyle{L \over {L_\infty }}} \right)$$
When L > L ∞ the operation calls for taking the natural log of a negative number, which is mathematically invalid. Individuals larger than L ∞ cannot be aged. This then calls into question the accuracy of ages determined for all other individuals using that equation. The VBG equation can therefore effectively describe growth in observed individuals or populations, but it is less useful for predicting age from size in unknown individuals.
Second, the VBG parameter k is notoriously difficult to interpret and is often misquoted as a growth rate. However, the units of k are 1/yr, and it cannot and should not be used as an explicit growth rate. Rather, k can be thought of as the constant in an exponential decay function similar to those used in radiometric dating approaches, where y = aebx. The von Bertalanffy constant k then becomes the rate-of-decay term b. When considering individuals and/or populations with similar L ∞ values, those with higher k values will approach maximum sizes faster, because the rate of decay of growth increment thickness (k) is higher than that for individuals with lower k values.
Comparing Growth Rates
For the paleontologist, especially one studying heterochrony or energetics through time, a metric with which to compare growth rates of individuals is of significant importance. The VBG parameter k has been suggested by us (Moss et al. Reference Moss, Ivany, Judd, Cummings, Bearden, Kim, Artruc and Driscoll2016, Reference Moss, Ivany, Silver, Schue and Artruc2017) and others to be a suitable proxy for growth rate, but as discussed earlier, this can be problematic. A better approach, especially when comparing populations in both space and time or across taxa, might be to use the ω parameter derived by Gallucci and Quinn (Reference Gallucci and Quinn1979), as it standardizes for body size:
 $${\rm \omega } = k\,\ast \;L_\infty $$
This reparameterization of VBG offers a way to test hypotheses of difference in growth rates between populations, because it compares the growth of individuals near t 0 and is in units of length/time. The ω parameter also avoids issues of the negative correlation between k and L ∞ within individuals from a population (Gallucci and Quinn Reference Gallucci and Quinn1979).
To illustrate this concept, consider age-at-size data collected from the Atlantic surf clam, Spisula solidissima, previously published by one of us (Jones et al. Reference Jones, Thompson and Ambrose1978; Ambrose et al. Reference Ambrose, Jones and Thompson1980). These data represent populations from an inshore and an offshore setting off the coast of New Jersey, USA, and they are an often-cited example of potential environmental controls on longevity and growth rate. The traditional approach to resolving differences in life-history strategy between the two populations is to fit a mean VBG growth curve to size-at-age data from each population. Visual inspection of the data reveals that individuals from the inshore population tend to be smaller and shorter lived than those from the offshore population (Fig. 2). VBG parameters for the equations best fit to the data from each of the populations demonstrate that the inshore population has a lower L ∞ (84.75 vs. 121.58 mm) and a higher k value (0.29 vs. 0.24) compared with the offshore population. In other words, while inshore individuals do not live as long or grow as large as offshore individuals, they approach their asymptotic sizes faster. Treating k (erroneously) as a direct measure of growth rate, we might conclude that inshore individuals grow faster than offshore individuals. However, this is not the case. At any given age, the height of offshore clams is greater than those of inshore clams. Hence, in terms of shell accreted per year, offshore clams are growing faster than inshore clams despite having lower k values. Calculating ω from the two best-fit VBG equations, however, reveals the intuitive difference between the two populations illustrated in the growth curves (inshore = 24.57; offshore = 29.18; Fig. 2). The ω parameter therefore reveals itself to be a better metric for comparing growth between populations, especially when their individuals reach different sizes.
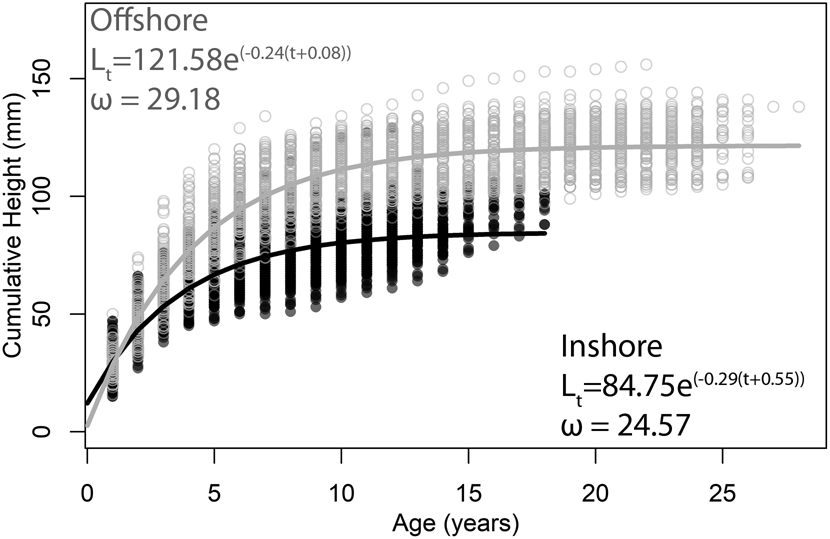
Figure 2. Best-fit von Bertalanffy growth equations to size-at-age data of Spisula solidissima from New Jersey. Filled circles are from “inshore” individuals (k = 0.29); open circles are from “offshore” individuals (k = 0.24). Data are from Jones et al. (Reference Jones, Thompson and Ambrose1978) and Ambrose et al. (Reference Ambrose, Jones and Thompson1980).
Using a single curve to describe the growth of an entire population is somewhat unsatisfying given the time and effort required to obtain such a large dataset. In the S. solidissima example, data on size-at-age for 412 sectioned counted and measured bivalves—a total of 5614 data points (3110 for inshore, 2504 for offshore)—have been reduced to two best-fit lines. Such an approach, while potentially illustrative of a broad general pattern, does not allow for an understanding of the variation in growth parameters among individuals that a population encompasses. Fitting VBG equations and deriving growth parameters for each individual in the dataset allows for a more sophisticated statistical comparison of their means and ranges of variation (Fig. 3). As expected from the growth curves, L ∞ is higher for offshore individuals, but k values overlap almost entirely. Values of ω for offshore individuals, however, are significantly higher than those for the inshore individuals, reflecting faster growth early in ontogeny.

Figure 3. Box plots of von Bertalanffy and ω parameters for each individual in Fig. 2. Boxes outline the inter quartile range. Whiskers extend to the extremes.
Investigating Life Span
Increment data, VBG parameters, and ω are effective ways to assess and compare growth trajectories among sampled individuals. There are occasions, however, when life span itself is the variable of interest and assessing life span comes with its own set of issues with respect to both detecting annual increments and reliably estimating age from body size.
In cases in which all growth bands are clearly visible and known to be annual, establishing life span is trivial. However, because linear accretion rate decreases throughout ontogeny, very little shell material may be added to the growing margin each year later in life (e.g., <0.1 mm in long-lived species like Arctica islandica; Thorarinsdóttir and Jacobson Reference Thorarinsdóttir and Jacobson2005). In some species, particularly those that are long lived and/or slow growing, growth increments become too compressed and obscured near the commissure to allow for accurate counting and measuring. In these instances, the hinge region often records a clearer record of growth increments, perhaps because the hinge is protected from environmental disturbances experienced at the commissure that might disrupt accretion. We find this to be the case, for example, for Glycymeris and Arctica (Thompson et al. Reference Thompson, Jones and Dreibelbis1980), as have others working both in the fossil record (Johnson et al. Reference Johnson, Harper, Clarke, Aaron, Heywood, Richardson, Spink and Thornton2019) and with modern bivalves (Peharda et al. Reference Peharda, Crnčević, Bušelić, Richardson and Ezgeta-Balić2012, Reference Peharda, Black, Purroy and Mihanovi2016; Brocas et al. Reference Brocas, Reynolds, Butler, Richardson, Scourse, Ridgway and Ramsay2013; Reynolds et al. Reference Reynolds, Butler, Williams, Scourse, Richardson, Wanamaker, Austin, Cage and Sayer2013a; Mette et al. Reference Mette, Wanamaker, Carroll, Ambrose and Retelle2016). In such cases we suggest transforming the data to represent shell height as would be measured using a standard pair of calipers (i.e., the “straight line” dorsal to ventral distance), accomplished by dividing the measured increment width by the total length of the hinge, then multiplying by the shell height. Doing so allows growth curves to be investigated in the context of the overall measured size distribution of a population.
The vagaries of preservation and limits on the choice or number of shells that can be sectioned and counted can put researchers in the position of needing to estimate life span from body size alone, using growth curves either from those same individuals that are incomplete or obscured (e.g., Buick and Ivany Reference Buick and Ivany2004) or from a subset of other individuals in that population or taxon. Cumulative shell height yields a body size measure that is clearly related to age, but real variation in the shape and rate of growth of individuals within a species, together with methodologically imposed variation due to inconsistencies in the axis along which shells are cut and/or measured, gives rise to differences in overall distance along the measured axis of growth that are not related to age (e.g., the variance in Fig. 2). This makes predictions about the age of individuals based on their body size alone more tenuous.
ALKs originally developed for modern fisheries (Fridriksson Reference Fridriksson1934) take this approach and are often applied to modern shellfish (e.g., Harding Reference Harding2007; Pace et al. Reference Pace, Powell, Mann, Long and Klinck2017). ALKs are constructed by first determining the size and age of a subset of a population. From this subset, the proportion of different ages in each length group (usually 5 mm categories) is determined and then used to assign ages to all individuals in the unknown sample (Kimura Reference Kimura1977; Bartoo and Parker Reference Bartoo and Parker1983; Bettoli and Miranda Reference Bettoli and Miranda2001). Despite their widespread and generally successful use in fast-growing modern populations, ALKs rely on a large number of initial samples to characterize the age–size relationships of an entire population, which does not avoid the issue of destructive sampling so often a concern for fossil specimens. As well, the approach is still subject to the problem outlined earlier—if there is significant overlap in size among age groups, as is typical for bivalves (see Fig. 2), ALKs tend to yield unreliable results (Westerheim and Ricker Reference Westerheim and Ricker1978). For shorter-lived, fast-growing taxa, errors tend to be small. But for long-lived taxa, differences in size of only a few millimeters later in life could equate to differences in estimated age of decades. The vagaries that affect growth in the first few years of life, when shells are typically growing faster, can result in large differences in body size among individuals of the same age later in life, effectively making age estimates from body size alone in in long-lived taxa impossible. Finally, the range of sizes for which age can be approximated using an ALK is determined by the original subsample. This means that an individual larger than any length category in the subsample either cannot be assigned an age or is erroneously assigned the age of the largest subsampled specimen. New probabilistic approaches to reasonably estimate age from size in long-lived taxa are sorely needed if life span is to be more widely investigated in the fossil record.
The Reawakening
Despite persistent methodological frustrations, the study of life-history evolution allowed by the combination of life-span and growth rate data archived in the shells of marine bivalves poses intriguing possibilities for macroevolution and ecology in deep time. Bivalves appear in the fossil record in the Early Cambrian (e.g., Jell Reference Jell1980; Runnegar and Bentley Reference Runnegar and Bentley1983) and dominate shallow-marine settings from the Mesozoic to the present (e.g., Gould and Calloway Reference Gould and Calloway1980; Liow et al Reference Liow, Reitan and Harnik2015; Hsieh et al. Reference Hsieh, Bush and Bret2019). Their preservation potential is high even in deep time (e.g., Jimenez et al. Reference Jimenez, Ivany, Judd and Henkes2019). They are therefore capable of recording very long-term patterns in the evolution of life histories. In the following sections, we offer some potential directions for future exploration.
Extreme Longevity
We have been interested in the evolution of extreme longevity and the mechanism(s) by which it is brought about for some time (Jones Reference Jones1980, Reference Jones1983; Buick and Ivany Reference Buick and Ivany2004; Moss et al. Reference Moss, Ivany, Silver, Schue and Artruc2017). While the modal maximum age of a bivalve today is 3 years (Moss et al. Reference Moss, Ivany, Judd, Cummings, Bearden, Kim, Artruc and Driscoll2016), more than 30 species are known to attain life spans in excess of 50 or even 100 years (Table 1). So-called maximum life span is inherently difficult to assess, as every specimen analyzed comes with the potential to extend the documented life span of a taxon. Nevertheless, the unusual set of ecological and life-history characteristics associated with species that can live for centuries is intriguing and invites further study. Is extreme longevity an ecophenotypic side consequence of slow metabolism due to thermal or caloric constraints, or has longevity been selected for through higher life span–integrated fecundity or some other advantage it confers under certain circumstances (see discussions in Buick and Ivany Reference Buick and Ivany2004; Philipp and Abele Reference Philipp and Abele2010; Moss et al. Reference Moss, Ivany, Silver, Schue and Artruc2017)? Are the known examples simply derived, circumstance-specific curiosities, or might they be relics from the deep past? Does, and how does, the distribution of life spans change over the course of the Phanerozoic? If greater longevity in bivalves is associated with slower growth (Abele et al. Reference Abele, Brey and Philipp2009; Ridgway et al. Reference Ridgway, Richardson and Austad2011a; Moss et al. Reference Moss, Ivany, Judd, Cummings, Bearden, Kim, Artruc and Driscoll2016), predictions arise from fundamental macroevolutionary and ecological trends postulated by paleobiologists. For example, if metabolic activity on average increases over the Phanerozoic, as suggested by Bambach (Reference Bambach1993), longevity and von Bertalanffy k and ω values should change systematically too. Likewise, predictions arise from the postulated impacts of escalation (sensu Vermeij Reference Vermeij1987) over time. High predation pressure could select for early growth to size refugia that prevent drilling or shell crushing. Alternatively, low or almost nonexistent predation could accommodate extremely slow growth and low metabolic rate, thereby promoting longevity. Documented low predation pressure (Aronson et al. Reference Aronson, Blake and Oji1997; Harper et al. Reference Harper, Crame and Sogot2018) might contribute to the presence of multiple unrelated long-lived taxa in the Cretaceous and Paleogene high-latitude deposits on Seymour Island, Antarctica (Moss et al. Reference Moss, Ivany, Silver, Schue and Artruc2017). If true, one might predict that slow growth and long life were not as unusual in the deep past as they are now. We expand on these questions a bit more in “Body-Size Evolution and Energetics.” Despite an available tool kit for assessing life history, few studies have explicitly examined the life spans of fossil species in these contexts.
Table 1. Life spans of modern bivalves known to attain life spans >50 years. Updated from Moss et al. (Reference Moss, Ivany, Judd, Cummings, Bearden, Kim, Artruc and Driscoll2016). MLSP, maximum reported life span for that species. See references for locality information.

Phylogenetic Expression
Sclerochronologically derived growth rates and longevities combined with phylogenetic comparative methods can inform us about how life-history traits map across the bivalve tree through time. Despite perceptions of a wealth of information, available life-history data for bivalves are concentrated within three subclasses (Moss et al. Reference Moss, Ivany, Judd, Cummings, Bearden, Kim, Artruc and Driscoll2016): Heterodonta (n = 193), Pteriomorphia (n = 89), and Protobranchia (n = 15) (Fig. 4). Limited taxonomic coverage might therefore restrict the potential questions—or at least their scope—that can be asked for the time being, and much work is needed to answer questions about the inheritance of life-history traits. However, the presence of centenarian taxa in all three subclasses suggests that extreme longevity has come about independently on multiple occasions and likely characterized the age frequencies of early bivalve groups as well. The degree to which age distributions have shifted over the course of the Phanerozoic is an outstanding question with important implications, as discussed further later. Little has been done to investigate potential relationships, but an analysis by Saulsbury et al. (Reference Saulsbury, Moss, Ivany, Kowalewski, Lindberg, Gillooly, Heim, McClain, Payne, Roopnarine, Schöne, Goodwin and Finnegan2019) suggests that life span and von Bertalanffy k are conserved within lineages of bivalves. If life span is a taxon-specific trait, it strengthens the argument for genetic control of life history and opens the door for longevity or its correlates (e.g., growth rate) to have bearing on the origin and differential survival of species. Indeed, some authors have begun to make this argument for bivalves in the context of extreme longevity (Abele and Philipp Reference Abele and Philipp2013).

Figure 4. Histograms of maximum reported life spans for bivalve subclasses, updated from Moss et al. (Reference Moss, Ivany, Judd, Cummings, Bearden, Kim, Artruc and Driscoll2016).
Because the tools of sclerochronology have only been sparingly applied to life histories of fossil bivalves, a bottom-up approach is necessary to begin answering questions of phylogenetic expression in deep time. The study of ancient bivalve life histories is in such infancy that almost any data generated for fossil taxa are likely to generate novel hypotheses. A worthwhile effort would be to assemble phylogenies for taxa that show, for example, long life spans today, push them back in time using the rock record, and try to discern patterns in the heritability of life-history traits within genera, eventually working toward higher taxonomic levels. Several phylogenies already exist that can facilitate this effort (e.g., Anderson and Roopnarine Reference Anderson and Roopnarine2003; Goodwin et al. Reference Goodwin, Anderson and Roopnarine2008; Bieler et al. Reference Bieler, Mikkelsen, Collins, Glover, González, Graf, Harper, Healy, Kawauchi, Sharma, Staubach, Strong, Taylor, Tëmkin, Zardus, Clark, Guzmán, McIntyre, Sharp and Giribet2014; McClure and Lockwood Reference McClure and Lockwood2015; Collins et al. Reference Collins, Crampton, Neil, Euan, Gazley, Collins, Crampton, Neil, Smith and Gazley2016; Alvarez and del Rio Reference Alvarez and del Rio2020). These analyses would have to be done in the context of climate, as temperature also plays a role in setting life-history traits, but the stable oxygen isotope data generated to verify the annual nature of growth increments can also yield that information. We illustrate two pathways for futher exploration of phylogenetic control, but of course many similar opportunities exist across the Bivalvia.
The life-history traits of the cool-water bivalve Arctica islandica appear to be taxon specific and hence likely genetically controlled. As the longest-lived non-colonial animal on the planet, A. islandica has garnered much attention from the medical community studying the aging process (Philipp and Abele Reference Philipp and Abele2010). In one study (Ungvari et al. Reference Ungvari, Sosnowska, Mason, Gruber, Lee, Schwartz, Borwn, Storm, Fortney, Sowa, Byrne, Kurz, Levy, Sonntag, Austad, Csiszar and Ridgway2013), A. islandica was found to have a higher capacity to resist the oxidative stressors commonly associated with aging than two shorter-lived species (Mercenaria mercenaria: maximum reported life span [MLSP] = 100 years; Argopecten irradians irradians: MLSP = 2 years). Other studies have confirmed the same using alternative approaches, and it seems that A. islandica might trade slow growth and late onset of reproduction for lower rates of cell damage (e.g., Strahl et al. Reference Strahl, Philipp, Brey, Broeg and Abele2007).While its maximum life span of 507 years is reported from near the northernmost extent of its range, in Iceland (Butler et al. Reference Butler, Wanamaker, Scourse, Richardson and Reynolds2013), it routinely reaches ages in excess of 200 years off the U.S. coastline (e.g., Ropes Reference Ropes1984; Fritz Reference Fritz1991), and its von Bertalanffy k values throughout its distribution are consistently some of the lowest reported of any bivalve (Moss et al. Reference Moss, Ivany, Judd, Cummings, Bearden, Kim, Artruc and Driscoll2016). Are the extreme longevity and slow growth of modern A. islandica recently acquired, or inherited from an earlier member of the lineage? Pleistocene representatives exhibit life spans exceeding several centuries in midlatitude settings (von Leesen et al. Reference Leesen, Beierlein, Scarponi, Schöne and Brey2017), suggesting that extreme longevity has been a trait of A. islandica throughout time. While monotypic today, the genus appears to have originated during the Triassic (Giebel Reference Giebel1856), affording the opportunity to study the evolution of life-history traits over a long stretch of geologic time. We are aware of life-history data from only one other member of the genus, Arctica ovata, albeit from a small sample (n = 3). Nevertheless, during the greenhouse conditions of the Cretaceous, A. ovata lived for at least two decades in the northern part of the Western Interior Seaway (Jones Reference Jones and McKinney1988). If the data were available, how would life span distribute across a phylogeny for the genus as a whole in comparison to its ancestor or sister groups?
While Arctica certainly presents an interesting avenue for exploration in deep time, not all bivalves are created equal, and some groups will lend themselves better to understanding the phylogenetic expression of longevity than others. When deciding how to proceed in this direction, efforts are perhaps best focused on groups that have: (1) modern phylogenies that can help guide hypotheses; (2) robust shell material that would increase the potential for growth increment preservation; and (3) a considerable amount of life-history data from modern representatives, including long-lived taxa. One such group is the order Arcoida. Recently published molecular phylogenies have begun to unravel the complex relationships within the group (Oliver and Holmes Reference Oliver and Holmes2006; Feng et al. Reference Feng, Li and Kong2015; Combosch and Giribet Reference Combosch and Giribet2016; Kong et al. Reference Kong, Li, Kocot, Yang, Qi, Li and Halanych2020), including the nesting of the Cucullaeidae and Glycymerididae. Our work (Moss et al. Reference Moss, Ivany, Silver, Schue and Artruc2017) and that of others (e.g., Walliser et al. Reference Walliser, Schöne, Tutken, Zirkel, Grimm and Pross2015; Johnson et al. Reference Johnson, Harper, Clarke, Aaron, Heywood, Richardson, Spink and Thornton2019) have shown fossil representatives of these superfamilies to include long-lived species. Modern Glycymeris might be the most approachable, as representatives are known for their easily readable growth increments and impressive longevity (see Table 1) and could provide a genetic basis from which to build a more focused phylogeny. The genus originates in the Mesozoic and is well preserved in the Cenozoic sediments of eastern North America and Europe (Fig. 5), so a study spanning an entire ocean basin is conceivable. A phylogeny, albeit pre-cladistics revolution, for Plio-Pleistocene Glycymeris from the Atlantic Coastal Plain of the United States (Thomas Reference Thomas1970) can serve as the foundation for such a study.
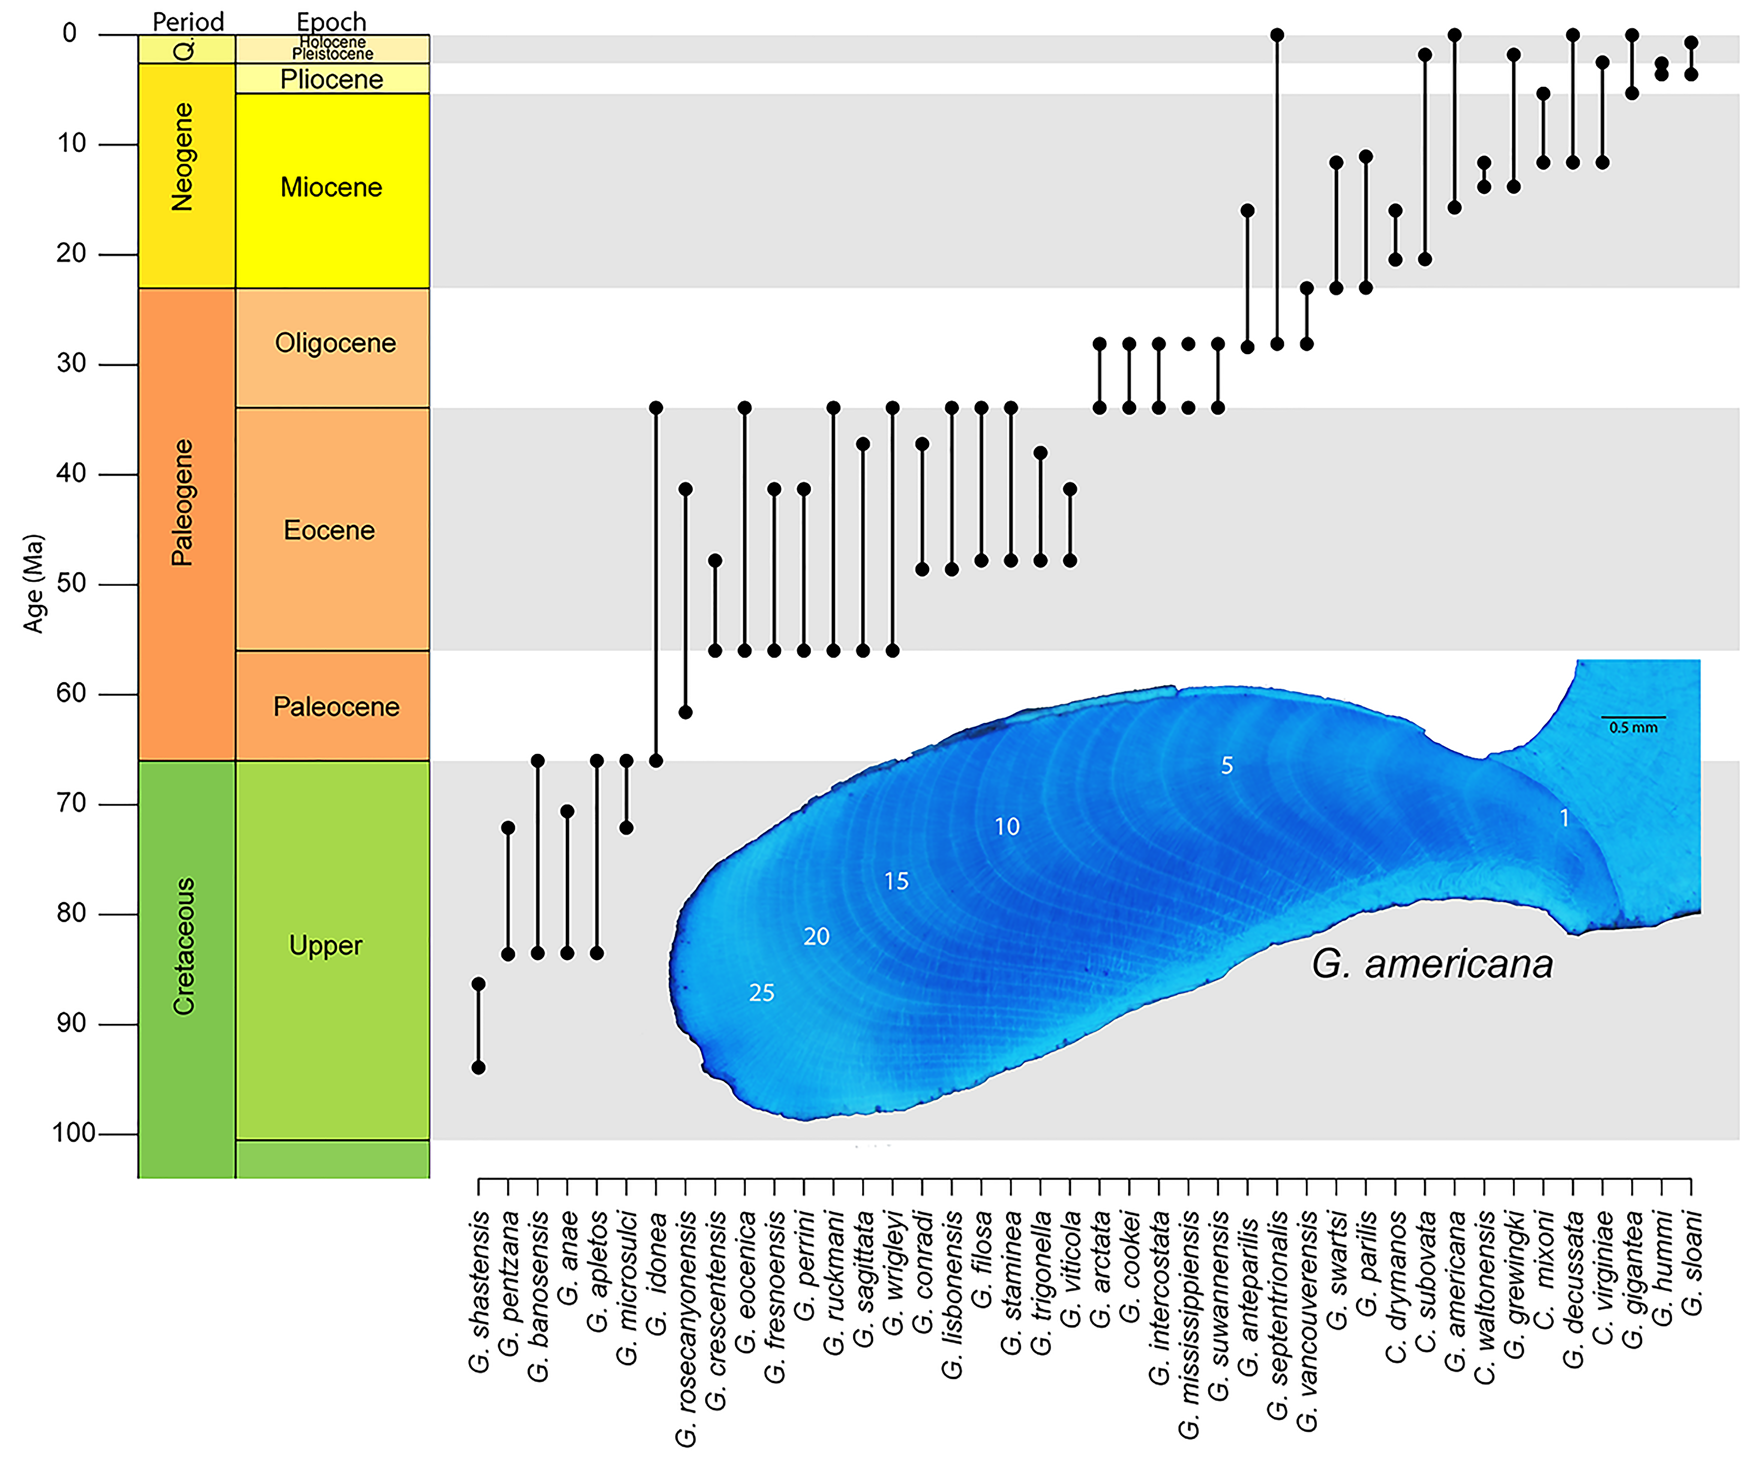
Figure 5. Stratigraphic ranges for Glycymeris from North America as reported in the Paleobiology Database. Ranges for species of Costaglycymeris are also included, as they are likely closely related to Glycymeris. Insert shows hinge region growth increments of G. americana stained with Mutvei's solution. Specimen is from Pleistocene, Waccamaw Formation in North Carolina, USA.
Latitudinal Life-History Gradient (LLHG)
The spatial distribution of life spans and growth rates among bivalves today is distinctly nonrandom. Despite a good deal of variation, modern marine-shelf Bivalvia display a statistically significant LLHG of increasing life span and decreasing von Bertalanffy k values moving from the tropics to the poles (Moss et al. Reference Moss, Ivany, Judd, Cummings, Bearden, Kim, Artruc and Driscoll2016). At the high latitudes, variance in life span is high, but growth is universally slow; in the tropics, k is variable, but life span is universally short, aside from photosymbiotic taxa. This general pattern holds within orders and within at least 12 well-sampled species (Moss et al. Reference Moss, Ivany, Judd, Cummings, Bearden, Kim, Artruc and Driscoll2016). The freshwater bivalve Margaritifera displays a similar pattern (Bauer Reference Bauer1992).
Such a trend with latitude calls for an explanation based on factors linked with latitude, such as temperature, light regime, and/or predation pressure. Cooler temperatures (Brey and Clarke Reference Brey and Clarke1993; Clarke et al. Reference Clarke, Brey and Clarke1993; Peck and Conway Reference Peck and Conway2000) and restricted availability of food (Masoro Reference Masoro2000) have often been suggested to promote longer life spans through a reduction in metabolic rate (e.g., Basova et al. Reference Basova, Begum, Strahl, Sukhotin, Brey, Philipp and Abele2012). Thus, the modern LLHG might be driven by some combination of cooler temperatures and the highly seasonal light regime and associated seasonal abundance (and dearth) of phytoplankton at the poles. Saulsbury et al. (Reference Saulsbury, Moss, Ivany, Kowalewski, Lindberg, Gillooly, Heim, McClain, Payne, Roopnarine, Schöne, Goodwin and Finnegan2019) find that winter temperature explains more of the variance in the von Bertalanffy growth coefficients of modern bivalves than does summer temperature or productivity, but not surprisingly, the situation is complex (Reed et al. Reference Reed, Godbold, Grange and Solan2020) and the variance, high. The presence of several species of long-lived bivalves in the Cretaceous and Paleogene of Antarctica (Buick and Ivany Reference Buick and Ivany2004; Ivany et al. Reference Ivany, Brey, Huber, Buick and Schöne2011; Moss et al. Reference Moss, Ivany, Silver, Schue and Artruc2017; Fig. 6A–C), when nearshore water temperatures approached those along the modern mid-Atlantic Coast, USA (Douglas et al. Reference Douglas, Affek, Ivany, Houben, Sijp, Sluijs, Schouten and Pagani2014; Tobin et al. Reference Tobin, Wilson, Eiler and Hartman2014; Petersen et al. Reference Petersen, Dutton and Lohmann2016; Judd et al. Reference Judd, Ivany, DeConto, Halberstadt, Miklus, Junium and Uveges2019), suggests that something about high-latitude settings beyond temperature alone is facilitating extreme longevity. Nevertheless, the LLHG predicts that the high latitudes should harbor a greater proportion of long-lived taxa back through time as well, and perhaps particularly so during times of icehouse conditions. At least two moderately long-lived bivalves are known from the early Permian glacially influenced settings of SE Australia (Fig. 6D,E): Eurydesma cordatum likely attained life spans in excess of 30 years (Ivany and Runnegar Reference Ivany and Runnegar2010; Beard et al. Reference Beard, Ivany and Runnegar2015), and Myonia corrugata lived for at least 55 years (Ivany and Runnegar Reference Ivany and Runnegar2007), but data thus far are few.
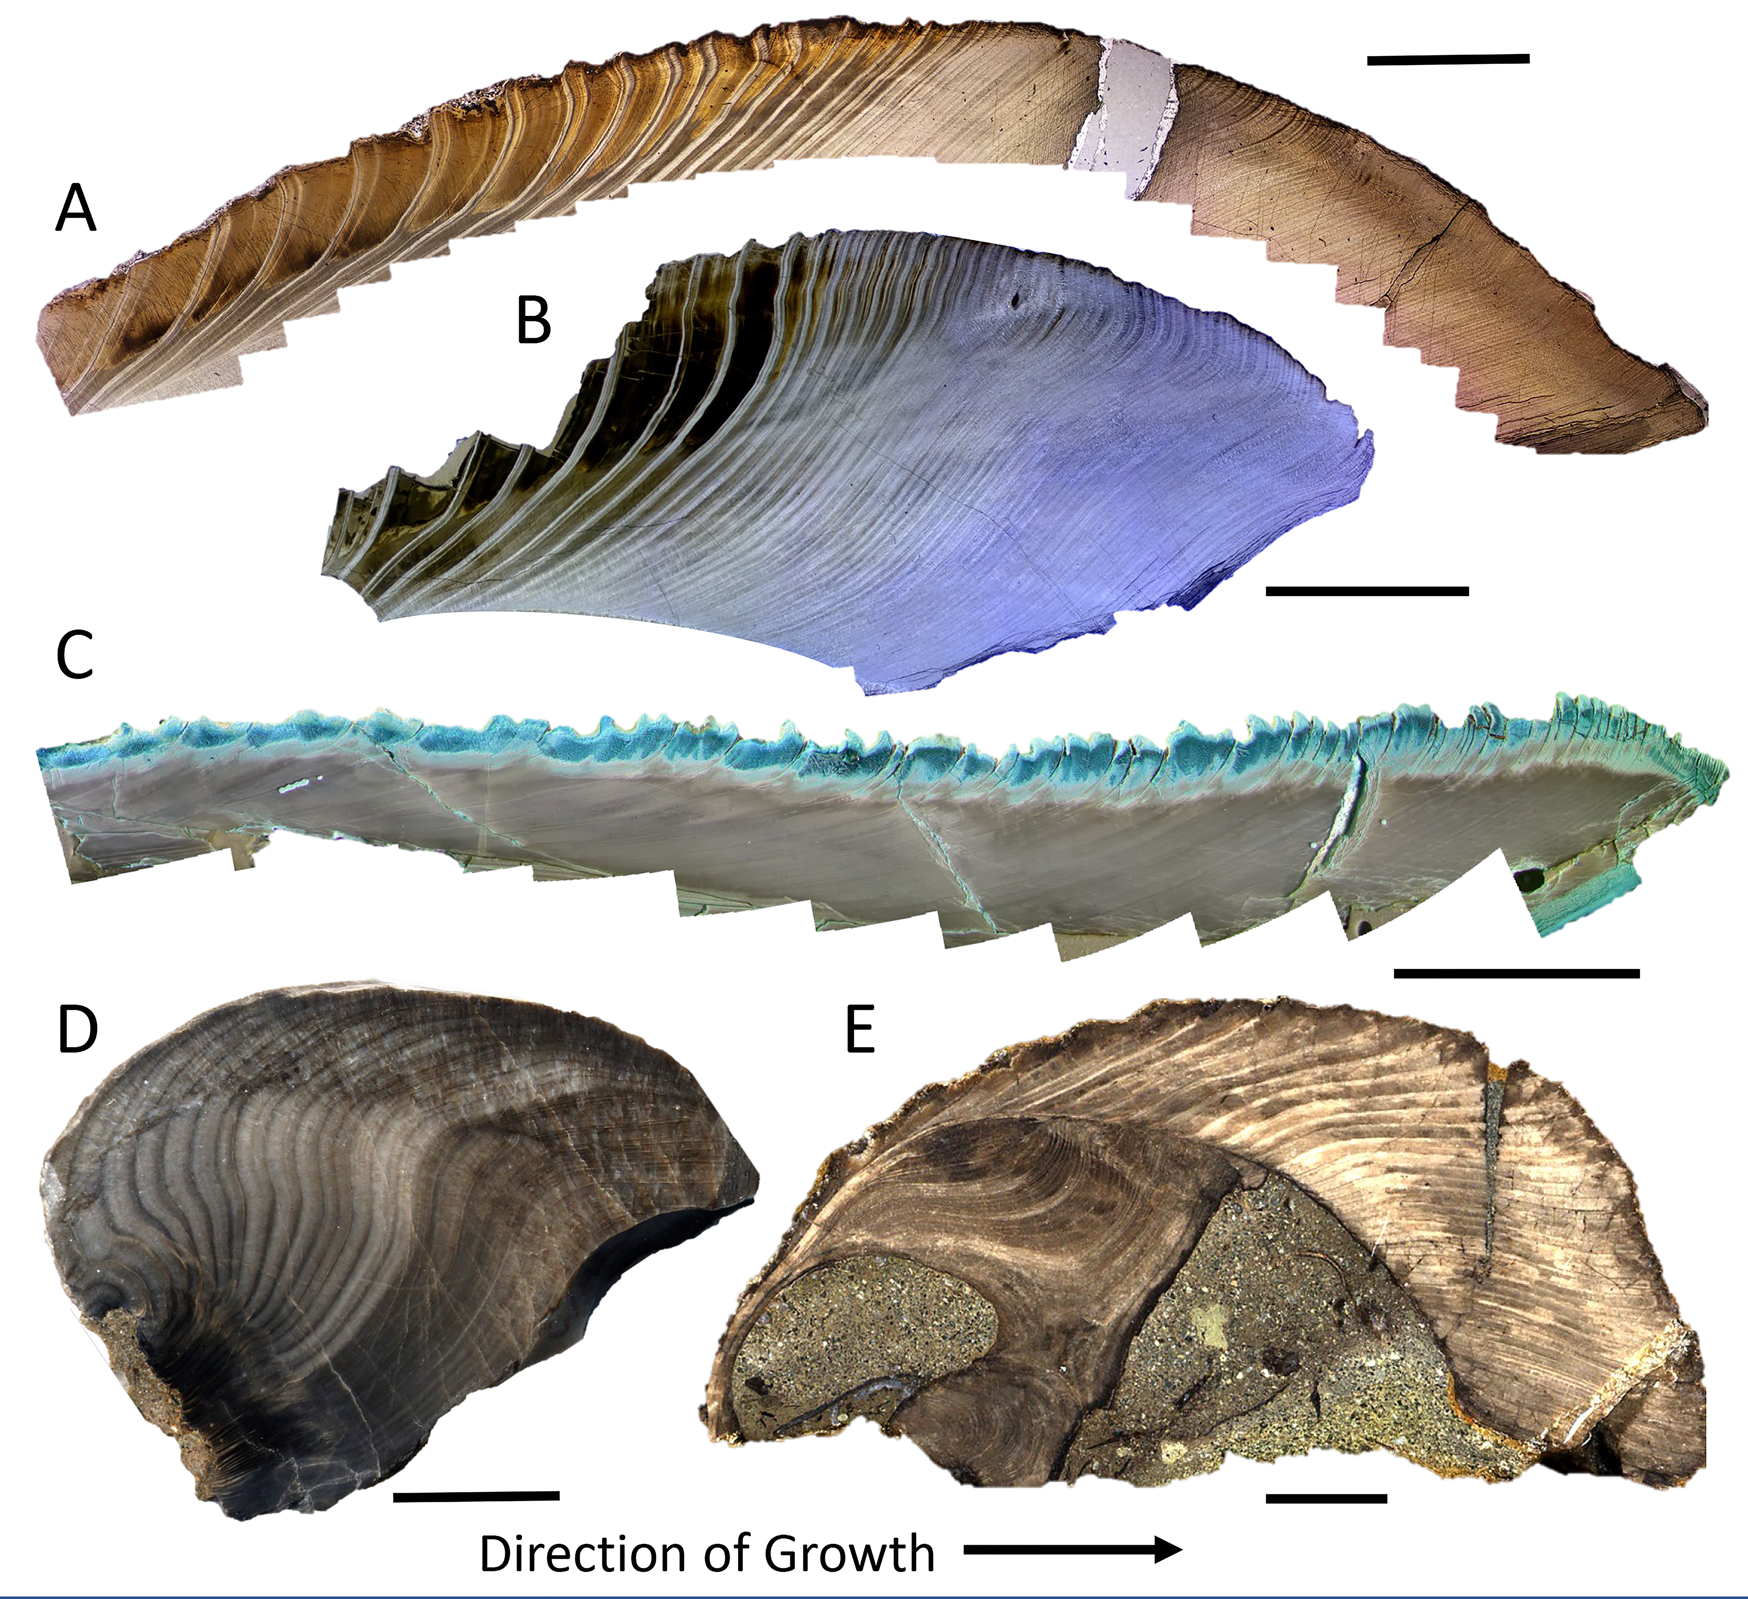
Figure 6. Annual growth banding in a sample of long-lived, high-latitude, fossil bivalves, showing partial or complete ontogenetic sequences. Cucullaea raea (A, B) and Retrotapes antarctica (C) (with Mutvei's stain) from the middle Eocene of Seymour Island, Antarctica. Images depict only the middle and outer shell layers (A, C), and growing margin of the shell (B). The umbonal region of Eurydesma cordatum (D) and complete shell of Myonia corrugata (E) from the early and late Permian, respectively, of the South Sydney Basin, Australia. Both localities have paleolatitudes of about 70°S. Growth is from left to right in each case. Scale bars for A–C 0.5 cm; scale bars for D and E, 1 cm. Annual nature of banding in these taxa is documented in Buick and Ivany (Reference Buick and Ivany2004); Ivany and Runnegar (Reference Ivany and Runnegar2007, Reference Ivany and Runnegar2010); Ivany et al. (Reference Ivany, Lohmann, Hasiuk, Blake, Glass, Aronson and Moody2008); Beard et al. (Reference Beard, Ivany and Runnegar2015); Moss et al. (Reference Moss, Ivany, Silver, Schue and Artruc2017); Judd et al. (Reference Judd, Ivany, DeConto, Halberstadt, Miklus, Junium and Uveges2019).
To the degree that temperature is a predictor of life history, as global temperature gradients decrease with overall warming, so too should the slope and strength of the LLHG in marine bivalves. We currently know very little about how the LLHG of marine bivalves changes with global climate change over the Phanerozoic. However, a recent study by Palmer et al. (Reference Palmer, Moss, Surge and Turek2021) suggests that the latitudinal gradient in VBG k for Mercenaria spp. might be steeper in the cooler Pleistocene than during the mid-Pliocene warm period, as might be hypothesized given evidence for polar amplification (warming) during the Pliocene (Lunt et al. Reference Lunt, Haywood, Schmidt, Salzmann, Valdes, Dowsett and Loptson2012; Hopcroft et al. Reference Hopcroft, Ramstein, Pugh, Hunter, Murguia-Flores, Quiquet, Sun, Tan and Valdes2020). A broader study of the mid-Pliocene fauna is required to test the hypothesis of a shallower gradient for the Bivalvia during this warm interval, but such a project is within reach given the extensive and fossil-rich deposits of the coastal plain. Furthermore, the presence of the aforementioned high austral taxa is suggestive of the persistence of a gradient during both warm, equable greenhouse intervals and cool, seasonal icehouse intervals, but currently there are insufficient low-latitude data with which to compare them to assess a possible change in slope. Another potentially fruitful study area is the Cretaceous Western Interior Seaway of North America, containing a well-sampled bivalve fauna stretching from the Gulf of Mexico into northern Canada. Interestingly, though only anecdotal thus far, Erickson and Palmateer (Reference Erickson and Palmateer1996) describe Panopea in a latest Cretaceous assemblage from North Dakota (paleolatitude ~50°N) and report a maximum of only 16 growth bands in specimens as large as 91 mm in length. Today at that latitude, Panopea averages more than 100 years old (Bureau et al. Reference Bureau, Hajas, Surry, Hand, Dovey and Campbell2002; Moss et al. Reference Moss, Ivany, Judd, Cummings, Bearden, Kim, Artruc and Driscoll2016).
Life-History Evolution and the Latitudinal Diversity Gradient (LDG)
The degree to which the LLHG characterizes life histories in deep time raises several questions for evolutionary paleobiology. From a macroevolutionary perspective, if the LLHG holds in the past, it could contribute to the most evident pattern in biodiversity on the planet's surface today, the LDG (Moss et al. Reference Moss, Ivany, Judd, Cummings, Bearden, Kim, Artruc and Driscoll2016). Modern bivalves follow a robust LDG (Crame Reference Crame2000, Reference Crame2002; Roy et al. Reference Roy, Jablonski and Valentine2000; Valentine and Jablonski Reference Valentine and Jablonski2010; Jablonski et al. Reference Jablonski, Huang, Roy and Valentine2017) that results from some combination of higher speciation rates in and range expansion beyond the tropics (Crame Reference Crame2000; Jablonski et al. Reference Jablonski, Roy and Valentine2006, Reference Jablonski, Belanger, Berke, Huang, Krug and Roy2013, Reference Jablonski, Huang, Roy and Valentine2017; Clarke and Crame Reference Clarke and Crame2010). The reasons behind higher origination rates in the tropics are poorly understood (Jablonski et al. Reference Jablonski, Roy and Valentine2006), but life history could play a role. As related before, tropical bivalves tend to have higher k values than mid- and high-latitude bivalves (Moss et al. Reference Moss, Ivany, Judd, Cummings, Bearden, Kim, Artruc and Driscoll2016). Higher von Bertalanffy k values represent a “faster” approach to the asymptotic size (L ∞), and body size positively correlates with reproductive potential in bivalves (e.g., Peterson Reference Peterson1986; Nakaoka Reference Nakaoka1994). Tropical bivalves then, with their typically higher k values, would likely reach reproductive maturity faster and hence have shorter generation times. These latter traits are correlated with faster rates of molecular evolution in invertebrates (e.g., Thomas et al. Reference Thomas, Welch, Lanfear and Bromham2010) and mammals (Nabholz et al. Reference Nabholz, Glemin, Galtier, Glémin, Galtier, Glemin and Galtier2008). Faster growth and shorter generation times in the tropics might therefore drive the LDG at least in part because of the greater potential to accumulate mutations upon which selection can then act. Conversely, polar taxa have lower k values and slower growth and tend to delay the onset of sexual maturity (Ridgway et al. Reference Ridgway, Richardson and Austad2011a), all of which might make them less likely to generate new taxa. This does not address the component of range expansion out of the tropics, but the propensity for higher tropical origination rates could well be traced back to life-history parameters.
If the LLHG is related to the LDG today, then this might be the case in the past as well. An LDG has been demonstrated for a number of time intervals back into the Paleozoic (Crame Reference Crame2000, Reference Crame2002; Alroy et al. Reference Alroy, Aberhan, Bottjer, Foote, Fürsich, Harries, Hendy, Holland, Ivany, Kiessling, Kosnik, Marshall, McGowran, Miller, Olszewski, Patzkowsky, Peters, Villier, Wagner, Bonuso, Borkow, Brenneis, Clapham, Fall, Furguson, Hanson, Krug, Layou, Leckey, Nürnberg, Powers, Sessa, Simpson, Tomašových and Visaggi2008), and its strength appears to vary with mean global temperature (Crame Reference Crame2000; Powell Reference Powell2007; Mannion et al. Reference Mannion, Upchurch, Benson and Goswami2014). How does the LLHG of marine bivalves vary among intervals with documented LDGs? Does the shallowing and steepening of thermal gradients, driven especially by high-latitude temperatures, allow for changes in life history that promote higher and lower taxon origination rates, respectively, in the mid-to-high latitudes? Data on taxon (stratigraphic) age distributions by latitude for warm and cool intervals in the past could help to test this hypothesis. However, range expansion out of the tropics is more likely during warm climate intervals, and taxa that successfully expand out of the tropics also tend to have higher speciation rates (Krug et al. Reference Krug, Jablonski and Valentine2008; Jablonski et al. Reference Jablonski, Belanger, Berke, Huang, Krug and Roy2013), so distinguishing between the two could prove difficult.
Body-Size Evolution and Energetics
Body size is an important parameter in evolution, as it typically correlates with fecundity, metabolic rate, and population size (Brown et al. Reference Brown, Marquest and Taper1993). Ultimately determined by some combination of growth rate and life span, body size falls squarely in the sclerochronological domain. One of the more dramatic patterns in the marine fossil record is the increase in mean body size of animals over the Phanerozoic (Payne et al. Reference Payne, Boyer, Brown, Finnegan, Kowalewski, Krause, Lyons, McClain, McShea, Novack-Gottshall, Smith, Stempien and Wang2009; Heim et al. Reference Heim, Knope, Schaal, Wang and Payne2015). The trend is evident within marine bivalves as well and appears to also hold true at the ordinal level (Fig. 7); Carditida, for example, shows an increase in mean body size of almost two orders of magnitude over its history. How is this pattern brought about—faster growth, longer life, or a subequal combination of both? Sclerochronological data are the key to test hypotheses related to any of these.
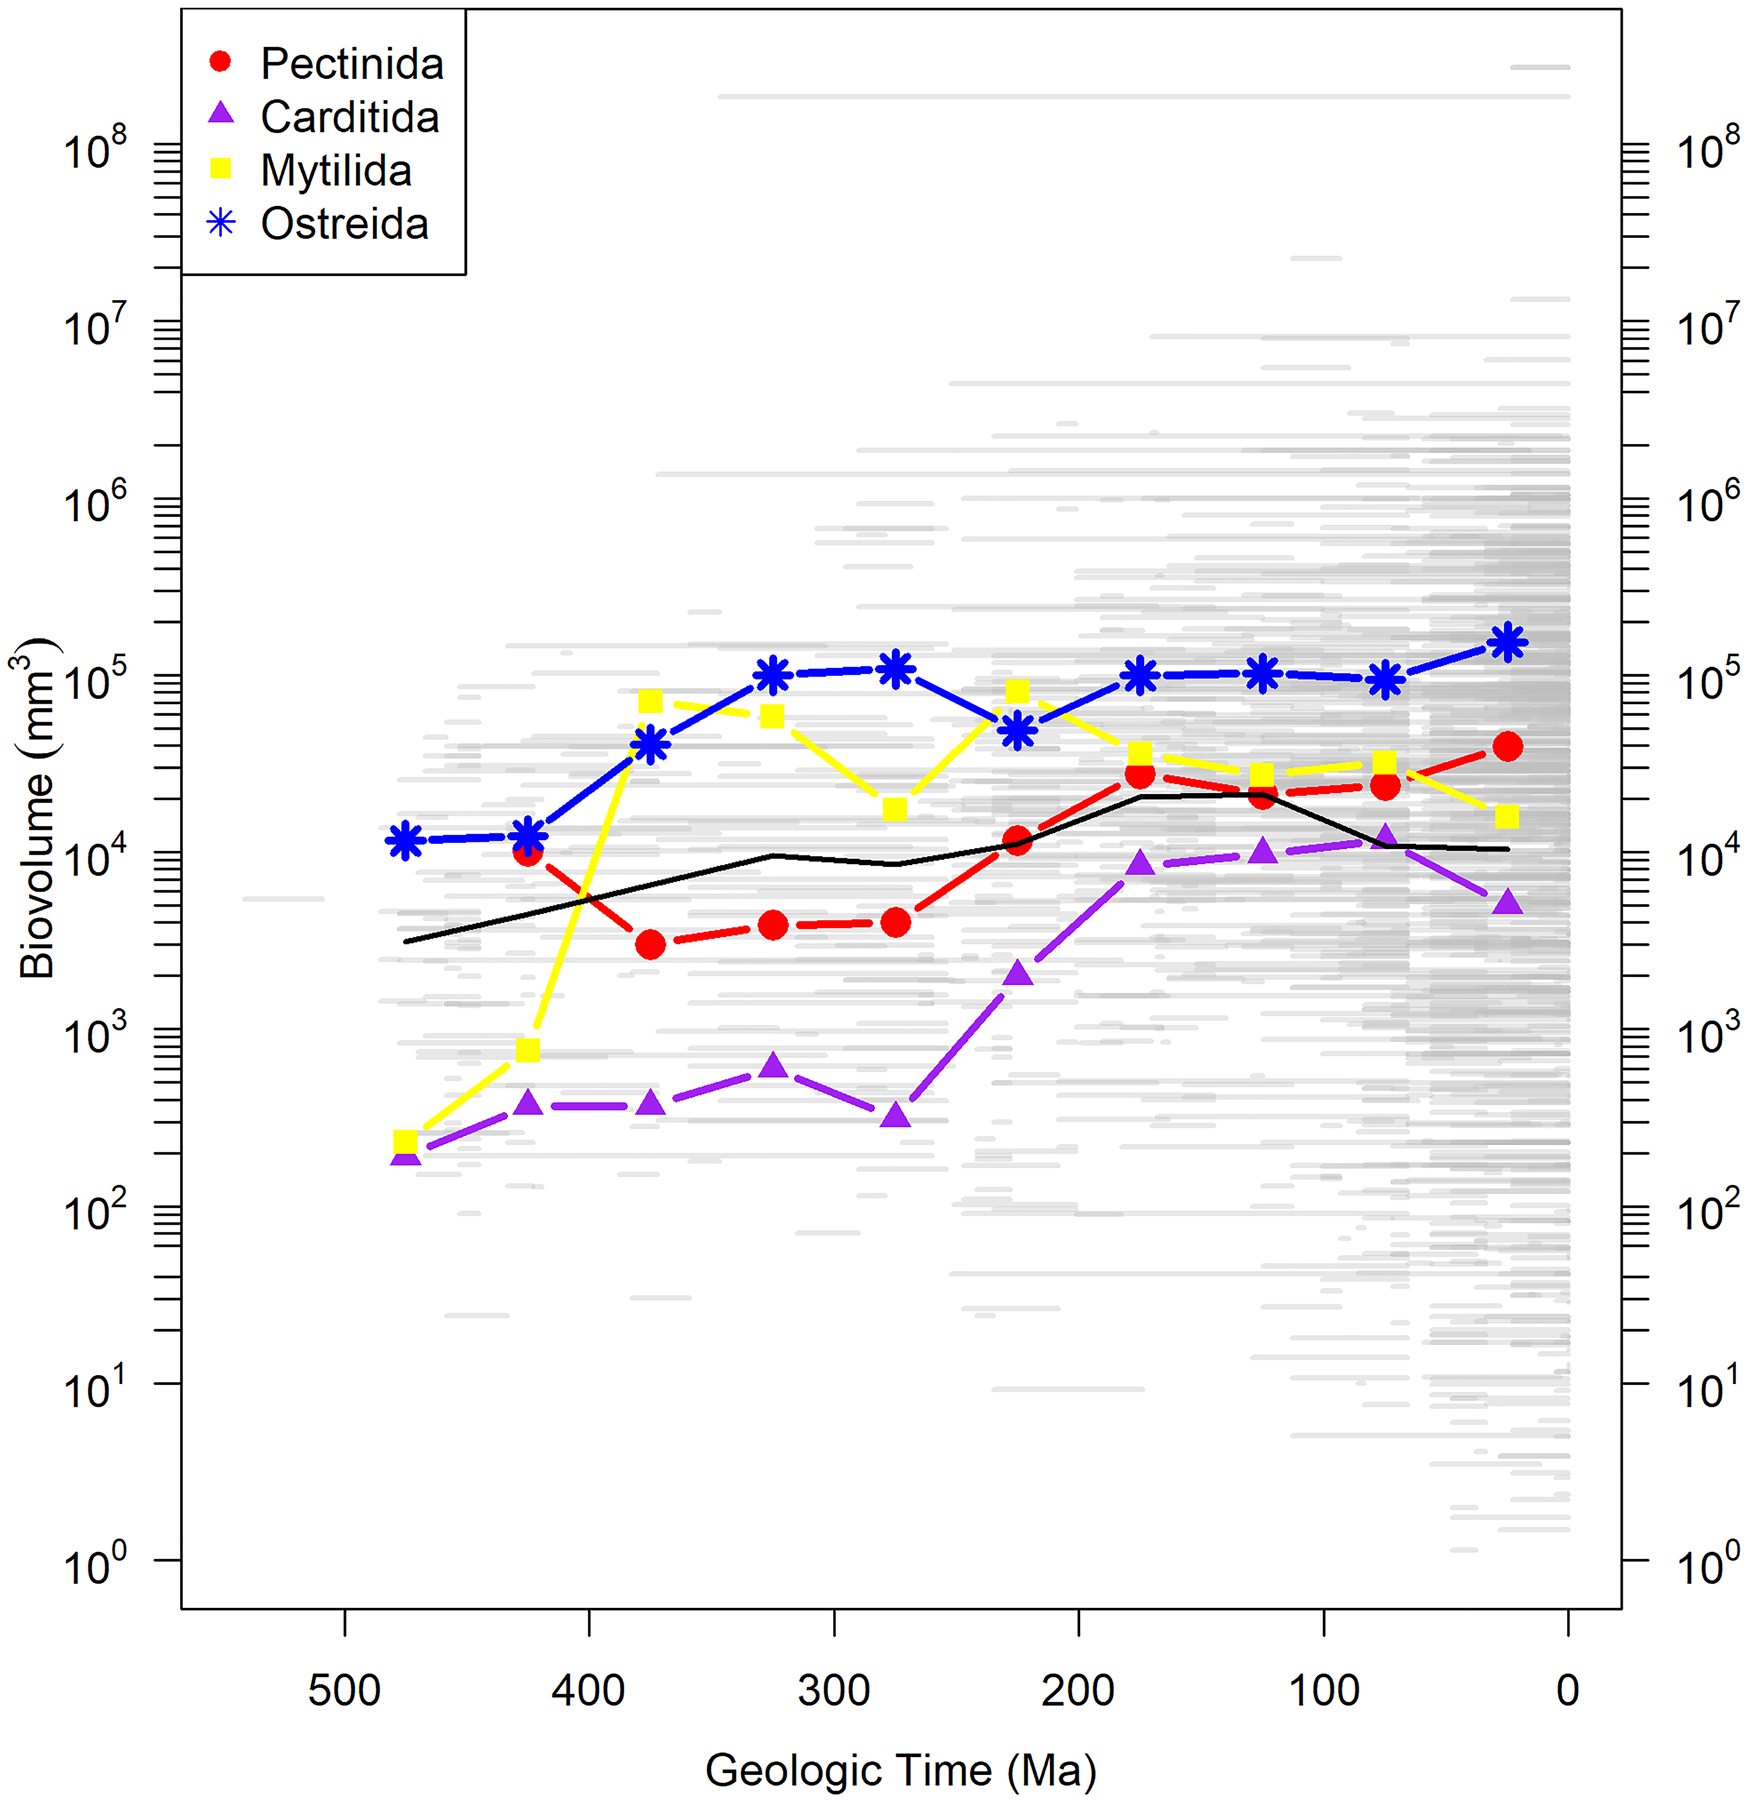
Figure 7. Biovolume of bivalve genera in four orders through the Phanerozoic derived from Heim et al. (Reference Heim, Knope, Schaal, Wang and Payne2015) and plotted as body size of the largest measured species within each genus over the geologic range of the entire genus. Gray bars are geologic ranges. Colored lines with symbols show mean biovolume for orders in 50 Myr time bins. Black line is mean of all bivalves from the Heim et al. (Reference Heim, Knope, Schaal, Wang and Payne2015) database. Note that the taxonomy used in Heim et al. (Reference Heim, Knope, Schaal, Wang and Payne2015) follows that reported in the Paleobiology Database, which is based on Carter et al. (Reference Carter, Altaba, Anderson, Araujo, Biakov, Bogan, Campbell, Campbell, Jin-hua, Cope, Delvene, Dijkstra, Zong-jie, Gardner, Gavrilova, Goncharova, Harries, Hartman, Hautmann, Hoeh, Hylleberg, Bao-yu, Johnston, Kirkendale, Kleemann, Koppka, Kriz, Machado, Malchus, Márquez-aliaga, Masse, Mcroberts, Middlefart, Mitchell, Nevesskaja, Özer, Pojeta, Polubotko, Pons, Popov, Sánchez, Sartori, Scott, Sey, Signorelii, Silantiev, Skelton, Steuber, Waterhouse, Wingard and Yancey2011). (Color online.)
A propensity for faster growth rates toward present is consistent with hypothesized bioenergetic trends in the Phanerozoic history of marine life, the foundations of which were laid by Vermeij (Reference Vermeij1977, Reference Vermeij1987) and Bambach (Reference Bambach1993). Many authors (e.g., Signor and Brett Reference Signor and Brett1984; Signor and Vermeij Reference Signor and Vermeij1994; Martin Reference Martin1996, Reference Martin2003; Bambach Reference Bambach1999; Finnegan et al. Reference Finnegan, McClain, Kosnik and Payne2011; Finnegan Reference Finnegan2013; Allmon and Martin Reference Allmon and Martin2014; Payne et al. Reference Payne, Heim, Knope and McClain2014; Knoll and Follows Reference Knoll and Follows2016; Martin and Servais Reference Martin and Servais2020) have since argued for a general increase in metabolic activity in marine organisms through time fueled by factors including, but not limited to: changes in the diversity and abundance of marine phytoplankton, increased continental weathering rates due to the appearance of terrestrial plants, changes in seafloor spreading rates and the emplacement of large igneous provinces, and orogenic events and the subsequent increased nutrient loads to the oceans. While much of this work has been almost necessarily qualitative, Finnegan et al. (Reference Finnegan, McClain, Kosnik and Payne2011) attempted to quantify change in the metabolic rates of marine gastropods over the Mesozoic marine revolution using body-size and abundance data in concert with physiological data from living representatives. They argue for a 150% increase in mean metabolic rate between the Late Triassic and the Paleogene, consistent with the “seafood through time” (Bambach Reference Bambach1993) hypothesis. While their conclusions are tied to changes in body size, growth rates provided by increment data could verify this and provide the ultimate test of the “seafood” hypothesis. Faster growth rates toward the present would also be consistent with an overall increase in predation pressure and the evolutionary arms race called for by escalation (Vermeij Reference Vermeij1987), not unrelated to Bambach's “seafood.”
Concomitant with the proposed increase in organism energetics is a now well-documented general increase in predation activity in the marine realm, recorded especially with benthic taxa (Vermeij et al. Reference Vermeij, Schindel and Zipser1981; Signor and Brett Reference Signor and Brett1984; Leighton Reference Leighton2002; Harper Reference Harper2003, Reference Harper2006; Kelley and Hansen Reference Kelley and Hansen2006; Huntley and Kowalewski Reference Huntley and Kowalewski2007). How do the life-history strategies of bivalves change in response to the appearance of new and perhaps more sophisticated predators over geologic time? Evidence of predation on Paleozoic marine benthic taxa is generally sparser, but not altogether absent (e.g., Sheehan and Lesperance Reference Sheehan and Lesperance1978; Smith et al. Reference Smith, Thayer and Brett1985; Leighton Reference Leighton1999; Brett and Walker Reference Brett and Walker2002; Nagel-Myers et al. Reference Nagel-Myers, Dietl and Brett2009; Richards and Leighton Reference Richards and Leighton2012; Salamon et al. Reference Salamon, Gorzelak, Niedźwiedzki, Trzęsiok and Baumiller2014). However, predation pressure increases in the Mesozoic (Vermeij Reference Vermeij1987). From the perspective of bivalves, many of the mechanisms to avoid predation are behaviors that require a faster metabolic rate. These include, but are not limited to, higher calcification budgets associated with thicker (Kelley Reference Kelley1989, Reference Kelley1991) and more ornamented (Feifarek Reference Feifarek1987; Harper and Skelton Reference Harper and Skelton1993; Dietl et al. Reference Dietl, Alexander and Bien2000) skeletons, faster and deeper burrowing (Stanley Reference Stanley1968; Doering Reference Doering1982; Palmer Reference Palmer1982; Harper Reference Harper1991), and new escape methods such as swimming and leaping (Ansell Reference Ansell1969; Hayami Reference Hayami1991; Donovan et al. Reference Donovan, Elias and Baldwin2004). Higher metabolic rates equate to faster growth, and this generally correlates with shorter life spans (e.g., Van Voorhies Reference Van Voorhies2001). High predation pressure itself also selects for faster growth to reach size refugia and early maturation so as to ensure successful reproduction before death (Stearns Reference Stearns1992; Brown and Sibly Reference Brown and Sibly2006). A different approach to dealing with high predation pressure is to retreat from it altogether to a place that cannot be accessed. A very deep burrow that renders many potential predators ineffective could allow animals like modern Panopea generosa the flexibility for life spans (up to 150 years; Bureau et al. Reference Bureau, Hajas, Surry, Hand, Dovey and Campbell2002) longer than typically associated with their k values (Moss et al. Reference Moss, Ivany, Judd, Cummings, Bearden, Kim, Artruc and Driscoll2016; Fig. 4). Though there is some variability in age at first reproduction, modern A. islandica typically mature around 20–30 years (Thorarinsdóttir and Jacobson Reference Thorarinsdóttir and Jacobson2005), a strategy only allowed by low rates of predation. Lower predation pressure in the Paleozoic might therefore equate to slower growth and longer life spans. The life-history information gap is a roadblock to understanding the physiological responses of organisms to the Mesozoic marine revolution, and potentially other major macroevolutionary transitions in the history of life.
Extinction Selectivity
The roles that life span and growth rate play in survival during extinctions and the recoveries that follow could be a missing piece of the narrative. Many biodiversity crises are now known to be associated at least in part with a drop in primary production in the oceans, most famously the Cretaceous/Paleogene boundary mass extinction (Hsu and McKenzie Reference Hsu and McKenzie1985; Kump Reference Kump1991; D'Hondt Reference D'Hondt2005; Kring Reference Kring2007; Alegret et al. Reference Alegret, Thomas and Lohmann2012; Sepúlveda et al. Reference Sepúlveda, Alegret, Thomas, Haddad, Cao and Summons2019). Selectivity among bivalves at the K/Pg is complicated (Rhodes and Thayer Reference Rhodes and Thayer1991; Jablonski and Raup Reference Jablonski and Raup1995; McClure and Bohonak Reference McClure and Bohonak1995; Jablonski Reference Jablonski1998; Lockwood Reference Lockwood2003, Reference Lockwood2004), but under such conditions, taxa with lower metabolic rates/needs will tend to do better (Thayer Reference Thayer1986; Gallagher Reference Gallagher1991; Rhodes and Thayer Reference Rhodes and Thayer1991; Landman et al. Reference Landman, Goolaerts, Jagt, Jagt-Yazykova, Machalski and Yacobucci2014). This is a testable hypothesis for bivalves, as surviving taxa, either within a fauna or globally, should tend to have slower growth and longer life spans in comparison to those that suffer extinction. In addition, high-latitude bivalves were less likely to go extinct than those inhabiting low-latitude settings (Vilhena et al. Reference Vilhena, Harris, Bergstrom, Maliska, Ward, Sidor, Strömberg and Wilson2013). If an LLHG was present in the Cretaceous, the high latitudes would include more of these slower-growing and longer-lived species than elsewhere. What impact might selective survival of slow-growing species with longer life spans and delayed sexual maturation have on recoveries? Life-history traits likely play a bigger role in patterns of survival during and recovery from mass extinctions than we realize.
Conclusions
Leonardo's astute observations that exterior lines on the shells of cockles, found high in the Italian mountains, represented the years and months of their lives paved the way from Neoplatonic or Diluvian explanations for the formation of fossils to scientific ones. In doing so, he provided perhaps one of the most fundamental revelations in the history of geology, that the Earth has a history independent of us. Life-span and growth rate data have been missing from our quest to understand how the so-called pageant of life has unfolded. Over the past few decades, sclerochronologists have developed the techniques necessary to extract this information from organisms with accretionary skeletons, with which the fossil record is rife. Uniting the techniques of sclerochronology with the evolutionary questions of paleobiology promised to “yield rich rewards” (McKinney and McNamara Reference McKinney and McNamara1991, p. 370), but these have yet to be fully realized. We hope we have made clear that this combined approach offers new avenues of research and insight into not only heterochrony, but large-scale macroevolutionary and ecological patterns in space and time over the Phanerozoic. Reuniting paleobiology and sclerochronology once again foretells the potential for a formative step forward in the study of the history of life's evolution. We can hope that this time it sticks.
Acknowledgments
We thank the participants at the International Sclerochronology Conferences since 2007 for pushing us to consider these topics further. Thoughtful conversations with B. Runnegar and J. Brower helped to refine our thinking on these issues. I. Quitmyer provided Fig. 1, B. Schone provided Mutvei staining for Fig 6C, and L. Beierlein imaged Fig. 6A. We thank L. Harper and an anonymous reviewer for astute comments that improved the article. Parts of this paper derive from outgrowths of work supported by National Science Foundation PLR-1543031 and EAR-0719645 to L.C.I. The foundation that allows for this article was laid long ago by extended interactions with S. J. Gould. We miss his voice in this conversation.


 Open access