


1. Introduction
A body entering the water often creates an air-filled cavity below the surface and a splash above. While details of the splash and cavity can vary for bodies of different shape, size, speed and surface properties, certain characteristics are ubiquitous. The richness of the physics, along with the range of applications in water entry have garnered significant research attention (Truscott, Epps & Belden Reference Truscott, Epps and Belden2014). Much of the previous work has focused on bodies with convex, flat or conical nose shapes. Here we investigate how bodies with recessed noses dramatically alter the typical cavity and splash formations by studying the vertical water entry of cylindrical cups and disks.
Nose shapes with sharp changes in curvature, such as disks (Bergmann et al. Reference Bergmann, Van Der Meer, Gekle, Van Der Bos and Lohse2009) and vertical cylinders (Duclaux et al. Reference Duclaux, Caillé, Duez, Ybert, Bocquet and Clanet2007; Bodily, Carlson & Truscott Reference Bodily, Carlson and Truscott2014), readily form splashes and cavities. In the case of sphere impact, cavity and splash features depend on the static wetting angle of the material  $\theta$, the Weber number
  $We_D = \rho D U^2 / \sigma$ and the Froude number
  $Fr = U^2/gD$, where
  $U$ is the impact velocity,
  $\rho$ the liquid density,
  $\sigma$ the surface tension,
  $g$ is gravity and
  $D$ is a length scale. For spheres,
  $D$ is the sphere diameter; for the cups in this paper,
  $D$ is the cross-sectional diameter of the body. Duez et al. (Reference Duez, Ybert, Clanet and Bocquet2007) showed that spheres impacting with sufficiently large
  $We_D$ form cavities when the splash separates from the body, with the critical value of impact velocity for cavity formation being a function of
  $\theta$. Below this velocity, they found that the splash remains attached to the sphere throughout impact, preventing the air entrainment required for cavity formation. Similar cavity phenomena have been observed for slender bodies with ellipsoidal or ogival nose shapes (May Reference May1975; Bodily et al. Reference Bodily, Carlson and Truscott2014). Speirs et al. (Reference Speirs, Mansoor, Belden and Truscott2019) later expanded this work, showing that below a certain
  $We_D$, cavities can again form because no splash is generated.
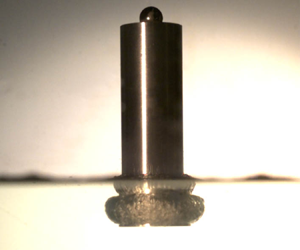
When the conditions for cavity formation are met, the cavity grows underwater drawing in air from above the surface until a sealing event closes the cavity. Cavities are typically classified into one of four regimes defined by Aristoff & Bush (Reference Aristoff and Bush2009), which are distinguished by the spatial location of the seal event. We concern ourselves here with deep seal and surface seal cavity types, which occur for a wide range of nose geometries. In a deep seal, the cavity pinches off below the surface with the above surface splash crown forming an aperture open to air. However, a surface seal closes off the cavity from the air above when the splash crown domes over on itself above the surface (Gilbarg & Anderson Reference Gilbarg and Anderson1948; May Reference May1975; Mansoor et al. Reference Mansoor, Marston, Vakarelski and Thoroddsen2014; Marston et al. Reference Marston, Truscott, Speirs, Mansoor and Thoroddsen2016; Eshraghi, Jung & Vlachos Reference Eshraghi, Jung and Vlachos2020). In the defining work of Aristoff & Bush (Reference Aristoff and Bush2009), the seal location is well removed from the spherical body for deep and surface seals. However, it is also possible that the axial extent of the body is such that the seal point lands on the body. In this case, the deep and surface closure phenomena still occur, except the sealing event is marked by contact of the cavity or splash with the body (e.g. figure 1a,b). Bodily et al. (Reference Bodily, Carlson and Truscott2014) showed this for long slender bodies (with length to diameter  $L/D = 10$) for a variety of convex and disk nose shapes. Regardless of the extent of the body, the water entry phenomena at early times (i.e. small submergence) are a function of the nose geometry and not the body length.

Figure 1. Three different regimes of cup water entry, all shown at the moment of cavity seal. (a) A cup at low impact speed produces a large cavity that ultimately closes in a deep seal on the body below the surface ( $h/D = 0.16$,
  $We_D = 689$). (b) The same cup at slightly higher speed produces an above-surface seal in which the splash rim closes on the body above the surface (
 $h/D = 0.16$,
  $We_D = 710$). (c) A deeper cup at higher impact speed produces a closed torus cavity that does not open to the atmosphere and is filled by gas that escapes from the cup (
 $h/D = 0.63$,
  $We_D = 2390$).
The axial extent of the body need not be large to get ‘on body’ seal when the impacting nose is cupped or concave. Mathai, Govardhan & Arakeri (Reference Mathai, Govardhan and Arakeri2015) showed that a concave nose can stunt cavity development, observing a gas torus that surrounds the outer circumference of the body shortly after impact, which we reproduced with our cups (figure 1c). They reported no evidence of splash formation and no clear cavity emanating from the nose. Here we vary the impact speed  $U$ and cup depth
  $h$ and find a wide range of behaviours, including many in which a splash and clear cavity are indeed formed. Using both experiments and theory, we show how the behaviour of the air initially trapped in the cup affects splash and cavity formation. Varying the initial volume of trapped gas (via cup depth) introduces a time scale for gas evacuation that has a non-monotonic dependence on
  $We_D$, which we rationalize with theory. For high
  $We_D$, cup entry phenomena are inertia dominated and we find cup depth
  $h$ to be the dominant length scale determining this gas evacuation time. For low
  $We_D$, we find the width of the cup lip to be a relevant length scale in distinguishing cavity closure phenomena as surface tension becomes important. The effect of these parameters on the resulting cavity formation, splash characteristics and cavity seal are captured in regime diagrams. A region of the regime diagram contains the closed torus case described by Mathai et al. (Reference Mathai, Govardhan and Arakeri2015), for which cavity development is suppressed. Cavity forming cases are characterized by the seal time
  $t_{cs}$, which we find to be significantly affected by
  $h$ for large
  $We_D$. We place our results in context of water impacts of cylindrical bodies with a flat disk nose shape which also trap air beneath the nose, although the volume and evacuation time scale, as described by Jain et al. (Reference Jain, Gauthier, Lohse and van der Meer2021a), are much smaller than for our cups. Thus, our results generally extend the understanding of the effect of air entrapment beneath solid bodies entering water.
2. Experimental set-up
Figure 2 shows the experimental set-up used in this study in which thin-walled cups are dropped from an electromagnet into a tank of water. The cups are made from an aluminium cylinder with length  $L = 100$ mm, cross-sectional diameter
  $D = 25.4$ mm and cup depths of
  $h = 1$, 3, 4, 8, 16 and 25.4 mm. The mass is varied between 94 and 119 g. The recessed cup is machined such that the interior walls form a thin wedge with an angle of
  $\beta \approx 10^\circ$ and the lip of the cup has radius
  $r$, which for the cups listed above are
  $r = 0.1$, 0.1, 0.09, 0.22, 0.11 and 0.07 mm. Additionally, an identical cylinder with a flat disk nose was machined and tested at each impact condition; we refer to this body as the ‘disk’ throughout the paper. A ball bearing affixed to the top of the cylinder creates a single point of contact with the electromagnet. The height of the electromagnet controls the impact velocity of the cups
  $U$, which is varied from 0.68 to 5.9 m s
 $^{-1}$, yielding a Weber number range of
  $We_D = 1.17 \times 10^2$ to
  $1.23 \times 10^4$.
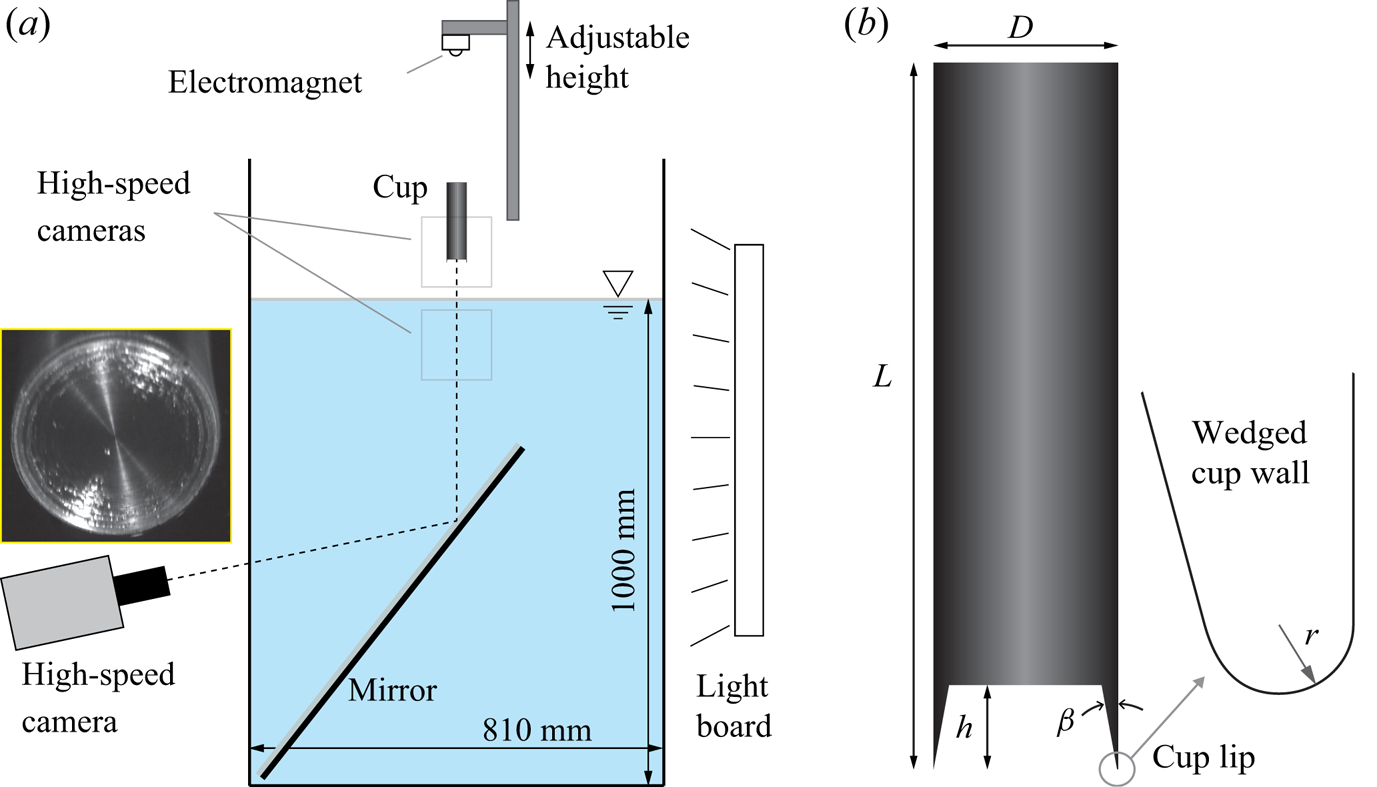
Figure 2. (a) Experimental set-up with three high-speed cameras viewing the water entry event. The inset image shows a high-speed camera viewing beneath the impact via a mirror placed in the tank. (b) Thin-walled cups are made by cutting a recess in a cylinder to depth  $h$; the thin walls of the cup form a wedge angle
  $\beta \approx 10^\circ$, and the lip of the cup has radius
  $r$.
$r$.
High-speed videos below and above the surface are used to interrogate properties of the cavity and splash, respectively, at frame rates between 4000 and 50 000 frames s $^{-1}$. From the camera images, we measure several time scales described in § 3. The experiment is designed such that the cups fall freely; therefore, the angle
  $\alpha$ between the impacting face and the water surface may be non-zero upon water impact. We measure this angle from the third high-speed camera, which is aimed at an angled mirror in the tank to enable viewing of the impact from below (sample image shown in figure 2a). The angle is measured as
  $\alpha = \sin ^{-1}(U \Delta t_{\alpha }/D)$, where
  $\Delta t_{\alpha }$ is the time difference between the moment of first contact and when the full perimeter of the cup lip comes in contact with the water. For the cup cases reported herein, the mean and standard deviation of
  $\alpha$ is
  $0.25^\circ$ and
  $\pm 0.21^\circ$, respectively, except for the data reported in Appendix A, wherein we investigate the effect of larger
  $\alpha$, up to approximately
  $1^\circ$. For the disk, we hold a tighter tolerance on
  $\alpha$, as discussed in § 5.
3. Cavity and splash behaviour
Figure 1(c) shows a phenomenon similar to that shown by Mathai et al. (Reference Mathai, Govardhan and Arakeri2015), in which a torus of gas emanates from the cup nose and no splash is apparent above the surface. However, unlike the findings of Mathai et al. (Reference Mathai, Govardhan and Arakeri2015), we find other conditions for which the cavities reopen to the air above and expand to varying degrees, before sealing on the body. These various regimes depend on the sequence of a common set of underlying phenomena, which we summarize here and then expand upon later. As the wedged cup wall impacts the free surface, water separates forming a small cavity around the cup that may imminently close on the body in a deep-seal like manner. As the cup descends, gas from inside the cup leaks out, which may or may not reopen the wedge cavity. The splash crown formed above the surface rises from the impact inertia, and is further displaced upwards by the gas escaping the cup, which inflates the cavity below the surface and pushes the free surface upwards. The splash can be observed to close on the body, reopen again and then close again as the final seal. While the above-described events generally persist across our experimental parameter space of  $We_D$ and
  $h/D$, we find a wide range in the cavity and splash behaviour. We classify these behaviours into four regimes – deep seal, above-surface seal, below-surface seal and closed torus – which are plotted in the diagrams shown in figure 3. Representative cases of each regime are shown in figures 4 and 5, and see supplementary movies 1–5 available at https://doi.org/10.1017/jfm.2023.330.

Figure 3. (a) Cavity and splash regimes for the water entry of cups over a range of  $h/D$ and
  $We_D$. The closed torus boundary is predicted by the model in § 4.2. (b) Rescaling the data with
  $We_r$ aligns the transitions between the low-Weber deep seal and above-surface seal regimes across cup depths.

Figure 4. Image sequences of low- $We_D$ cup water entry behaviour. (a) In the deep seal regime, the cavity closes on the body beneath the water surface and no splash sheet is formed (
 $h/D = 0.04$,
  $We_D = 151$). (b) In the above-surface seal regime, a splash sheet is formed and the cavity is sealed when the kink between the rim and sheet pinches in on the body above the surface at time
  $t = 32.5$ ms (
 $h/D = 0.16$,
  $We_D = 1016$; inset shows above surface camera view). These cases are shown in supplementary movies 1 and 2. (c) A below-surface camera view reveals the cup gas behaviour that is typical of low-
 $We_D$ impacts (
 $h/D = 0.12$,
  $We_D = 562$). The internal gas–liquid interface moves up, compressing the gas in the cup and forming a meniscus at the cup lip (
 $t = 2.14$ ms). The interface then de-wets on the inside face of the cup (
 $t = 3.46$ ms), the contact line retracts to the inner walls (
 $t = 3.46\unicode{x2013}5.84$ ms) and then recedes to the cup lip (
 $t = 6.64$ ms), thus completing the gas evacuation process (see also supplementary movie 6).

Figure 5. Image sequences and schematics of high  $We_D$ cup water entry regimes. (a) In the above-surface seal regime, escaping gas reopens the wedge cavity and drives the splash sheet and a high-speed spray up from the surface (red arrows). The splash rim seals on the body, and then the water flow recirculates around the toroidal cavity (blue arrows), pulling flow down along the body (
 $h/D = 0.16$,
  $We_D = 2808$). (b) For a below-surface seal, the gas escapes late relative to the entry time and barely reopens the wedge cavity to the atmosphere (
 $h/D = 0.32$,
  $We = 2852$). (c) In the closed torus regime, the gas escapes from the cup so late that the cavity never reopens to the air above (
 $h/D = 0.63$,
  $We = 5806$). The wedge seal time, gas escape time and cavity seal time are denoted as
  $t_w$,
  $t_e$ and
  $t_{cs}$, respectively. These cases are shown in supplementary movies 3–5.
At the lowest speeds with  $We_D \approx 100\unicode{x2013}600$, a large cavity is formed and fed by the air above the surface until ultimately closing on the body well below the surface in a deep seal type event (e.g. figure 4a,
  $h/D = 0.04$,
  $We_D = 151$; supplementary movie 1). The cavity remains open to air prior to this deep seal and a short, thick rim dominated by surface tension is formed upon water impact. Gas from inside the cup escapes into the growing cavity, but we find no evidence that the escaping gas has a significant effect on the rim or cavity development in the deep seal regime, as it does in other regimes. The rim lacks sufficient inertia to form the thin ejecta film known as the splash crown, and never seals on the body. This lack of the thin ejecta film is expected for low
  $We_D$ as Speirs et al. (Reference Speirs, Mansoor, Belden and Truscott2019) observed the same for sphere water entry below a critical Weber number of
  $We_D \approx 240$.
Traversing up and right on the regime diagram of figure 3(a), we find the above-surface seal behaviour shown in figure 4(b) ( $h/D = 0.16$,
  $We_D = 1016$; supplementary movie 2). The higher inertia forms a thinner ejecta sheet which has the hallmark rim and crown (
 $t = 10.3$ ms) (Yarin Reference Yarin2006; Zhang et al. Reference Zhang, Toole, Fezzaa and Deegan2012). The rim initially moves up and radially outwards before beginning to move radially inwards at
  $t \approx 20$ ms. Meanwhile, the expanding cavity (from inflowing air and gas escaping from the cup) pushes up the free surface, forming a region of sharp curvature between the ejecta sheet and the rim (
 $t = 27.3$ ms). This kinked region then moves rapidly in towards the body, sealing at
  $t = 32.5$ ms. The phenomenon of the splash rim drawing radially inwards occurs for surface seal events in sphere water entry (Gilbarg & Anderson Reference Gilbarg and Anderson1948; Marston et al. Reference Marston, Truscott, Speirs, Mansoor and Thoroddsen2016; Eshraghi et al. Reference Eshraghi, Jung and Vlachos2020), where surface tension forces and an air-flow-induced pressure difference across the sheet pull the rim inwards. Herein, the rim closes on the body, sealing the cavity from further expansion.
The internal cup gas behaviour that is characteristic of lower  $We_D$ impacts is shown in figure 4(c) (
 $h/D = 0.12$,
  $We_D = 562$). Upon impact, the wedge cavity is seen forming around the outside of the cup (
 $t = 0.3$ ms). The internal gas–liquid interface moves up relative to the leading edge, compressing the cup gas and forming a meniscus at the lip (
 $t = 2.14$ ms). Gas begins escaping from the cup in a thin axisymmetric film, as evidenced by waves emanating from the cup lip (supplementary movie 6). The interface then de-wets on the inside face of the cup (
 $t = 3.46$ ms), the contact line retracts to the inner walls (
 $t = 3.46\unicode{x2013}5.84$ ms) and then recedes to the cup lip (
 $t = 6.64$ ms), thus completing the gas evacuation process.
Increasing  $We_D$ for the same cup depth, as shown in figure 4(b), yields the behaviour shown in figure 5(a) (
 $h/D = 0.16$,
  $We_D = 2808$; supplementary movie 3). This case still falls in the above-surface seal regime, but the seal time on the body is an order of magnitude faster than the case shown in figure 4(b). At this higher impact speed, the gas evacuation from the cup becomes much more evident in the roughening of the cavity interface (
 $t = 0.95$ ms); gas first begins escaping the cup at the escape time
  $t_e = 0.3$ ms, which is after the wedge seal has occurred. The escape time
  $t_e$ is determined from high-speed images from the below water camera, and is evidenced by waves emanating from the cup lip and a subsequent rapid expansion of the cavity. As the gas evacuates, it drives the wedge seal contact line up and away from the body, ejecting a thin liquid sheet and high-speed spray upwards (indicated by arrows at
  $t = 0.95\unicode{x2013}2.3$ ms). Next, the thin sheet contacts the body and quickly ruptures, reopening the cavity to the air above (
 $t = 0.95$ ms). In contrast to the lower
  $We_D$ case, the splash rim diameter is smaller and does not deviate as far radially outwards from the body (
 $t = 2.3$ ms). The inflating cavity again deforms the splash sheet by pushing up the free surface and the rim seals on the body at
  $t_{cs} = 4.35$ ms. This is the third and final time that the cavity seals (wedge seal, thin sheet seal and splash rim seal), but this time it does not reopen. After sealing, as the cavity pulls away from the surface, the liquid flow recirculates around the toroidal cavity, resulting in a depression of the free surface (
 $t = 8.75$ ms). Evidently, the combination of body inertia and gas flow have a significant effect on the splash development and cavity seal in this regime.
Keeping  $We_D$ constant and increasing the cup depth to
  $h/D = 0.32$ yields the regime we call below-surface seal shown in figure 5(b) (
 $h/D = 0.32$,
  $We = 2852$; supplementary movie 4). The wedge cavity seal is more obvious in this case (
 $t_{w} = 0.65$ ms). Furthermore, the time scale for gas escape (
 $t_e = 0.8$ ms) is longer than in the case shown in figure 5(a). While the cavity does reopen to air above, as evidenced by ejected spray (red arrow at
  $t = 1.45$ ms), the recirculating flow around the gas toroid acts quickly to reseal the cavity on the body below the surface and above the toroid (blue arrows in figure 5b). As a result, the final sealed cavity volume is much smaller than for previous regimes, despite having a larger initial volume of gas trapped in the cup.
Finally, in the upper right portion of the regime diagram (figure 3a), we find the closed torus behaviour shown in figure 5(c) ( $h/D = 0.63$,
  $We = 5806$). A very pronounced wedge cavity forms upon impact, seals on the body (
 $t_w= 1.4$ ms) and pulls away from the surface, all before gas begins evacuating from the cup at
  $t_e= 1.9$ ms. Here, the gas begins escaping the cup through irregular bubbles before evacuating axisymmetrically around the cup lip (
 $t = 2.75$ ms). By the time the gas begins to escape, the cup has already submerged to the point where the cavity never reopens to the air above. As the cup continues to descend, a depression in the surface gets pulled down along the body, but does not reconnect to the toroidal cavity (
 $t = 4.7$ ms; see also supplementary movie 5). Thus, the only and final cavity seal occurs at the moment of wedge cavity closure. In this regime, the entire contents of the toroidal cavity are the gas initially trapped in the cup and the air entrained into the wedge cavity. It is also worth noting that the closed torus case shown in Mathai et al. (Reference Mathai, Govardhan and Arakeri2015) for a concave hemispherical nose has parameters (
 $We_D = 2.81 \times 10^4$ and
  $h/D = 0.67$) that place it in the closed torus regime on our regime diagram (figure 3a). In contrast to the two intermediate regimes, for which a splash rim and sheet are prominent features, no discernible splash sheet is observed in the closed torus regime. Positing that the dominate splash formation mechanism for closed torus cases is the water entry of the wedged cup walls, we suggest computing the Weber number with the cup lip radius
  $r$,
$r$,  $We_r = \rho r U^2 / \sigma$. Calculating this for the closed torus cases gives the range
  $We_r \approx 10\unicode{x2013}200$, where we might reasonably expect surface tension to significantly affect the splash development (or lack thereof, Speirs et al. Reference Speirs, Mansoor, Belden and Truscott2019). Furthermore, our
  $h/D = 0.32$ cup was machined with
  $r$ approximately two times larger than the other cups. Rescaling with
  $We_r$ aligns the transition between the low-
 $We_D$ deep seal and above-surface seal regimes on the diagram (figure 3b).
The closed torus cases are further evidence that the evacuation of gas from the cup is the driving factor in the splash and cavity dynamics for regimes in which the cavity is reopened to the air above the surface. The experimental observations show the timing of gas escape to be crucial in determining if the cavity reopens or not. We thus turn our attention to modelling the trapped gas dynamics.
4. Cup gas behaviour
4.1. Gas escape time
We define the gas escape time  $t_e$ as the time from initial water impact to the first moment that gas begins to evacuate from the cup. Figure 6(a) shows experimental measurements of
  $t_e$ as a function of
  $We_D$ for each cup depth. The data show a non-monotonic dependence on
  $We_D$, with the escape time initially decreasing with increasing Weber number, before eventually beginning to increase as
  $We_D$ increases. The critical
  $We_D$ at which this trend change occurs is different for each cup depth. These diverging trends motivate different model constructs to capture the behaviour in each limit.

Figure 6. (a) Gas escape time  $t_e$ as a function of
  $We_D$. The separate colour curves come from the high-
 $We_D$ model in § 4.2. The black curve,
  $t_e \propto We_D^{-1/2}$, comes from the low-
 $We_D$ scaling analysis of § 4.3 with
  $\kappa _{l} = 1.1(10^{-3})$. (b) Normalizing the escape time as
  $t_e U/h$ compresses the behaviour at high
  $We_D$ towards a single curve. The experimental data for each cup intersect this curve at different values of
  $We_D$, and then follow the collapsed model predictions. (c) The intersection between the low- and high-
 $We_D$ model predictions occurs at
  $We_{D_{crit}} \propto (h/D)^{-1}$ (the proportionality constant for the curve on the plot is 190). (d) The total time required to finish evacuating all cup gas
  $t_f$ scales linearly with
  $h/U$; the line passing through data points is
  $t = 3h/U$. For all plots, symbol colour indicates cup depth as shown in the legend in panel (a) and symbol shape indicates the cavity regime as indicated by the legend in panel (b).
4.2. High- $We_D$ limit

In the limit of high  $We_D$, where inertia dominates surface tension, we suggest the idealized model depicted in figure 7(a). For high-
 $We_D$ water impacts in general, the dominant force on the body during early times stems from the rate of change of added fluid momentum (Truscott et al. Reference Truscott, Epps and Belden2014). This added mass force
  $F_{m}$ arises from the growing volume of liquid in the pool that must be accelerated from rest during early time after impact, and may be expressed as
 \begin{equation} F_{m} =-\frac{{\rm d}}{{\rm d}t}(m_a U_m ), \end{equation}
where  $U_m$ is the instantaneous velocity of the added fluid mass, and
  $m_a$ the added mass, which is a function of body geometry (Shiffman & Spencer Reference Shiffman and Spencer1945). For water entry problems, in which the geometry that has penetrated the surface is a function of time, the added mass is also a function of time, increasing from
  $m_a = 0$ just before impact to some maximum value at a later time. For cup impacts, we similarly expect the development of a transient added mass, which is driven by the motion of the body and the internal gas–liquid interface inside the cup.

Figure 7. (a) High- $We_D$ limit model as described in § 4.2. The internal gas–liquid interface is assumed to have no curvature, which approximates the experimental behaviours seen at large
  $We_D$. We model the system as a two-body problem: one being the cup and the second the added fluid mass, which varies in time
  $m_a(t)$. (b) At low
  $We_D$, the model assumes a meniscus at the cup wall, characterized by radius
  $l$ and Laplace pressure
  $P_{\sigma } = \sigma /l$. (c) Idealized model of the difference between the below-surface seal and closed torus regimes. If the cup has submerged beyond
  $z_{crit}$, then we expect that the gas torus will not reconnect to the free surface (i.e. closed torus regime).
Our model extends that of Bagnold (Reference Bagnold1939), who considered the compression of a gas by a liquid column inside a fixed cylinder. As depicted in figure 7(a), the internal gas–liquid interface is assumed to have no curvature and oscillates relative to the inside face of the cup through a displacement  $x(t)$. Experimental observations at high
  $We_D$ support this oscillatory model assumption during the initial gas compression phase (see supplementary movie 7). The position of the bottom of the cup relative to the nominal free surface is defined by
  $z(t)$. Neglecting drag on the cup lip, a force balance on the cup yields the equation of motion,
 \begin{equation} \ddot{z} = \frac{{\rm \pi} R^2}{m}(P_{o}-P_g) + g, \end{equation}
where  $m$ is the cup mass,
  $P_{o}$ the ambient (atmospheric) pressure and
  $P_{g}$ the time-varying gas pressure in the cup. Assuming that the gas in the cup undergoes an adiabatic process such that
  $PV^{\gamma }$ is constant, then the gas pressure in the cup can be written as
  $P_g = P_{o} h^\gamma x^{-\gamma }$, where
  $\gamma = 1.4$ is the adiabatic index for air. Substituting into (4.2) yields
 \begin{equation} \ddot{z} = \frac{{\rm \pi} R^2}{m} P_{o} (1 - h^\gamma x^{-\gamma}) + g. \end{equation}
 We next seek an equation of motion for the added fluid mass  $m_a(t)$, which is assumed to move at uniform velocity
  $U_m(t) = \dot {z} + \dot {x}$. The rate of change of added fluid momentum is given by the force balance,
 \begin{equation} \frac{{\rm d}}{{\rm d}t}(m_a U_m) = P_g{\rm \pi} R^2 - \int_S P_m \,{\rm d}S, \end{equation}
where  $S$ is the lower bounding surface of the added mass and
  $P_m$ is the pressure on that surface (see figure 7a). As the depth
  $z_m$ is small, we approximate
  $P_m \approx P_{o}$. Furthermore, though we do not know the exact geometry of surface
  $S$, we make the approximation
  $\int _S {\rm d}S \approx {\rm \pi}R^2$. Applying these assumptions and expanding the left-hand side of (4.4) yields
 \begin{equation} m_a(\ddot{z} + \ddot{x} ) + \frac{{\rm d}m_a}{{\rm d}t}(\dot{z} + \dot{x} ) = {\rm \pi}R^2 P_{o} (h^\gamma x^{-\gamma} - 1 ). \end{equation}
A first-order approximation for  $m_a(t)$ is made by assuming a linear variation in time from
  $m_a(t=0) = 0$ to
  $m_a$ of a disk at some time
  $t_m$; that is,
  $m_a(t_m) = \frac {4}{3}\rho R^3$ (Jain, Vega-Martínez & Van Der Meer Reference Jain, Vega-Martínez and Van Der Meer2021b). As added mass is typically a function of normalized body submergence
  $Ut/R$, we assume
  $t_m \propto R/U = R/\kappa _m U$, where
  $\kappa _m$ is a constant to be determined. Finally, we can write
 \begin{equation} \frac{{\rm d}m_a}{{\rm d}t} = \kappa_m \frac{4}{3}\rho R^2 U \end{equation}
and
 \begin{equation} m_a = \kappa_m \frac{4}{3}\rho R^2 U t. \end{equation}
Inserting (4.6) and (4.7) into (4.5) and solving for  $\ddot {x}$ gives
 \begin{equation} \ddot{x} =-\ddot{z} - \frac{1}{t}(\dot{z} + \dot{x} ) +\frac{1}{t} \frac{3{\rm \pi} P_{o}}{4 \kappa_m \rho U} (h^\gamma x^{-\gamma} - 1). \end{equation}
 The governing equations of motion (4.3) and (4.8) can be solved numerically to predict the time-varying motion of the gas-liquid interface inside the cup, with initial conditions:  $z(t_0) = 0$,
  $\dot {z}(t_0) = U$,
  $x(t_0) = h$,
  $\dot {x}(t_0) = -U$. To avoid the singularity in (4.8) at
  $t = 0$, we begin the numerical integration at time
  $t_0 = 10^{-6}$ s, which is much smaller than the measured gas escape times. The model captures an oscillatory behaviour in which the cup gas compresses and then expands with decaying amplitude. Guided by observation, we assume the gas begins to leak out of the cup at the end of the first compression–expansion cycle. The period of this first cycle thus gives a prediction of the escape time
  $t_e$. A representative example of the predicted interface motion is shown in Appendix A.1.
The escape time  $t_e$ is computed using the above model for a range of
  $h/D$ and
  $We_D$. The predictions of
  $t_e$ against
  $We_D$ in figure 6(a) (coloured lines) show good agreement with the experiments in the high-Weber limit, predicting both the rate of increase with
  $We_D$ as well as the dependence on cup depth. We found the value of
  $\kappa _m = 0.8$ to give the best fit of the model to the data. Furthermore, when the escape time is normalized as
  $t_eU/h$, the model predictions collapse to a single curve (figure 6b). The experimental data for each cup intersect this curve at different values of
  $We_D$ and then follow the collapsed model predictions. Prior to intersecting the common curves,
  $t_eU/h$ is roughly constant for each cup, which is consistent with the
  $t_e \sim We_D^{-1/2}$ trend in figure 6(a). The increase in escape time with increasing
  $We_D$ is associated with a larger excursion of the interface, which then takes more time to expand back towards the cup lip. The collapse found with the scaling of
  $t_eU/h$ indicates that the gas escape process is dominated by inertia above the cup-depth-dependent critical
  $We_D$ numbers.
4.3. Low-$We_D$ limit

As  $We_D$ decreases, we expect that surface tension becomes increasingly important in the gas escape mechanism. High-speed video, such as that shown in figure 4(c) and supplementary movie 6, shows that the internal surface does not tend to oscillate at low
  $We_D$, rather it forms a meniscus at the cup wall, compresses the gas progressively and then de-wets from the cup centreline outwards. We hypothesize that the gas escape proceeds as shown in figure 7(b): as
  $P_g$ increases the meniscus deforms, acquiring local radius
  $l$. The contact line will begin to move when the internal gas pressure overcomes the Laplace pressure plus the local hydrostatic pressure, i.e. when
 \begin{equation} P_g > \frac{\sigma}{l} + P_o. \end{equation}
To estimate how the escape time scales at low  $We_D$, we linearize
  $P_g = P_{o} h^\gamma x^{-\gamma }$ using a Taylor series expansion about
  $x = h$, giving
 \begin{align} P_g &\approx P_g\vert_{x=h} + \left.\frac{\partial P_g}{\partial x}\right\vert_{x=h}(x-h) \nonumber\\ &\approx P_o - \gamma P_o h^{\gamma} x^{-\gamma-1}\vert_{x=h}(x-h) \nonumber\\ &\approx P_o\left[ 1 - \gamma \left(\frac{x}{h}-1 \right) \right]. \end{align}
Making the approximation  $x \approx h-Ut$ and applying to (4.10) yields
 \begin{equation} P_g \approx P_o\left( 1 + \gamma \frac{Ut}{h} \right). \end{equation}
Inserting this expression into (4.9) and solving for the corresponding escape time gives
 \begin{equation} t_e \approx \frac{h}{l} \frac{\sigma}{\gamma P_o U}. \end{equation}
Figure 6 shows that when following the low- $We_D$ trend, the escape time data are not a function of
  $h$. Therefore, we conclude that
  $l = \kappa _{l} h \propto h$, where
  $\kappa _{l}$ is an empirical constant, and rewrite (4.12) as
 \begin{equation} t_e \approx \frac{1}{\kappa_{l}} \frac{\sigma}{\gamma P_o U}. \end{equation}
The black line in figure 6(a) shows  $t_e$ from (4.13) with
  $\kappa _{l} = 1.1(10^{-3})$. This predicted trend of
  $t_e$ shows good agreement with the low-
 $We_D$ data for each cup. We also plot
  $t_e$ versus
  $U$ for only the low-
 $We_D$ data in figure 13 of Appendix A, which highlights the weak dependence of
  $t_e$ on
  $h$ for a given speed.
The experimental data and our scaling analysis reveal that at low  $We_D$, surface tension plays a significant role in the gas escape process, forming a meniscus as the gas–water interface deforms upon impact. Increasing impact inertia leads to reduced escape time, presumably by compressing the captured gas more quickly. At a critical Weber number
  $We_{D_{crit}}$, this trend reverses and
  $t_e$ increases with increasing
  $We_D$. The data show that
  $We_{D_{crit}}$ is dependent on the cup depth. By finding the intersection points between the inertial model (Section 4.2) and the low-
 $We_D$ scaling analysis, we find that
  $We_{D_{crit}} \propto (h/D)^{-1}$ as shown in figure 6(c).
4.4. Closed torus regime
Using our inertial model (§ 4.2), we can rationalize the boundary between open cavity cases and the closed torus regime on the regime diagram of figure 3(a). As the schematics and images of figure 5(b,c) show, the boundary hinges on whether the inflated toroid pushes the wedge seal contact line above the surface and away from the body. A simplified model of this behaviour, shown in figure 7(c), is used to predict this regime boundary. We first assume that all of the gas initially trapped inside the cup evacuates into a torus with cross-sectional radius  $r_t$ and inner radius
  $R_t = r_t + {D}/{2}$. Note that in reality, the gas evacuation proceeds periodically over a number of cycles stemming from oscillations of the internal free surface. Nonetheless, observations show that the majority of the gas is evacuated in the first oscillation period. Equating the cup volume to torus volume gives
  $r_t^2 ( r_t + {D}/{2} ) = {D^2 h}/{8 {\rm \pi}}$, which can be solved numerically for
  $r_t$. For the cavity to remain sealed from air above as in the closed torus regime, we suggest that the cup must descend below a critical depth
  $z_{crit} = 2r_t$ such that the top of the torus is below the undisturbed free surface. Assuming constant speed over this descent yields a critical time scale
  $t_{crit} = 2r_t/U$. The time taken to inflate the gas torus must be longer than this critical time scale to observe the closed torus behaviour. Symbolically,
  $t_e + \tau > 2r_t/U$, where
  $t_e$ is the escape time predicted by our inertial model and
  $\tau$ is the time required to inflate the torus after time
  $t_e$. Because the closed torus regime occurs for large
  $We_D$, the gas evacuation process should be dominated by inertia and it is thus assumed that
  $\tau = \kappa h/U$ (where
  $\kappa$ is a constant). We find that the time required for all of the gas to finish evacuating follows this scaling,
  $t_f \propto h/U$ (see figure 6d), and thus expect the same scaling to hold for
  $\tau$. The closed torus boundary curve plotted on figure 3(a) follows from conditions that satisfy
 \begin{equation} t_e + \kappa \frac{h}{U} = \frac{2r_t}{U}, \end{equation}
where  $\kappa = 0.4$ is found empirically (see Appendix A.1 for details). Thus, our inertial model of the cup gas dynamics, coupled with an empirically motivated torus formation time predicts the boundary between the closed torus behaviour and the regimes in which the cavity reopens to air above the surface.
5. Disk water impact
We aim now to place the cup behaviour in the context of a canonical geometry by studying an identical cylindrical body, but with a flat disk nose ( $h/D = 0$). Similar to cups, disks have also been shown to trap an air layer on the nose due to the deformation of the pool surface caused by the approach of the disk (Jain et al. Reference Jain, Vega-Martínez and Van Der Meer2021b). Yet, as disks do not have the wedge-shaped walls to contain this air layer, we find that the splash and cavity behaviour of disk impact is highly sensitive to the inclination angle of the face,
  $\alpha$, relative to the flat free surface. Typically, past studies on the vertical water entry of disks have either actively enforced that the disk face impacts truly flat to the surface (Peters, van der Meer & Gordillo Reference Peters, van der Meer and Gordillo2013; Jain et al. Reference Jain, Gauthier, Lohse and van der Meer2021a,Reference Jain, Vega-Martínez and Van Der Meerb) or have explicitly varied the inclination angle, but for values of
  $\alpha \ge 2^{\circ }$ (Bodily et al. Reference Bodily, Carlson and Truscott2014; Sun et al. Reference Sun, Shi, Zhang, Zong and Wang2021). Herein, we find that deviations of angle within the range
  $0^{\circ } < \alpha \lesssim 1^{\circ }$ are sufficient to change the time at which the splash seals on the body by an order of magnitude. This time, known as the cavity seal (or surface seal) time
  $t_{cs}$, is plotted in figure 8(a) against
  $We_D$ for a range of
  $0^{\circ } < \alpha \lesssim 1^{\circ }$, for our disks. Figure 8(b) shows a corresponding regime diagram for the cavity closure type. At low
  $We_D \approx 100$, the cavity closes in a deep seal in the same manner as for the cups. As
  $We_D$ increases, the seal time and regime both become sensitive to
  $\alpha$. This is particularly evident for
  $We_D \approx 100\unicode{x2013}400$, where a deviation in
  $\alpha$ from
  $\approx 0.1^{\circ } \rightarrow 0.5^{\circ }$ can change the regime from above-surface seal to deep seal. Even if a difference in angle does not cause a regime change, it may still significantly affect the seal time and resulting cavity volume. The inset images in figure 8(a) show the cavities shortly after
  $t_{cs}$ for two above-surface seal cases at the same
  $We_D$. The difference in angle (
 $\alpha = 0.145^{\circ }$ versus
  $\alpha = 0.44^{\circ }$) increases the seal time from
  $t_{cs} = 2.64$ to
  $15.68$ ms.

Figure 8. (a) Cavity seal time as a function of  $We_D$ for disk impacts at different angles of attack (
 $0^{\circ } < \alpha < 1^{\circ }$). The inset images show the difference in cavity size between a case with
  $\alpha = 0.145^{\circ }$ and
  $\alpha = 0.44^{\circ }$ (both at
  $We_D \approx 900)$. (b) A diagram of
  $\alpha$ versus
  $We_D$ shows how sensitive the regimes are to angle for disks. (c) Splash development and seal for disk impact with
  $\alpha = 0.145^{\circ }$ (top) and
  $\alpha = 0.44^{\circ }$ (bottom). (d) Below-surface views showing the breakdown of the entrapped air for disk impact with
  $\alpha = 0.145^{\circ }$ (top) and
  $\alpha = 0.44^{\circ }$ (bottom). The yellow arrow points out asymmetric wetting on the disk face. These two cases are shown in supplementary movies 8 and 9. The cases shown in panels (c) and (d) correspond to the inset images in panel (a).
Figure 8(c) shows the corresponding splash development for these two cases. For the nearly flat impact ( $\alpha = 0.145^{\circ }$), the splash rim is symmetric (
 $t = 0.6$ ms), does not deviate far from the body radially (
 $t = 1.36\unicode{x2013}2.04$ ms) and closes in on the body within a few milliseconds (
 $t = 2.64$ ms). For the inclined impact (
 $\alpha = 0.44^{\circ }$), an asymmetric splash forms upon impact (
 $t = 0.68\unicode{x2013}2.2$ ms), the splash spreads farther radially than the flat impact (
 $t = 3.64$ ms) and the seal time is an order of magnitude longer (
 $t = 15.68$ ms). As a result, the size of the air cavity pulled under the surface is much larger (inset images in figure 8a). The images from the camera looking at the underside of the disk provide more insight into the differences between these two cases (figure 8d and supplementary movies 8 and 9). For flatter impact (
 $\alpha = 0.145^{\circ }$), we see the trapped gas layer expected with disk impact (
 $t = 0.04$ ms) (Jain et al. Reference Jain, Gauthier, Lohse and van der Meer2021a). The layer breaks down as water contacts the impacting face in concentric rings (
 $t = 0.12\unicode{x2013}0.56$ ms), leaving a shrinking air pocket in the middle of the face (
 $t = 0.36\unicode{x2013}1.52$ ms). For the inclined impact (
 $\alpha = 0.44^{\circ }$), the air layer mostly evacuates from beneath the impacting face prior to the face fully submerging. The air does not evacuate symmetrically (as indicated by the asymmetric wetting shown at
  $t = 0.12$ ms), rather it escapes beneath the inclined edge of the face. The escaping air then drives the asymmetric splash formation seen in the bottom sequence of figure 8(c). Any remaining air trapped beneath the disk collapses into small bubbles, rather than the contiguous pocket or rings of the smaller angle impact. Thus, an experimental deviation in
  $\alpha$ that one might intuitively have considered to be within ‘measurement uncertainty’ is indeed large enough to drastically change the splash and cavity behaviour for disk water impacts. We find that the angle has a similar, but less pronounced effect on cups (see Appendix A, figure 14). In the following section, we consider data from disk impacts for which the mean and standard deviation of
  $\alpha$ is
  $0.21^\circ$ and
  $\pm 0.11^\circ$, respectively, for which we see the greatest similarity between disk and cup impact.
6. Cavity seal
The cavity seal is an important and well-documented phenomenon in water entry generally (Truscott et al. Reference Truscott, Epps and Belden2014). The time of the cavity seal  $t_{cs}$ marks the end of the process of cavity expansion as fed by the atmosphere above the free surface. As we have shown, this process contributes to the variety of regimes observed for cup impact. Figure 9(a) plots the dimensional cavity seal time
  $t_{cs}$ for all cups as well as the disk; the cavity seal regimes are indicated by the marker shapes. The deep seal closure times are not affected by cup depth, nor are they sensitive to
  $We_D$. Plotting the normalized time
  $t_{cs}U/D$ against
  $Fr = U^2/gD$ for deep seal only (figure 9b) yields the same dependence of
  $t_{cs}U/D \propto Fr^{1/2}$ as for sphere water entry deep seal (Duclaux et al. Reference Duclaux, Caillé, Duez, Ybert, Bocquet and Clanet2007; Aristoff & Bush Reference Aristoff and Bush2009). On the other extreme, the cavity seal time for closed torus cases is nearly two orders of magnitude faster than for deep seal (circle markers on figure 9a). The seal time in the closed torus regime is the time at which the wedge cavity seals, since the cavity does not reopen thereafter. Hypothesizing that the wedge seal is also a gravity-driven phenomenon, we plot
  $t_{w}U/r$ against
  $Fr_r = U^2/gr$ in figure 9(c). These data represent wedge seal times for all cases in which we have sufficient temporal and spatial resolution to identify the wedge seal (i.e. not just for closed torus events). The wedge seal event is indeed governed by gravity, and the data reveal a trend of
  $t_{w}U/r \propto Fr_r$.

Figure 9. Cavity seal time for cups and disks. (a) Seal time is constant for deep seal cases (outlined by dashed box) and then decreases with increasing  $We_D$ for other regimes. Seal time is consistently longer for cups than for disks, except for the closed torus regime. (b) In the deep seal regime, all bodies follow the scaling
  $t_{cs}U/D \propto Fr^{1/2}$, with the constant of proportionality equal to 1.5. (c) The wedge seal time scales with Froude,
  $t_{w}U/r \propto Fr_r$, where we use
  $r$ as the length scale for normalization (proportionality constant on plot equals
  $3 \times 10^{-3}$.) (d) Re-scaling the data against
  $We_r$ aligns the transition between deep seal and above-surface seal at
  $We_r \approx 2$. (e) Normalizing the seal time, we find that
  $t_{cs}U/D$ is constant for disks (
 $h/D = 0$) and
  $t_{cs}U/D \propto We_r^{1/2}$ as cup depth increases, for above-surface seal cases. The cases in the grey rectangle are discussed in figure 10. Marker colour indicates
  $h/D$, per the legend in panel (a). Marker shape indicates seal regime, per the legend in panel (d).
As the cup regimes transition from deep seal to above-surface seal, the cavity seal times initially become very sensitive to  $We_D$ before plateauing as
  $We_D$ increases (figure 9a). While the trends in the seal time curves are similar for all cup depths, the regime transitions from deep seal to above-surface seal occur at different values of
  $We_D$. By rescaling the data using
  $We_r$, we find that the transitions between these regimes align at
  $We_r \approx 2$, as shown in figure 9(d), which is consistent with the regime diagram in figure 3(b). The
  $h/D = 0$ data have also been rescaled using a length scale of 115
  $\mathrm {\mu }$m, which is of the order of the thickness of the trapped air layer for disk impacts as reported by Jain et al. (Reference Jain, Gauthier, Lohse and van der Meer2021a). Whether the thickness of the trapped air layer or instead the machining radius on the edge of the cylinder is a more relevant length scale is not clear and is not pursued here.
Normalizing the seal time, we find that  $t_{cs}U/D$ is constant for the disk impacts in the above-surface seal regime (figure 9e). For sphere water entry in the same
  $We_D$ range (
 $2\times 10^3-3\times 10^4$), Gilbarg & Anderson (Reference Gilbarg and Anderson1948) and Kiyama et al. (Reference Kiyama, Rabbi, Speirs, Belden, Tagawa and Truscott2022) also found that
  $t_{cs}U/D$ is constant. Eshraghi et al. (Reference Eshraghi, Jung and Vlachos2020) rationalized this behaviour for spheres with a scaling analysis that balanced the radial splash rim inertia with the Bernoulli-induced pressure difference across the splash curtain that drives it to seal. We can conclude that the same phenomena are governing the cavity seal for disk impacts with
  $We_D \gtrsim 10^3$ (
 $We_r \gtrsim 3$) herein.
The dependence of above-surface seal time on cup depth becomes apparent for  $We_r \gtrsim 3$. In the normalized plot of figure 9(e) as
  $h/D$ increases, the seal time for cups follows the trend
  $t_{cs}U/D \propto We_r^{1/2}$. Thus, for the cases that follow this trend,
  $t_{cs} \neq f(U)$. However, the shallowest cup with
  $h/D = 0.04$ appears to follow a trend in between
  $t_{cs}U/D$ is constant and
  $t_{cs}U/D \propto We_r^{1/2}$. Furthermore, we observe that for different cups at the same impact speed (such as those highlighted by the grey box in figure 9e), as cup depth increases from
  $h/D = 0 \rightarrow 0.16$, cavity seal time
  $t_{cs}$ also increases (as does
  $t_{cs}U/D$).
To better understand these observed differences in above-surface seal time between the different cups and the disk, we look further at the splash dynamics. Figure 10(a–d) show traces of the exterior surface of the splash over time for four of the cases highlighted by the grey box in figure 9(e) ( $h/D = 0$,
  $0.04$,
  $0.12$,
  $0.16$), which all have approximately the same Weber number (
 $We_D \approx 3000$,
  $We_r \approx 10$). The splash traces are coloured by
  $tU/D$, revealing that the splash for the disks rises up and closes in on the body more rapidly than for the cups. With increasing cup depth, the splash rises slower. The angle of the splash curtain
  $\gamma$ also becomes shallower with increasing cup depth. This is due to the increased volume of escaping gas from the cup, which inflates the cavity below the free surface thereby displacing it upwards. The general features of the splash are consistent among the different impacting noses, and are characterized by a rim with radius
  $a$ that sits atop an elongating sheet that meets the splash curtain at the point
  $c$ (figure 10e). Point
  $c$ is the first location on the splash to contact the body, and we plot its radial location over time for all four splashes in figure 10(f). The rim follows a roughly parabolic profile for the disk, but the trajectories for the cup cases are all broadened in time.

Figure 10. Radial ( $R_s$) and vertical (
 $Z_s$) position of the splash over time for: (a)
  $h/D = 0$,
  $We_D = 2973$; (b)
  $h/D = 0.04$,
  $We_D = 2863$; (c)
  $h/D = 0.12$,
  $We_D = 3035$; and (d)
  $h/D = 0.16$,
  $We_D = 2913$. Splash contours are coloured by normalized time,
  $tU/D$. (e) Schematic of the two sources of gas flow into the cavity: from the cup (
 $Q_c$) and from the atmosphere (
 $Q_g$). The inset shows the definition of the splash rim with radius
  $a$ and splash curtain with thickness
  $w$. The rim meets the splash curtain at point
  $c$, which is plotted with ‘x-markers’ on the plots in panels (a–d). (f) Radial position of point
  $c$,
$c$,  $R_c$, for the cases shown in panels (a–d). (g) Cavity volume over time,
  $V_{cav}/V_{cyl}$, where
  $V_{cyl}$ is the total test body volume. (h) Gas flow velocity into the cavity
  $\bar {U_g}$ computed from (6.4).
We seek to identify the possible mechanisms responsible for the differences in the splash development and seal time. Following Eshraghi et al. (Reference Eshraghi, Jung and Vlachos2020), we use a simplified equation of motion for the splash curtain, whereby the curtain mass is accelerated towards the central axis by the gas velocity into the cavity,
 \begin{equation} m_c \frac{{\rm d}^2 R_c(t)}{{\rm d}t^2} =-\frac{1}{2}\rho_g A (\bar{U_g}(t))^2, \end{equation}
where  $m_c \approx \rho w A$ is the splash curtain mass,
  $R_c$ the radial position of the curtain,
  $A$ the splash curtain surface area,
  $w$ the curtain thickness,
  $\rho _g$ the gas density and
  $\bar {U_g}(t)$ the mean gas flow velocity into the cavity. Equation (6.1) assumes that the air-flow-induced pressure difference across the splash curtain is the dominant force, which is a reasonable assumption for these impact speeds (Lee Reference Lee2000; Eshraghi et al. Reference Eshraghi, Jung and Vlachos2020; Kiyama et al. Reference Kiyama, Rabbi, Speirs, Belden, Tagawa and Truscott2022). Simplifying (6.1) gives
 \begin{equation} \frac{{\rm d}^2 R_c(t)}{{\rm d}t^2} =-\frac{\rho_g}{\rho} \frac{1}{2w}(\bar{U_g}(t))^2. \end{equation}
Splash curtain thickness (i.e. mass) can be inferred from measurements of the splash rim radius from images; that is,  $w \sim a$ (see figure 10e, inset). Measurements of
  $a$ are reported in table 1. The gas flow velocity can be related to the rate of change of cavity volume
  $V_{cav}$ as
 \begin{equation} \frac{{\rm d}V_{cav}}{{\rm d}t} = Q_g + Q_c, \end{equation}
where  $Q_c$ is the flow rate of gas escaping from the cup into the cavity and
  $Q_g = \bar {U_g}(t) A_c(t)$ is the gas flow rate of air from the atmosphere into the cavity. This gas enters the cavity through the annular area
  $A_c(t)$ between the splash rim and the body, where
  $A_c(t) = {\rm \pi}(R_c(t)^2 - R^2)$. Making these substitutions and rearranging (6.3) gives
 \begin{equation} \bar{U_g}(t) = \frac{1}{{\rm \pi}(R_c(t)^2 - R^2)}\left[\frac{{\rm d}V_{cav}}{{\rm d}t} - Q_c \right]. \end{equation}
The rate of change  ${\rm d}V_{cav}/{\rm d}t$ is estimated from measurements of
  $V_{cav}$ from high-speed images, which are shown in figure 10(g) for the four cases under consideration. The cavity volume increases at approximately the same rate for the cup impacts, but increases more rapidly for the disk impact. Evaluating (6.4) for the disk case, with
  $Q_c = 0$ by definition and
  $R_c(t)$ measured (figure 10f), gives the estimates of
  $\bar {U_g}(t)$ plotted in figure 10(h). For the cups, we assume that
  ${\rm d}V_{cav}/{\rm d}t \approx Q_c$ from time
  $t = 0$ to
  $t = t_e + \tau$ (where
  $\tau = 0.4h/U$, see § 4.4), and
  $Q_c \approx 0$ thereafter. In other words, the cavity expansion is driven by gas escaping the cup at early times after impact, and then the cavity expansion is largely due to gas entering from the atmosphere, which induces the pressure difference across the splash curtain driving it to seal. We make this assumption based on observations of the gas escape process described in § 3. The ratio
  $\bar {U_g}/U$ is initially larger for the disk, while the cups maintain approximately the same (lower) constant gas flow velocity throughout the impact event. Furthermore, the delay time
  $t_e + \tau$ increases with increasing
  $h/D$.
Table 1. Parameters for the four cases shown in figure 10.

Based on the above analysis, we conclude that two mechanisms are responsible for the faster cavity seal time observed for the disk and for cups with decreasing  $h$ for a given impact Weber number. First, the thickness of the splash curtain
  $w \sim a$ decreases as
  $h/D \rightarrow 0$, thus decreasing the mass of the splash per unit area (see table 1). We attribute this to the larger initial outwards radial velocity of the splash
  $\dot {R}_{c_o}$ as
  $h/D \rightarrow 0$, as seen in figure 10(f) and reported in table 1. The second mechanism driving faster seal time is the higher average gas flow velocity into the cavity, which results in a larger pressure difference across the splash curtain. The large rate of cavity expansion for the disk impact requires a higher gas flow velocity into the cavity. Not only is
  $U_g$ smaller for cup impact, but gas inflow (and thus the pressure force on the curtain) is delayed due to the escape of trapped gas from the cup. This delay time increases as cup depth increases, which appears to contribute to the longer seal times for cups
  $h/D = 0.12$ and
  $0.16$. A modelling approach would be required to tease out and confirm the relative importance of each mechanism; such a model is beyond the scope of this work. Nonetheless, our experimental measurements combined with a simple model of cavity seal (6.2) indicate that cups in the above-surface seal regime prolong cavity seal by generating a splash curtain with larger thickness and also by delaying and slowing the flow rate of atmospheric gas into the cavity. Therefore, in contrast with the cavity suppression induced by cups in the closed torus regime, cups in the above-surface seal regime actually promote cavity growth by delaying seal time relative to a disk.
7. Conclusions
We have shown that the water entry of cups can produce a variety of regime behaviours. These regimes are characterized by differences in the shape and size of the sub-surface gas cavity, as well as the evolution of the above-surface splash. We found several phenomena that persist for cup water entry over a range of dimensionless cup depths and Weber numbers. These include the formation and rapid closure of a wedge cavity that forms off the wedged cup walls, the escape of trapped gas from the cup and a possible reopening of the cavity to the air above. We proposed models for the cup gas dynamics in the limit of low and high Weber number, and these models accurately describe the experimental observations, including predicting the boundary of the closed torus regime. We found that cups can produce two divergent behaviours – cavity suppression or cavity enhancement – depending on cup depth and impact speed. Cavity suppression occurs when the cup is sufficiently deep so as to delay the time of gas escape such that the cavity never reopens to the air above. In cases in which the wedge cavity is reopened by the escaping gas, the seal time is longer than for disks. We deduced this to be due to a thicker splash sheet and slower gas flow velocity into the cavity, which reduces the pressure difference that drives the splash to seal. Our results extend understanding of the role of trapped gas on the water entry of rigid bodies, showing the dramatic effect it has on cavity and splash phenomena.
Supplementary movies
Supplementary movies are available at https://doi.org/10.1017/jfm.2023.330.
Acknowledgements
J.B., N.B.S, A.J.P. and A.M.H. acknowledge funding from the Naval Undersea Warfare Center In-House Laboratory Independent Research program, monitored by Dr. Tony Ruffa. M.J. and T.T.T. acknowledge funding from the Office of Naval Research, Navy Undersea Research Program (grant N0001414WX00811), monitored by Ms. Maria Medeiros. We thank Heather Kane for help in data processing.
Declaration of interests
The authors report no conflict of interest.
Appendix A
A.1. High-$We_D$ model details

Figure 11 shows a representative example of the predicted motion of the internal gas–liquid interface from the high- $We_D$ model of § 4.2. The parameters for the cup impact are:
  $h = 4$ mm,
  $U_o = 4$ m s
 $^{-1}$. The interface starts at
  $x/h = 1$ and then the gas compresses and relaxes with decaying amplitude. The time to complete the first oscillation cycle is used as a prediction of the gas escape time
  $t_e$, as shown in figure 11.

Figure 11. Prediction of the motion of the internal gas–liquid interface ( $x/h$) versus time for a cup impact with parameters:
  $h = 4$ mm,
  $U_o = 4$ m s
 $^{-1}$. The interface motion is modelled using the high-
 $We_D$ model of § 4.2.
The empirical constant  $\kappa$ in (4.14) is found by varying
  $\kappa$ between
  $0$ and
  $1$ and plotting the closed torus boundary defined by (4.14) on the cavity and splash regime diagram. The results for several values of
  $\kappa$ are shown in figure 12(a), from which we determine that
  $\kappa = 0.4$ best defines the closed torus boundary. Furthermore, to show that gas escape time
  $t_e$ has a significant effect in defining the closed torus boundary, figure 12(b) plots the boundary given by (4.14) with
  $t_e$ set to
  $0$. Doing so fails to capture the observed dependence of the boundary on
  $We_D$.

Figure 12. (a) Cavity and splash regime diagram with different curves for the closed torus boundary given by (4.14) for different values of  $\kappa$. (b) Setting
  $t_e = 0$ fails to capture the observed dependence of the boundary on
  $We_D$.
A.2. Low-$We_D$ scaling analysis details

The low- $We_D$ scaling analysis results in (4.12). Because the low-
 $We_D$ data do not show a dependence of
  $t_e$ on
  $h$ for a given
  $We_D$, we concluded that
  $l = \kappa _{l} h \propto h$, where
  $\kappa _{l}$ is an empirical constant. This conclusion is further supported by figure 13, which plots
  $t_e$ as a function of impact speed
  $U$ for cases with
  $We_D < We_{D_{crit}}$ as defined in figure 6(c). The black curve comes from (4.13) with
  $\kappa _{l} = 1.1(10^{-3})$, showing good agreement with the data. Thus, even though two length scales (
 $h$ and
  $l$) do appear in the scaling analysis, the data indicate that the gas escape time does not depend on
  $h$, at least for the parameter space explored herein. The appearance that
  $t_e$ scales with
  $We_D^{-1/2}$ in figure 6(a) is actually a reflection that
  $t_e$ scales with
  $U^{-1}$.


A.3. Effect of impact angle on cup regimes
Figure 14 plots the cavity seal time  $t_{cs}$ as a function of
  $We_D$ for five different cup depths at all values of
  $\alpha$ measured in the experiment. In general, we find that
  $t_{cs}$ is less sensitive to
  $\alpha$ for cups than it is for disks.

Figure 14. Cavity seal time  $t_{cs}$ as a function of
  $We_D$ for cups with: (a)
  $h/D = 0.04$; (b)
  $h/D = 0.12$; (c)
  $h/D = 0.16$; (d)
  $h/D = 0.32$ and (e)
  $h/D = 0.63$. The symbol colour indicates angle of attack
  $\alpha$ and the shape indicates the regime.


 Open access