


Increasing access to healthy foods and beverages in low-resourced communities continues to be a key public health priority in the USA(1–Reference Karpyn, Young and Weiss3). Federal and state policies aimed at expanding healthy food retail increase important resources to communities that have nutritionally vulnerable populations(Reference Rose4,Reference Vanderlee and Olstad5) . The Healthy Food Financing Initiative (HFFI) is a federally funded programme that provides grants and technical assistance to local grocers, real estate developers and community funds interested in opening businesses that sell healthy food in communities that are US Department of Agriculture designated food deserts (i.e. geographic areas where residents have limited access to healthy food)(Reference Hilmers, Hilmers and Dave6–Reference Ver Ploeg, Nulph and Williams10). Since its inception, the HFFI has supported over 1000 projects in 35 states, which contributed to the development of several thousand square miles of healthy food retail space in low-resourced urban and rural communities(9).
Like many large urban cities, Chicago, IL has a number of low-resourced communities that are considered a food desert(Reference Kolak, Bradley and Block11,Reference Singleton, Li and Duran12) . Many of these communities are located on the city’s south and west sides and have large populations of African American residents. African Americans comprise 33 % of Chicago’s population but nearly 80 % of the residents that live in a food desert(Reference Kolak, Bradley and Block11). Since low-income African Americans are more at risk of diet-related chronic diseases, addressing structural barriers to healthy food access may narrow health inequities in Chicago(Reference Rehm, Peñalvo and Afshin13–Reference Krueger and Reither15). In 2015, The Chicago Community Loan Fund (CCLF), a local real estate investment group, received funding from the HFFI to develop a new supermarket in Chicago’s Englewood community(16,17) . Englewood is a predominately low-income and African American community located on the city’s south side that lacked a large chain supermarket for over a decade(17). Prior studies have shown that small food stores, such as convenience stores and dollar stores, can become a key food source if a community lacks a supermarket(Reference Singleton, Li and Duran12,Reference Walker, Block and Kawachi18,Reference Caspi, Lenk and Pelletier19) . Whole Foods Market © agreed to partner with CCLF on the project in Englewood, so in September 2016 a new Whole Foods Market © opened for business. Given the addition of this chain supermarket to the community’s food environment, it is plausible that existing small foods stores may significantly change their food and beverage stocking and marketing practices to adjust to the competition.
Economic theory suggests that smaller retailers may either implement changes that position them as a competitor (e.g. increasing the quality and stock of fresh foods, price cutting) or a niche retailer that does not compete by focusing on a line of products not offered by the larger retailer (e.g. individual sized sweetened beverage, tobacco and prepared foods)(Reference Basker and Noel20,Reference Hansen21) . Currently, the economic and public health literature on this subject is mixed(Reference Singleton, Li and Odoms-Young22–Reference Jia26). While some studies have observed minimal changes to the types of foods and beverages stocked and marketed by existing food stores after a new supermarket enters the community(Reference Singleton, Li and Odoms-Young22,Reference Ghosh-Dastidar, Hunter and Collins23) , others have reported significant changes to the local retail environment (e.g. store closures and sales loss)(Reference Ailawadi, Zhang and Krishna24–Reference Jia26). Since the quality of a community’s retail food environment is highly associated with the healthfulness of its resident’s diet-related behaviour, understanding how a new supermarket influences existing retailers is important to public health and nutrition equity(Reference Hood, Martinez-Donate and Meinen2–Reference Rose4).
Thus, the overarching aim of this study is to longitudinally evaluate how introducing a new chain supermarket affects food and beverage availability and marketing in existing small food stores in Chicago’s Englewood community at 1 and 2 years after the opening. Prior studies on this topic only collected evaluation data up to 1 year after the supermarket’s opening(Reference Singleton, Li and Odoms-Young22,Reference Ghosh-Dastidar, Hunter and Collins23) . This study addresses this limitation by conducting a detailed assessment of change in food and beverage availability and marketing at 1 and 2 years after the supermarket’s opening in the Englewood community. Overall, this research contributes important knowledge to the field on: (1) the environmental and economic implications of healthy food access initiatives such as the HFFI and (2) how introducing a new supermarket to a low-income/low-resourced community affects the retail food environment.
Methods
Study communities and store identification
To address the study aim, a quasi-experimental study was conducted from 2016 to 2018. Fieldworkers were trained to audit small food stores in two predominately low-income and African American communities of Chicago, IL: Englewood and North Lawndale. Both communities were a food desert and lacked a supermarket at baseline. About 96 % of the residents in Englewood were African American, and 49 % had an income below the federal poverty line. In North Lawndale, 95 % of residents were African American and 47 % were impoverished. To develop an initial list of small food stores in both communities, publically available data on food business addresses in 2015 were obtained from the City of Chicago Data Portal(27). Research team members used ArcGIS software (version 10.3.1) to map addresses for all small non-chain grocery stores and limited service stores, specifically convenience stores, gas stations, dollar stores, pharmacies and liquor stores, located within a one-mile radius of the new supermarket’s location in Englewood. Furthermore, team members mapped all stores in a one-square mile area of North Lawndale. This distance (one-mile) was selected because it aligns with the US Department of Agriculture’s definition of an urban food desert(Reference Ver Ploeg, Nulph and Williams10). Fieldworkers performed ground truthing in both community areas to confirm the address of every eligible small food store. Afterwards, they audited every eligible store found in both communities. Food and beverage availability and marketing were evaluated in all small food stores at three time points: 2016 (before the store opened or ‘baseline’), 2017 (1 year after opening) and 2018 (2 years after opening). Furthermore, fieldworkers audited the new supermarket at 1 and 2 years after its opening. Data collection was performed in August and/or early September each year of the study. The institutional review board at the University of Illinois at Chicago (UIC) considered this exempt research.
Data collection tool
Fieldworkers were trained to use the Illinois Prevention Research Center (PRC) Food Store Audit Tool to collect data(28). Detailed information about the tool can be found elsewhere(Reference Rimkus, Powell and Zenk29). To briefly summarise, the Illinois PRC Food Store Audit Tool is a valid and reliable instrument for assessing food and beverage availability, in-store marketing, and exterior store marketing. Over 600 variables are included on the tool including general store features, beverages, staple food items (e.g. fruit, vegetables, bread, meat and dairy) and snack foods (e.g. chips, candy and sweet backed goods). The tool is publicly available on the UIC Policy, Practice, and Prevention Research Center website and has been used in prior studies(Reference Singleton, Li and Duran12,Reference Singleton, Li and Odoms-Young22,27,28) . Fieldworkers scanned the interior and exterior of each store to complete all sections of the tool. They hand-recorded their responses, and completed forms were checked by study staff for quality assurance.
Measures
Store features
Fieldworkers assessed the following store features: store type, Supplemental Nutrition Assistance Program (SNAP) authorisation status, number of cash registers, service counter availability, on-site parking availability and security feature availability. Store type was classified as small grocery store, convenience store (which includes gas stations), dollar store, pharmacy or liquor store(Reference Singleton, Li and Duran12,Reference Singleton, Li and Odoms-Young22) . The latter four store types were categorised as a limited service store because they sold a limited line of staple food items (e.g. fruit, vegetables, bread, meat and dairy). Stores that sold a full line of staple food items, including fresh meat, were classified as a small grocery store. Convenience stores were limited service stores that had 1–2 cash registers but did not sell fresh meat. Limited service stores that also sold non-food items such as household products, clothing, decorations, and small furniture were considered a dollar store. Pharmacies had a counter where customers could obtain prescription medications. Liquor stores had a store inventory that comprised 50 % or more of alcoholic beverage items. Fieldworkers were asked to count and record the number of cash registers. SNAP authorisation refers to stores that accept SNAP benefits (i.e. food stamps). Fieldworkers looked for signage that suggested the store is SNAP-authorised. If no signage was available, they asked store staff. Cash registers that were not in use or located at self-service stations counted towards the total, whereas registers located at the pharmacy, makeup or photo counter did not count. Stores that had a butcher, bakery or deli service counter were considered to have a service counter available. Stores that had a security guard, security camera or security mirror were considered to have security features.
Food and beverage availability
Fieldworkers collected food and beverage availability data from all small food stores. They counted the number of fruit and vegetable options, separately, by presentation: fresh, frozen and canned/shelf-stable. An option refers to a specific type of fruit or vegetable item; for example, fresh apples, fresh oranges and fresh pineapple were all considered separate options. Different forms of a specific food type were considered one option. For example, whole fresh apples and fresh pre-packaged apple slices counted towards one option. Fieldworkers stopped counting fresh fruit and vegetable options after reaching 20 options (recorded as 20+ options). They stopped counting frozen options and canned/shelf-stable options after surpassing 10 options (recorded as 10+ options).
In addition to fruits and vegetables, data on the availability of the following food and beverages were also collected: milk, soda, juice, bread, cereal, rice, ground beef, cheese and chips. For each of these items, fieldworkers scanned the store to locate a ‘regular’ and ‘reduced-fat/reduced-calorie/reduced added sugar’ option. If the option was available, fieldworkers recorded yes on the data collection tool. The complete list of items assessed includes regular milk (whole or 2 %), low-fat milk (1 % or skim), regular soda, diet soda, 100 % juice, juice drink (<50 % juice), white bread, 100 % whole wheat bread, regular cereal (≥6 g of sugar per serving), low-sugar cereal (<6 g of sugar per serving), white rice, brown rice, regular ground beef (>10 % fat), lean ground beef (≤10 % fat), regular cheese, reduced fat cheese, regular chips and low-fat chips (<4 g of fat per serving). Only unflavoured cow’s milk was assessed; plant-based milk and milk from other animals were not evaluated. Regular soda was considered any full-calorie soda (regardless of flavour), while reduced-calorie and calorie-free sodas counted towards diet soda. To be considered 100 % juice or 100 % whole wheat bread, the product packaging for the item had to have that exact wording. Cheese (any type) that was labelled reduced-fat or part-skim was considered to be reduced-fat cheese.
Food and beverage marketing
Food and beverage marketing was measured by the presence of: (1) interior store item displays; (2) check-out lane displays and (3) exterior store advertisements. Fieldworkers scanned each food store and recorded yes or no if they found an interior store item display for the following food and beverage items: fresh fruit, fresh vegetables, regular soda, diet soda, plain water, unflavoured cow’s milk, other sweetened beverages, salty snacks, sweetened baked goods and candy. Both special floor displays and end-aisle displays were counted as interior store item displays. Stand-alone displays of a specific food or beverage that typically force customers to walk around them were counted as a special floor display. These displays include bins, coolers, stand-alone shelving and items arranged on a table or floor pallet. End-aisle displays refer to items arranged on the endcap of a store aisle. Sweetened beverages other than soda (e.g. juice drinks, lemonade, ready-to-drink tea and ready-to-drink coffee) were considered other sweetened beverages. Items such as potato chips, pretzels, crackers, popcorn and jerky were labelled salty snacks. Sweetened baked goods were items such as cookies, muffins and snack cakes.
Fieldworkers examined the check-out lane space and recorded yes or no if they found any of the food and beverage items listed in the special floor display battery (see list above). Both self-service items and items found behind the counter, or in a display case, that required retrieval by the clerk were counted. Fieldworkers were trained to separately count the number of exterior store advertisements found on the building and property. Counts were recorded for the following items: fresh fruits and vegetables, regular soda, diet soda, energy drinks, sports drinks, and unflavoured cow’s milk. Property ads were defined as advertisements found on the gates, fencing, gas pumps or in the parking lot of the store. Fieldworkers did not count advertisements that were smaller than an 8 × 10 sheet of paper; they stopped counting after reaching 20 advertisements (recorded as 20+ ads).
Statistical analysis
The unit of analysis was small food stores located select areas of the intervention and comparison communities. Descriptive statistics (i.e. means and frequencies) were calculated to assess baseline store features by store type (small grocery v. limited service) and community type (intervention v. comparison). Significant differences in the baseline features of small food stores were identified using differences in proportions and Student’s t tests. Means and frequencies were also calculated, by community type, for all food and beverage availability and marketing variables at each time period: 2016, 2017 and 2018. Furthermore, food and beverage availability and marketing variables were summarised and presented for the supermarket. Only small food stores open for business that permitted the store audit were included each year; thus, sample sizes of stores vary by year in both communities. In the intervention community, 40, 32 and 31 stores were audited in 2016, 2017 and 2018, respectively. Approximately, 38, 42 and 40 stores in the comparison community were audited in 2016, 2017 and 2018, respectively. Sample sizes of stores varied by year primarily due to stores not permitting fieldworkers to complete the audit. Thus, all analyses performed evaluated group-level changes rather than store level. Difference-in-differences (DID) regression models were used to identify significant differences between the intervention and comparison communities in regard to change in store food and beverage availability and marketing from baseline and post-opening of the new supermarket(Reference Singleton, Li and Odoms-Young22). DID models compared baseline data to 2017 and 2018 data, separately. DID models were adjusted for food store type and did not include data collected from the supermarket. All analyses were performed with Stata 14 and P-values < 0·05 were considered statistically significant.
Results
Table 1 displays the baseline features of the small food stores across all stores and by store type and intervention status. Half of all stores in the baseline sample were convenience stores and 85·9 % accepted SNAP benefits. Approximately 19·2 % sold gasoline and 96·2 % had at least one security feature. All small grocery stores accepted SNAP, whereas 80·4 % of limited service stores accepted SNAP. A significantly greater percentage of small grocery stores had a service counter available. Stores located in the intervention and comparison communities had similar store features at baseline.
Table 1 Baseline features of small food stores stratified by store type and site (2016), % or mean (sd)

SNAP: Supplemental Nutrition Assistance Program.
* Difference between grocery stores and limited service stores is statistically significant at P < 0·05.
† Other limited service stores include pharmacies, liquor stores and discount/dollar stores.
‡ Cash registers that are self-service or not in use.
Information on fruit and vegetable availability in the new supermarket and small food stores at baseline (2016) and follow-up (2017 and 2018) is recorded in Table 2. The supermarket carried 20+ fresh and 10+ frozen fruit and vegetable options at both follow-up periods. Small food stores in the intervention and comparison communities, on average, offered < 3 fresh and < 2·5 frozen fruit and vegetable options in every year of data collection. Shelf-stable fruit and vegetable options were more prevalent in small food stores compared to fresh options. Results from DID models suggested no significant differences for change in fruit and vegetable availability between stores in the intervention community and the comparison community at 1 and 2 years after the supermarket opened. Information on food and beverage availability in the new supermarket and small food stores at each time point is recorded in Table 3.The supermarket carried every food and beverage item on the data collection tool except regular ground beef. A low percentage of small food stores in both communities stocked the following healthier alternative items in every year of data collection: skim or 1 % milk (2·5–6·5 %), 100 % whole wheat bread (2·5–38·7 %), brown rice (6·3–22·5 %), lean ground beef (0–6·5 %) and low-fat chips (2·4–13·3 %). DID analysis detected a significant difference between stores in the intervention community and comparison community for change in regular cheese availability from 2016 to 2017 (β = 4·67; se = 1·59). While the percentage of stores in the intervention community that offer regular cheese slightly increased from 2016 to 2017 (55·3 % v. 62·5 %), the percentage of stores in the comparison community that offer regular cheese declined (52·6 % v. 31·0 %). This difference was not observed in 2018.
Table 2 Change in fruit and vegetable availability in small food stores, mean (±sd)

DID: difference-in-difference.
† In the intervention site, fieldworkers audited 40 small stores in 2016 (baseline), 32 stores in 2017 (year 1) and 31 stores in 2018 (year 2).
‡ In the comparison site, fieldworkers audited 38 small stores in 2016 (baseline), 42 stores in 2017 (year 1) and 40 stores in 2018 (year 2).
§ β estimates and standard errors for intervention*time interaction term in DID regression models.
‖ DID model unable to produce results.
For these measures, DID regression models produced no statistically significant results.
Table 3 Change in food and beverage availability in small food stores, %
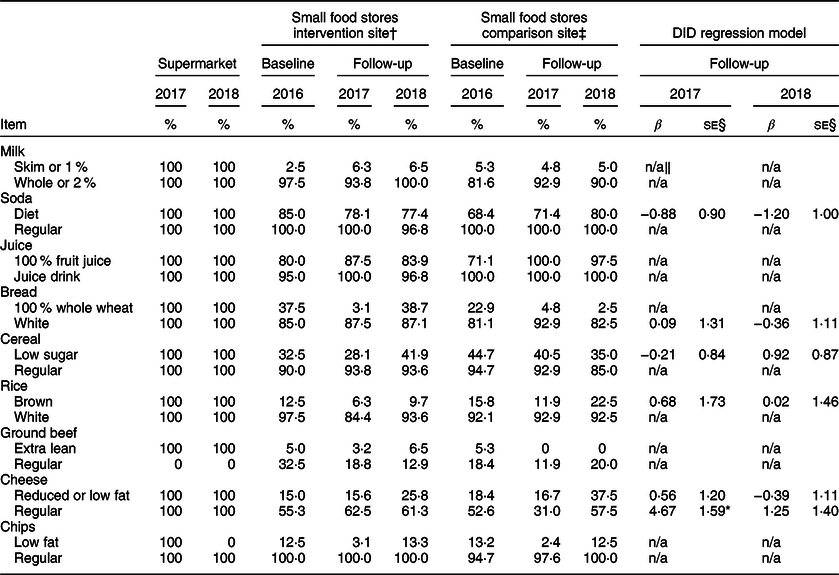
DID: difference-in-difference.
* P-value < 0·01.
† In the intervention site, fieldworkers audited 40 small stores in 2016 (baseline), 32 stores in 2017 (year 1) and 31 stores in 2018 (year 2).
‡ In the comparison site, fieldworkers audited 38 small stores in 2016 (baseline), 42 stores in 2017 (year 1) and 40 stores in 2018 (year 2).
§ β estimates and standard errors for intervention*time interaction term in DID regression models.
‖ DID model unable to produce results.
Table 4 displays information on food and beverage marketing in the new supermarket and small food stores in both communities at baseline and follow-up. The new supermarket had exterior store ads for fresh fruits and vegetables in 2018. About 20 % of small food stores in the intervention and comparison communities had exterior store ads for fresh fruits and vegetables in each year of data collection. Regular soda was the item found advertised outside the largest percentage of small food stores at all time periods. No differences in change in exterior store advertisements were detected between communities in 2017 or 2018. Interior store displays for variety of food and beverage items were observed in the supermarket in 2017 and 2018 including fresh fruit, plain water, salty snacks, candy and sweetened baked goods. A low percentage of small food stores (< 20 %) in both communities had interior store displays for fresh fruits and vegetables at each time period. Over 70 % of small food stores had interior store displays for salty snacks and sweetened-baked goods. A significant difference between the intervention community and comparison community was detected for change in percentage of stores with interior store displays for other sweetened beverages from 2016 to 2018 (β = −2·23; se = 1·06). While the percentage of stores in the intervention community with interior store displays for other sweetened beverages was about the same in 2016 v. 2018 (37·5 % v. 38·7 %), the percentage of stores in the comparison community with interior store displays for other sweetened beverages increased (55·3 % v. 70·0 %). About 12–23 % of small food stores had fresh fruit available at check-out each year. A large percentage of small food stores in both communities had candy, salty snacks and sweetened baked goods available at check-out. A significant difference between communities was observed for change in percentage of stores with salty snacks available at check-out from 2016 to 2017 (β = 2·50; se = 0·97). The percentage of stores with salty snacks at check-out significantly increased in the intervention community 1 year after the supermarket opened.
Table 4 Change in food and beverage marketing in small food stores, %

DID: difference-in-difference.
* P-value < 0·05.
† In the intervention site, fieldworkers audited 40 small stores in 2016 (baseline), 32 stores in 2017 (year 1) and 31 stores in 2018 (year 2).
‡ In the comparison site, fieldworkers audited 38 small stores in 2016 (baseline), 42 stores in 2017 (year 1) and 40 stores in 2018 (year 2).
§ β estimates and standard errors for intervention*time interaction term in DID regression models.
‖ Exterior store ads include ads posted on the building and the store property.
¶ Interior store item displays includes special floor displays and end-aisle displays.
** Available at check-out includes items that are self-serve and clerk-assisted.
†† DID model unable to produce results.
Discussion
This quasi-experimental study aimed to longitudinally evaluate the effects of a new supermarket opening in a predominantly low-income and African American community on the existing retail food environment, which comprised mostly small stores that stock few staple food items. The development of this supermarket, which is located in the Englewood community on Chicago’s south side, was partially supported by the HFFI. Prior to the opening, this community’s food environment primarily comprised small food stores such as small grocery stores, convenience stores and dollar stores. The high prevalence of small food stores in low-income communities and communities of colour is particularly concerning because recent studies have found that excess availability of unhealthy food retailers (i.e. food swamp) is a better community-level predictor of obesity than limited availability of healthy food retailers (i.e. food desert)(Reference Kristen, Schwartz and Brownell30,Reference Hager, Cockerham and O’Reilly31) . Thus, structural barriers to accessing healthy food are a key public health concern because they may contribute to racial and socio-economic disparities in health.
The addition of a supermarket to Englewood’s retail food environment expanded healthy food availability and promotion in the community. However, the entry of the supermarket only led to minor changes to food and beverage availability and marketing in nearby small food. Compared to North Lawndale, significant changes to regular cheese availability and salty snack promotion at check-out were detected 1-year post-intervention in the Englewood. A higher percentage of small stores were promoting salty snacks at check-out after the supermarket opened, which may suggest these stores were particularly interested in promoting these items. Salty snacks were not found at check-out at the supermarket in either year of assessment. No other substantive changes to food and beverage availability occurred in the small food stores during this study period. Thus, these results underscore prior findings that suggest the entry of a new supermarket to a low-resourced community may result in minor changes to food and beverage stocking and marketing practices among existing small food stores. Small stores in these communities may fill a specific need of current residents, which keeps them economically viable despite new competition from a full-service grocer. A qualitative study by Sherman et al. (2015) highlighted the socio-cultural and economic significance of corners stores in low-income urban communities(Reference Sherman, Grode and McCoy32). They reported that corner store usage often starts as a young age and most use these stores to purchase discretionary items such as snacks and sugar-sweetened beverages(Reference Sherman, Grode and McCoy32). Thus, the goods and services supplied by the supermarket may not supplant the primary motive for small food store usage by many community residents.
The findings from the current study are comparable to two other studies that recently evaluated the impact of introducing a HFFI-supported supermarket to a predominately low-income African American community(Reference Singleton, Li and Odoms-Young22,Reference Ghosh-Dastidar, Hunter and Collins23) . Singleton et al. (2019) reported that opening a discount supermarket, a Save-A-Lot, in a low-income area of Rockford, IL did not affect food and beverage availability and marketing in existing small food stores after 1 year post-opening (n 22)(Reference Singleton, Li and Odoms-Young22). Like the current study, many of the stores audited in Rockford were limited service stores that stocked few staple food items. Ghosh-Dastidar et al. (2017) conducted a natural experiment to examine how introducing a new supermarket to a low-income African American community in Pittsburgh, PA, impacted healthy and unhealthy food availability and pricing in nearby stores (n 26) after a year(Reference Ghosh-Dastidar, Hunter and Collins23). They also found few changes in net food availability after the supermarket opened, although some changes in the pricing of certain food items were reported. Economic studies provide some insight into this topic as well(Reference Ailawadi, Zhang and Krishna24–Reference Jia26). For example, studies by Ailawadi et al. (2010) and Hausman and Leibtag (2007) documented how introducing a mass merchandiser (e.g. Wal-Mart or K-Mart) affected nearby retail stores(Reference Ailawadi, Zhang and Krishna24,Reference Hausman and Leibtag25) . While these studies linked the introduction of a mass merchandiser to loss of smaller discount retailers, they do not provide information on how these stores impact the existing retail food environment. Overall, the current state of evidence indicates that introducing a supermarket to a low-resourced urban community results in minimal change to food and beverage availability and marketing in existing small food stores. This evidence should be considered when putting the implications of large-scale healthy food retail expansion policies, such as the HFFI, into context.
Despite the increasing number of research studies on the HFFI, its effect on public health and healthy equity remains unclear(Reference Karpyn, Young and Weiss3,Reference Singleton, Li and Duran12,Reference Singleton, Li and Odoms-Young22,Reference Ghosh-Dastidar, Hunter and Collins23,Reference Dubowitz, Ncube and Leuschner33,Reference Dubowitz, Ghosh-Dastidar and Cohen34) . Expanding healthy food retail in low-resourced communities can potentially address major dietary concerns such as food insecurity and poor diet quality. While the current study did not assess how the new supermarket affected consumer food and beverage purchasing, food insecurity, or dietary intake in Englewood, a limited number of other studies have considered these outcomes(Reference Cantor, Beckman and Collins35–Reference Rogus, Athens and Cantor38). Overall, the evidence suggests that community perceptions of healthy food availability improve after a supermarket opens, but significant improvements in diet-related behaviours such as fruit and vegetable purchasing and consumption are often not observed(Reference Cantor, Beckman and Collins35–Reference Rogus, Athens and Cantor38). Needed are studies that evaluate positive and negative changes to individual (e.g. food purchasing behaviour, family feeding practices), community (i.e. social cohesion, blight) and other store-level factors (i.e. pricing, supply chains) in addition to food and beverage availability and marketing in smaller food stores(Reference Fleischhacker, Flournoy and Moore39).
Strengths and limitations
The strengths and limitations of the research should be noted. Using the Illinois PRC Food Store Observation Tool to audit stores was a strength because it features a large variety of food and beverage availability and marketing variables. The study design was a strength because a complete audit of all small food stores found in the intervention and comparison areas was performed at baseline and 2 years after the supermarket’s opening. Nonetheless, the small sample size of small food stores found in the intervention and comparison areas may have affected the DID regression analyses, specifically the ability to detect significant differences between communities over time. A larger sample size of stores would have permitted a more robust assessment of change in food and beverage availability. A small number of stores in both communities did not allow fieldworkers to complete the audit in follow-up years. Furthermore, several stores closed permanently or opened for business between baseline and the second assessment period (2018). Because of these changes, the statistical analyses performed were not based on a balanced sample of stores present in all 3 years of the study. A sensitivity analysis revealed the results presented in the current paper are not significantly different from the results when the sample is restricted to stores present in all 3 years. Only food stores located within one mile of the new supermarket were included in this assessment. Existing literature suggest that low-income individuals often shop at food stores outside of their community area for reasons such as schedule, safety and pricing(Reference Vojnovic, Ligmann-Zielinska and LeDoux40,Reference DiSantis, Hillier and Holaday41) . If this is the case in Chicago, those other stores were not captured in this assessment. Change in food and beverage pricing over time was not assessed in the current study. Given findings from similar studies that evaluated price, it is possible that existing small food stores in the current study altered their price of staple foods and snack items in response to the opening of a new supermarket(Reference Ghosh-Dastidar, Hunter and Collins23). Future studies should consider longitudinal changes to price and pricing strategies of healthy and unhealthy foods and beverages. No individual-level data were collected from community residents that allow an evaluation of changes in consumer food purchasing, decision-making or dietary practices over time. Since this study was conducted solely in Chicago, findings may not be generalisable to other large urban centres in the USA or abroad.
Conclusions
Expanding healthy food retail in low-resourced communities has significant implications for public health and community nutrition because introducing a large chain supermarket may alter residents’ health behaviours and perceptions about the healthfulness of the food landscape. The current study observed no significant changes in food and beverage availability and marketing in Englewood’s existing small food stores at 1 and 2 years after the introduction of a supermarket. However, the addition of this new supermarket to the community’s food landscape expanded the availability of healthy foods and beverages in an area of Chicago that previously lacked a supermarket for over a decade and has a large nutritionally vulnerable population. These findings contribute additional knowledge of the environmental and economic impact of healthy food retail initiatives such as the HFFI to the scientific literature. This information is integral for shaping future policy, systems and environmental change interventions that aim to alleviate nutritional inequities in the USA. Overall, there continues to be a need for studies that examine longitudinal changes to food pricing, food purchasing, dietary intake, and community stability in urban and rural settings after the introduction of a large full-service grocer. Future studies should address these gaps.
Acknowledgements
Acknowledgements: The authors would like to acknowledge the fieldworkers who participated in the data collection process, the storeowners and managers, and the Nutrition and Obesity Policy Research and Evaluation Network (NOPREN). Financial support: The research presented in this paper was funded by the Centers for Disease Control and Prevention Nutrition and Obesity Policy Research and Evaluation Network (L.M.P., grant number 5U48DP005010) and the National Cancer Institute of the National Institutes of Health (C.R.S., grant number R25CA057699). Conflict of interest: There are no conflicts of interest. Authorship: L.M.P. and S.N.Z. conceptualized the research project and secured the funding. Y.L. performed the statistical analysis. C.R.S. led the data collection and writing of this manuscript. All authors reviewed the final version of the manuscript and approved it for publication. Ethics of human subject participation: The institutional review board at the University of Illinois at Chicago deemed this exempt research. This study did not involve human subjects.


