


Introduction
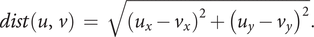
The position-based or geographic routing protocols generate the greedy packet forwarding distance (PFD) feature (Kao et al., Reference Kao, Fevens and Opatrny2005); which, based on dissimilarity indices, characterizes a mobile ad hoc network’s (MANET) topology by node size (Kulin et al., Reference Kulin, Kazaz, De Poorter and Moerman2021; Oladeji-Atanda & Mpoeleng, Reference Oladeji-Atanda and Mpoeleng2022). In multihop geographic routing, the greedy algorithm enables each intermediate network node to forward packets to a neighbor which is closer in Euclidean distance to a final destination (Kuruvila et al., Reference Kuruvila, Nayak and Stojmenovic2004). Figure 1 illustrates a greedy forwarding at the node u, having transmission range r, which within its progress region would choose a neighbor, such as v, to be the next relay toward the destination d. The length measurement of the link between u and v thus forms the PFD. A node’s next-relay choice is also determined by the geometric computation peculiarity of its greedy algorithm. For example, as depicted in Figure 1, the GREEDY algorithm implements the metric
 $ \min \left\{\left|\overline{vd}\right|\right\} $
that chooses a neighbor having the minimum distance to the destination, whereas
$ \min \left\{\left|\overline{vd}\right|\right\} $
that chooses a neighbor having the minimum distance to the destination, whereas
 $ \min \left\{\left|\overline{uv}\right|+\left|\overline{vd}\right|\right\} $
describes the ELLIPSOID metric (Kao et al., Reference Kao, Fevens and Opatrny2005). By employing the ELLIPSOID and the GREEDY geographic packet forwarding metrics, Oladeji-Atanda and Mpoeleng (Reference Oladeji-Atanda and Mpoeleng2022) have shown that the dissimilarities in the average values of the greedy PFD aid in characterizing MANET topology by node size. In this article, we demonstrate the potential of the geographic routing’s PFD distribution-based dissimilarity learning in MANET topology characterizing. The characterizing of topologies supports context-aware packet routing performance optimization in dynamic MANETs, such as the vehicular ad hoc networks (VANETs) and flying ad hoc networks (FANETs), where node size varies significantly (Medina et al., Reference Medina, Hoffmann, Ayaz and Rokitansky2008; Silva et al., Reference Silva, Reza and Oliveira2019).
$ \min \left\{\left|\overline{uv}\right|+\left|\overline{vd}\right|\right\} $
describes the ELLIPSOID metric (Kao et al., Reference Kao, Fevens and Opatrny2005). By employing the ELLIPSOID and the GREEDY geographic packet forwarding metrics, Oladeji-Atanda and Mpoeleng (Reference Oladeji-Atanda and Mpoeleng2022) have shown that the dissimilarities in the average values of the greedy PFD aid in characterizing MANET topology by node size. In this article, we demonstrate the potential of the geographic routing’s PFD distribution-based dissimilarity learning in MANET topology characterizing. The characterizing of topologies supports context-aware packet routing performance optimization in dynamic MANETs, such as the vehicular ad hoc networks (VANETs) and flying ad hoc networks (FANETs), where node size varies significantly (Medina et al., Reference Medina, Hoffmann, Ayaz and Rokitansky2008; Silva et al., Reference Silva, Reza and Oliveira2019).

Figure 1. A greedy packet forwarding.
Dissimilarity learning and topology characterizing
The positionings and associated links between the nodes describe the topology of a network, which may be characterized based on the dissimilarity indices of the elements’ statistical distribution. Cucka et al. (Reference Cucka, Netanyahu and Rosenfeld1997) showed that a network’s underlying topology or graph type could be distinguished by an exploration agent, to determine the most optimal exploitation method in path-search tasks of repetitive nature. In their demonstration with Delaunay and random graph types, the arc or link length averages and histogram distribution patterns differentiate the two. Kolaczyk and Csárdi (Reference Kolaczyk, Csárdi, Kolaczyk and Csárdi2020) showed a similar mode of characterizing social networks by the distribution patterns of the node degrees or neighbor links. In Schieber et al. (Reference Schieber, Carpi, Díaz-Guilera, Pardalos, Masoller and Ravetti2017), the network-distance and the node-distance distributions are incorporated into the definition of a dissimilarity metric D(G, Gˊ) that quantifies graphs’ fluid flow capacity. The dissimilarity approach entails distinguishing between similar entities through pairwise comparison of their defining distance measures (Costa et al., Reference Costa, Bertolini, Britto, Cavalcanti and Oliveira2020; Riesen & Bunke, Reference Riesen and Bunke2010).
Methods
The greedy PFD elements that we analyze are based on the data obtained from the simulation experiment described in Oladeji-Atanda and Mpoeleng (Reference Oladeji-Atanda and Mpoeleng2022). The elements were generated using the NS-3 network simulator and the Greedy Perimeter Stateless Routing routing protocol, and based on a VANET environment of 30, 50, 70, 90, and 110 node sizes (Silva et al., Reference Silva, Reza and Oliveira2019). Other simulation parameters are the network area: 1,100 m2; nodal transmission range: 280 m; node speed: 0–15 m/s; simulation time: 200 s; and the packets type: 512 byte CBR/UDP. We illustrate greedy PFD distribution with the ELLIPSOID and GREEDY metrics due to their popularity in position-based routing protocol designs. We sort the metrics’ PFD performance collections into classes based on arbitrarily determined length delimitations. We then produce frequency distributions of the PFD elements in each class. Finally, we show that the derived charts depict dissimilarities, which a learning method can ascertain, in characterizing a MANET’s topology by node size.
Metrics of distance, classification, and dissimilarity indices
We specify metrics for the PFD element and its distribution classification. For two nodes u and v (Figure 1), the Euclidean distance between them in the two-dimensional plane is determined by
 $$ dist\left(u,v\right)\hskip0.35em =\hskip0.35em \sqrt{{\left({u}_x-{v}_x\right)}^2+{\left({u}_y-{v}_y\right)}^2}. $$
Note that position-based routing can be evaluated or performed in 2D or 3D (Medina et al., Reference Medina, Hoffmann, Ayaz and Rokitansky2008; Silva et al., Reference Silva, Reza and Oliveira2019). For the neighbors of a node u represented by the set
 $ N(u)t\hskip0.35em =\hskip0.35em \left\{{v}_1,\dots, {v}_n\right\}t $
at time t, its set of edges or links is described by
$ N(u)t\hskip0.35em =\hskip0.35em \left\{{v}_1,\dots, {v}_n\right\}t $
at time t, its set of edges or links is described by
 $$ E(u)t\hskip0.35em =\hskip0.35em \left\{{e}_{u,{v}_i}(t)\;|\hskip0.24em dist\Big(u,{v}_i\Big)\hskip0.35em \le \hskip0.35em r,\hskip0.36em i\hskip0.35em =\hskip0.35em 1,\dots, |N(u)|\right\}. $$
Each link
 $ {e}_{u,{v}_i} $
has intrinsic values such as length, link duration, and so forth, associated with it. Our interest presently lies in the Euclidean “length” attribute of the greedy PFD, designated as
$ {e}_{u,{v}_i} $
has intrinsic values such as length, link duration, and so forth, associated with it. Our interest presently lies in the Euclidean “length” attribute of the greedy PFD, designated as
 $ {d}_{GF} $
(Oladeji-Atanda & Mpoeleng, Reference Oladeji-Atanda and Mpoeleng2022). Thus,
$ {d}_{GF} $
(Oladeji-Atanda & Mpoeleng, Reference Oladeji-Atanda and Mpoeleng2022). Thus,
 $$ {d}_{GF}\left({e}_{u,{v}_i}(t)\right)\hskip0.35em =\hskip0.35em dist\left(u,{v}_i\right)(t). $$
In a packet routing session, the collection of the PFD elements is representable as
 $$ {D}_{GF}\hskip0.35em =\hskip0.35em \left\{{d}_{GF_i}(t)\hskip0.24em |\hskip0.24em i\hskip0.35em =\hskip0.35em 1,2,3,\dots, \left|{D}_{GF}\right|\right\} $$
For convenience, we do not continue showing the time t in our equations. Given a kth node size in a network,
 $ {D}_{GF}^k $
describes the relevant PFD collection, 1 ≤ k ≤ m, where m is the environment’s regular maximum. We can sort the elements in each
$ {D}_{GF}^k $
describes the relevant PFD collection, 1 ≤ k ≤ m, where m is the environment’s regular maximum. We can sort the elements in each
 $ {D}_{GF}^k $
into p subclasses based on the delimitations of the length l attribute. Let the set of the length delimitations be {l
1, l
2, …, lp}, 0 < l
1 < l
2 < … < lp, and lp = r is the maximum nodal transmission range (Figure 1). Hence, we can sort the elements in each
$ {D}_{GF}^k $
into p subclasses based on the delimitations of the length l attribute. Let the set of the length delimitations be {l
1, l
2, …, lp}, 0 < l
1 < l
2 < … < lp, and lp = r is the maximum nodal transmission range (Figure 1). Hence, we can sort the elements in each
 $ {D}_{GF}^k $
as follows:
$ {D}_{GF}^k $
as follows:
 $$ {D}_{GF}^{k1}\hskip0.35em =\hskip0.35em \left\{{d}_{GF_i}\;|\;{d}_{GF_i}>0\bigwedge {d}_{GF_i}\hskip0.35em \le \hskip0.35em {l}_1\right\}, $$
 $$ {D}_{GF}^{k2}\hskip0.35em =\hskip0.35em \left\{{d}_{GF_i}\;|\;{d}_{GF_i}>{l}_1\bigwedge {d}_{GF_i}\hskip0.35em \le \hskip0.35em {l}_2\right\},\\\vdots $$
 $$ {D}_{GF}^{kp}\hskip0.35em =\hskip0.35em \left\{{d}_{GF_i}\;|\hskip0.24em {d}_{GF_i}>{l}_{p-1}\bigwedge {d}_{GF_i}\hskip0.35em \le \hskip0.35em {l}_p\right\}. $$
We can then assign the number of PFD elements in each
 $ {D}_{GF}^{kj} $
(j = 1, …, p) to be the integer-valued occurrences count ckj:
$ {D}_{GF}^{kj} $
(j = 1, …, p) to be the integer-valued occurrences count ckj:
 $$ {c}^{k1}\leftarrow \left|{D}_{GF}^{k1}\right|, $$
 $$ {c}^{k2}\leftarrow \left|{D}_{GF}^{k2}\right|,\\\vdots $$
 $$ {c}^{kp}\leftarrow \left|{D}_{GF}^{kp}\right|. $$
Thus, for the chart representing the kth node size of a network, we may plot the x,y-coordinates (lj, ckj) to display the relevant distribution. The c kj(ELLIPSOID) and c kj(GREEDY) charts representing ELLIPSOID and GREEDY forwarding outcomes can be plotted accordingly. Finally, a dissimilarity-learning method can perform intra- and inter-chart comparisons to differentiate between network node sizes k and k':
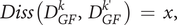 $$ Diss\left({D}_{GF}^k,{D}_{GF}^{k\hbox{'}}\;\right)\hskip0.35em =\hskip0.35em x, $$
where the output, x ≥ 0, indicates the dissimilarity index value. We do not explicate the metric Diss(.) in this article, but we present distribution charts that illustrate the function in its expected outcomes. Example dissimilarity metrics and pattern recognition methods are described in Costa et al. (Reference Costa, Bertolini, Britto, Cavalcanti and Oliveira2020) and Schieber et al. (Reference Schieber, Carpi, Díaz-Guilera, Pardalos, Masoller and Ravetti2017).
Results and discussion
As a result of our simulation experiment on neighbor choices of ELLIPSOID and GREEDY forwarding, we classify (as in equation (5)) the generated PFD elements by length delimitations of 10, 20, 30, 40, 50, 60, 70, 80, 90, 100, 120, 140, 160, 180, 200, 220, 240, 260, and 280 m. Then, we perform the occurrence count in each class (as in equation (6)) and plot the values as shown in Figures 2 and 3. Intra- and inter-chart comparisons show rich distinctions of the PFD frequency distributions for the ELLIPSOID and GREEDY forwarding methods. For instance, at the 110 node size, the ELLIPSOID’s cumulative occurrence count below 150 m PFD length measure is about 28,000 out of about 34,000 total, an approximate of 82%, whereas that of GREEDY is about 4,000 out of about 25,000, an approximate of 16%. Furthermore, across all the node sizes (i.e., Figure 2a–e), the 100-m PFD cumulative values for ELLIPSOID steadily increase from 43 to 76%, whereas that of GREEDY decreases from 18 to 6%. Similar trends are observable for the 200-m PFD limit, and so on.

Figure 2. (a–e) PFD occurrence count cumulative frequency distributions.
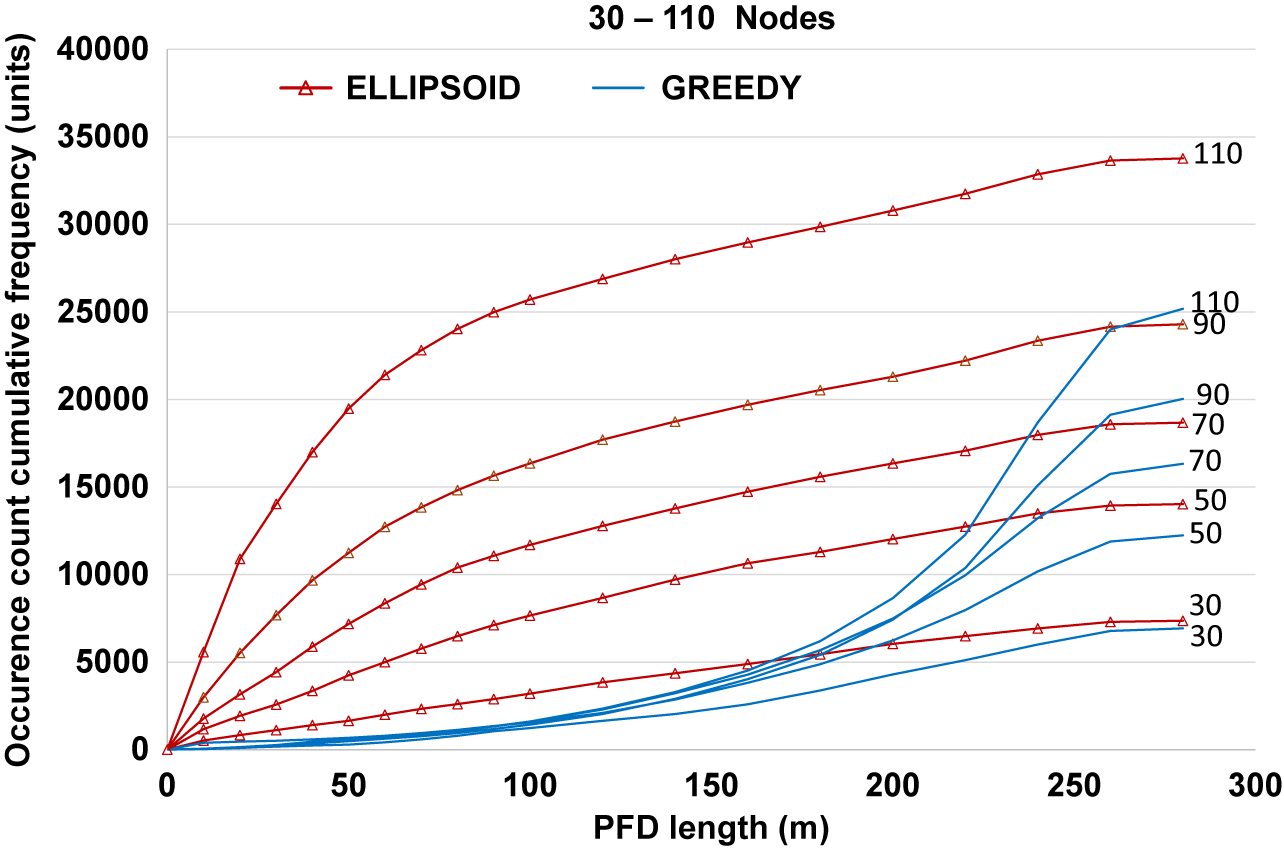
Figure 3. PFD occurrence count hierarchy of cumulative frequency distributions.
Figure 3 shows the charts of Figure 2a–e placed together. The ELLIPSOID charts show distinct hierarchies of the PFD distribution all through the 0–280 m classifications, whereas that of GREEDY is clear only from around 150 m upward. This implies that the ELLIPSOID’s PFD is more sensitive to node size variations, which recommends it to solely provide dissimilarity indices in a topology characterizing scheme. In general, both methods’ distinctive PFD outcomes are generalizable to other greedy metrics such as the Most Forward Routing and Compass Routing (Kao et al., Reference Kao, Fevens and Opatrny2005).
Conclusions
We have shown that a position-based or geographic routing protocol can perform dissimilarity learning of the greedy PFD distribution to characterize MANET topology by node size. The example next-relay neighbor choices of GREEDY and ELLIPSOID forwarding generated varied modes of the PFD, in length and proportion to network node size. The resultant distribution-based charts demonstrate an efficacious approach to PFD dissimilarity learning and topology characterizing. In dynamic environments, such as the VANET and the FANET, the characterizing of topologies is an aid in optimization tuning of a network’s parameters (Kulin et al., Reference Kulin, Kazaz, De Poorter and Moerman2021), like variable-range transmission or topology control (Medina et al., Reference Medina, Hoffmann, Ayaz and Rokitansky2008). Our investigation on PFD distribution involved a MANET with a uniform node speed of 0–15 m/s, whereas it will be necessary to also study the effect of different mobility rates. Moreover, some supervised learning applications should be involved in verifying the efficacy of the distribution-based dissimilarity learning of the PFD in topology characterizing.
Data availability statement
The data used in this study was obtained from Silva et al. (Reference Silva, Reza and Oliveira2019) (https://github.com/CSVNetLab/PA-GPSR).
Funding statement
This work was supported in part by the Research Initiation Grant of the Botswana International University of Science and Technology, Project Code No. S00122.
Conflicts of interest
The authors declare that they have no conflict of interest.
Authorship contributions
G.O.-A. designed the study and wrote the article. D.M. supervised the study and the article writing.


 Open access
Comments
Comments to the Author: 1. The experimental results are obvious intuitively. There seems no need to conduct such experiments. It’s well known that Greedy favours long links and Ellipsoid favours short links.
2. The figures on cumulative frequencies show the same phenomena as the figures on separate frequencies. Only one set of figures will do.
3. The choice of words and the composition of sentences are poor. The English writing needs to be improved significantly.