Currently, it is estimated that 1·2 billion people live in extreme poverty and about 870 million are undernourished globally( 1 ). Strategies to improve livelihoods and income in the poorest sectors of communities are essential to achieve food security for all, and accordingly this is a significant focus of the UN’s 2015 Sustainable Development Goals (SDG). The SDG, with an outlook to 2030, renew the focus of previous efforts (e.g. Millennium Development Goals) to address food security and other development issues on a global scale. We see this food security focus explicitly in SDG2 (‘End hunger, achieve food security and improved nutrition and promote sustainable agriculture’) but also implicitly in relation to other SDG including: poverty (SDG1); health and well-being (SDG3); clean water and sanitation (SDG6); work and economic growth (SDG8); reduced inequalities (SDG10); sustainable communities (SDG11); responsible consumption and production (SDG12); life below water (SDG14) and on land (SDG15)( 2 ). The widespread presence of food security dimensions within multiple SDG is a clear indication of the need to develop globally relevant, consistent and comparable measures of progress towards a more food-secure future.
Food security is defined as the physical, social and economic ability to access sufficient, safe and nutritious food( 3 , Reference Jones, Ngure and Pelto 4 ). The four pillars of food security intrinsic to this definition are: (i) availability of food; (ii) access to adequate food; (iii) utilization of food; and (iv) stability of the food supply. Each of these pillars has determinants that span national food economies and population-level factors, household-level factors and individual characteristics. Despite food security’s well-defined determinants, there is little consistency in the way measures are applied in practice to assess its presence or absence and thus guide successful food security policy development( Reference Carletto, Zezza and Banerjee 5 , Reference Coates 6 ). It is important to recognise that no single measure can encompass all dimensions of food security; current measurement efforts often focus on one or a combination of these four pillars( Reference Jones, Ngure and Pelto 4 ).
Interchangeable use of the terms ‘hunger’, ‘undernourishment’ and ‘food insecurity’ further complicates the understanding of appropriate food security measurement indicators( Reference Jones, Ngure and Pelto 4 , 7 ). These concepts are related but are not synonymous. Food insecurity refers to periods when people do not have safe access to a nutritious diet required for normal growth and development and an active and healthy life for all. To measure the ‘hunger target’ of the Millennium Development Goals, the FAO considered two indicators, the prevalence of undernourishment and the prevalence of underweight in children under the age of 5 years( 7 ). If the specific aspect of food security being measured is not clearly or consistently defined, the effectiveness of interventions cannot be determined, nor can comparisons be made between or within countries, thereby hindering efforts to benchmark progress and improve food security of high-risk groups. These groups include populations affected by conflict and political instability which can occur in both urban and rural areas( 7 ).
A need for effective measures of food security is most urgent in low-income and lower-middle-income countries (LMIC), which are defined by a Gross National Income of less than $US 3955 and similar non-monetary measures of quality of life( 8 ). These LMIC account for the majority of global food insecurity; for example, between 2014 and 2016, LMIC in Southern Asia were predicted to account for over 35 % of undernourished people globally compared with just over 1 % for those in developed countries such as the USA( Reference Coates 6 ). However, difficulty adopting globally standardised measures is compounded by lack of resources to routinely collect quality data, especially in LMIC where the food insecurity situation is most pronounced( Reference Coates 6 ). Hence, it is prudent to develop an understanding of how best to use existing resources in such countries, particularly where routine national surveys are administered to evaluate a country’s social and economic trends and assist in the identification of priority areas for policy action. Exploring the utility of such resources to facilitate regular monitoring and evaluation of food security dimensions in LMIC may reveal useful sources of data for secondary analysis of food security status with relatively low additional resource impact.
Household consumption and expenditure surveys (HCES) are regularly conducted in LMIC and provide a potential tool and resource to measure aspects of the access dimension of food security. Here, access is defined as ‘the resources available to obtain food, generally at the household level through economic, physical and social dimensions’( 9 ). HCES is an umbrella term that refers to several different types of household-level surveys, including household income and expenditure surveys (HIES), integrated household surveys (IHS), household budget surveys (HBS) and living standard measurement surveys (LSMS)( Reference Fiedler 10 ). Historically, HCES have been administered at national level to obtain data on how household income is spent and includes household acquisition of items that may be donated, given as gifts or home-produced( Reference Fiedler 10 ). These data are typically used by national governments to construct consumer price indices, calculate national accounts and monitor national poverty( Reference Coates, Colaiezzi and Fiedler 11 ).
The potential of HCES to provide proxy measures of food consumption and dietary patterns at the household level has been recognised by food and nutrition analysts and government agencies as a useful source of apparent food consumption data( Reference Smith and Subandoro 12 ). Indeed, the use of HBS to calculate individual food consumption has been examined extensively in European countries through the DAFNE (DAta Food NEtworking) project( Reference Naska, Berg and Cuadrado 13 , Reference Naska, Vasdekis and Trichopoulou 14 ) and the benefit of analysing nutrition data collected in HBS has been demonstrated. Use of survey data in this way provides one proxy measure for household food security, as the quantities and types of foods acquired by the household, in a given time period, can be divided by predetermined nutritional requirements of the household members. Other proxy measures for food that can be obtained from HCES include income expenditure on food and dietary diversity( Reference Smith and Subandoro 12 ).
In addition, HCES-based data have been used to develop evidence-based food fortification programmes in response to disproportionately high levels of micronutrient deficiencies( Reference Coates, Colaiezzi and Fiedler 11 , Reference Fiedler, Carletto and Dupriez 15 ). These micronutrient deficiencies are also associated with food insecurity, particularly nutrition insecurity or ‘hidden hunger’. In this setting, HCES can be used to identify commonly acquired foods that are potentially fortifiable and then used to monitor intakes of fortified foods over time( Reference Fiedler 10 ). The advantages of HCES as a source of information for household access to food are centred on:
1. their relative frequency of implementation, between 3 and 5 years( Reference Fiedler 10 );
2. their ability to provide multiple proxy indicators relevant to food security( Reference Smith 16 ) (e.g. economic access to food, diet quality and diet quantity); and
3. their potential to offer a relatively comprehensive dietary ‘snapshot’ of food acquisition of which the length of recall period typically relates to the previous 7 d but may span up to the past month( Reference Coates, Colaiezzi and Fiedler 11 , Reference Smith and Subandoro 12 ).
The similar methods employed in HCES also allow within-country differences in food security risk to be determined( Reference Pérez-Escamilla and Segall-Corrêa 17 ). For example, differences in the food acquired between urban and rural areas of a country can impact food security status across sub-populations( Reference Smith and Subandoro 12 ). However, despite an increase in the quality and frequency of these surveys in LMIC( Reference Fiedler, Carletto and Dupriez 15 ), it is important to recognise that the data collection processes remain inconsistent in some countries( Reference Smith 16 ). There are also limitations regarding assumptions applied in the analysis of HCES data, where it may be assumed that food acquisition is equal to food consumption( Reference Jones, Ngure and Pelto 4 ), as well as limitations around the lack of data on intra-household intake( Reference Smith 16 ).
Notwithstanding, HCES are considered a reliable means to assess the access dimension of food security( Reference Smith 16 ). However, a clear understanding of how, methodologically, these data are being used to assess food security is much needed and currently lacking in LMIC. The current scoping review of the literature aimed to examine the methods used by other authors to determine the access dimension of food security using proxy measures from HCES data in LMIC, by answering the following research question: what methodologies and proxy measures are used to assess food security using HCES data in LMIC?
Methods
A scoping review was conducted to answer the research question according to the framework developed by Arksey and O’Malley( Reference Arksey and O’Malley 18 ), with considerations of concurrent methodological recommendations provided by Levac et al.( Reference Levac, Colquhoun and O’Brien 19 ) and Pham et al. ( Reference Pham, Rajić and Greig 20 ). A number of scientific databases were consulted, including MEDLINE, Scopus, Web of Science, Wiley and Proquest. The search terms included ‘food (in)security’, ‘household consumption’, ‘household expenditure’, ‘household income’, ‘household budget’, ‘living standards’, ‘living measurement’, ‘integrated household’ and ‘survey’. The database search strategies included truncation, Boolean operators and the use of proximity searching techniques. Search results were sorted by ‘relevance’ and ‘cited by’ database filters, where irrelevant subject areas were excluded using database functions. While reviewing articles, tracking and hand-searching of reference lists were also used to find any other related literature.
Exclusion criteria were: (i) non-English language; (ii) not peer reviewed; (iii) lack of definition of food (in)security; (iv) lack of a clear definition of food security indicators; (v) assessment of poverty without distinguishing food poverty; (vi) survey not defined as a HCES or similar; (vii) countries not classified as low-income or lower-middle-income according to World Bank data in the year of publication( 8 ); and (viii) surveys that included additional questionnaires on health-related biomarkers and anthropometry. Articles that used food security experience-based questions and scales in addition to the original HCES-based survey were eligible for inclusion in the review but only information pertaining to analysis of data from traditional HCES were included in the review. This is because the aim was to identify alternative ways to assess food security as opposed to specific, validated scales developed for the measurement of food security. As such, review of food security experience scales is beyond the scope of the present review. Studies published within the past 15 years were eligible for inclusion.
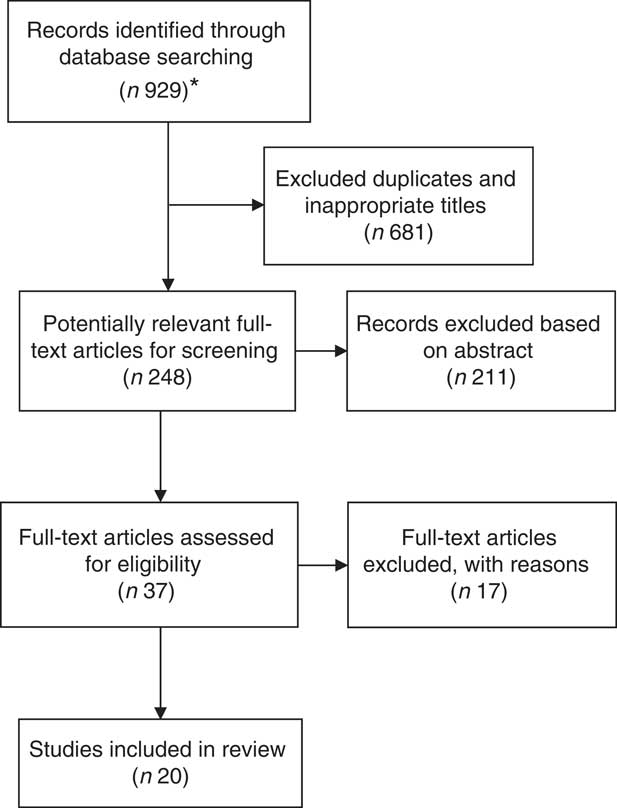
Two main phases of data screening were conducted: (i) screening based on article title and abstract; and (ii) screening to remove irrelevant articles based on the eligibility criteria described above (Fig. 1). Compiled data were managed through EndNote version X3 or X5 (Clarivate Analytics). Results were summarised, tabulated and arranged via food security indicator and measure.

Fig. 1 Summary of search results on studies assessing food security using household consumption expenditure surveys in low-income and lower-middle-income countries. *Initial search included using in-built screening options per database (such as country selection)
Results
A total of twenty peer-reviewed articles were included in the final review out of the 929 abstracts that were initially identified (see online supplementary material, Supplemental Table 1). Fourteen LMIC countries were included within these twenty articles. Nigeria, Vietnam and Malawi were represented in three articles each; Bangladesh and India were represented in two articles each; and Ethiopia, Cambodia, Pakistan, Tanzania, South Africa and Nepal were represented in one article each. One article also represented a total of three LMIC, namely Burkina Faso, Bolivia and the Philippines. All articles included HCES data from nationally representative samples, except for one article that surveyed a random sample within three countries (Bolivia, Burkina Faso and the Philippines)( Reference Melgar-Quinonez, Zubieta and MkNelly 21 ).
Table 1 summarises seven different indicators used by authors in the reviewed articles to determine household food security status. These indicators are further classified into eighteen different criteria.
Table 1 Summary of food security measures used by study
HH, household; GSO, General Statistical Office; AE, adult equivalent; CU, consumer unit; UNU, United Nations University; LSMS, living standards measurement survey; WFP, World Food Programme; HFSSM, Household Food Security Survey Module.
To convert to kilojoules, multiply kilocalorie values by 4·184.
Clearly, a number of different measures were used across the papers included in the present review as shown in Table 1. Because of the nature of the data collected in HCES, indicators of food insecurity focused mainly on poverty and lack of economic access to food. Authors of the reviewed articles attempted to deal with the limitations by using complex statistical methods to account for error and bias. Ordinary least-squares regression analysis was commonly used and compared with other types such as quantile regression( Reference Melgar-Quinonez, Zubieta and MkNelly 21 – Reference Szabo, Hossain and Adger 35 ).
The use of the different indicators by HCES type is shown in Table 2, with data from the majority of HCES being used to measure more than one indicator. The simplest and most common metric used to indicate food insecurity in nine of the reviewed articles was to compare household food expenditure against a level considered to be below the food poverty line, as per the reference minimal food cost for that household composition, or against a reference food poverty line suggested by World Bank or FAO criteria for the respective country( Reference Mahal and Karan 27 , Reference Osberg 30 – Reference Sultana and Kiani 34 , Reference Cuong 36 – Reference Khandker 38 ). In the nine articles, the cost of a basic subsistence diet was often calculated for the household composition of its members. This cost was based on local food costs and a household’s actual reported expenditure on food, which takes account of home-grown food and food provided as gifts. This metric was used to distinguish between households considered to be experiencing ‘food poverty’ and those that were not considered to be in ‘food poverty’.
Table 2 Food security indicators included in country surveys according to the type of household consumption expenditure survey
Eight of the cited papers also expressed the data on acquisition of food in terms of available energy (in ‘calories’, i.e. kilocalories; 1 kcal=4·184 kJ) for consumption by the household( Reference Fisher and Lewin 23 , Reference Kumar and Quisumbing 25 , Reference Mahajan, Sousa-Poza and Datta 26 , Reference Mishra and Ray 28 , Reference Nguyen and Winters 29 , Reference Rose and Charlton 33 , Reference Szabo, Hossain and Adger 35 , Reference Harttgen, Klasen and Rischke 39 ). Six studies further expressed this as a proportion of the household’s total energy requirements( Reference Fisher and Lewin 23 , Reference Mahajan, Sousa-Poza and Datta 26 , Reference Mishra and Ray 28 , Reference Rose and Charlton 33 , Reference Szabo, Hossain and Adger 35 , Reference Harttgen, Klasen and Rischke 39 ). To determine available nutrients the food acquisition data were converted to standardised quantities, such as grams or kilograms, and then to available nutrients including energy, but sometimes also protein and micronutrients such as Fe, thiamin and vitamin C( Reference Mahal and Karan 27 , Reference Geniez, Mathiassen and De Pee 37 ), using local food composition tables. Cut-off values regarding the level of available energy to determine whether a household was food insecure ranged from 7121 kJ (1702 kcal)( Reference Harttgen, Klasen and Rischke 39 ) per person per day to 12 134 kJ (2900 kcal)( Reference Ozughalu and Ogwumike 31 , Reference Ozughalu 32 ) per person per day. These values were based on either country-specific calculated requirements or the pre-existing FAO criterion of 8786 kJ (2100 kcal) per person per day( 40 ).
Five of the cited papers assessed food security through per capita food expenditure( Reference Melgar-Quinonez, Zubieta and MkNelly 21 , Reference Adebayo, Olagunju and Kabir 22 , Reference Mishra and Ray 28 , Reference Nguyen and Winters 29 , Reference Szabo, Hossain and Adger 35 ). Where defined, a household was considered food insecure if it spent more than 75 % or a weighted two-thirds of the mean per capita food expenditure( Reference Adebayo, Olagunju and Kabir 22 , Reference Szabo, Hossain and Adger 35 ) (see also Table 1). In the remaining studies that used this proxy measure, food expenditure was considered a continuous, rather than bivariate measure of food security( Reference Melgar-Quinonez, Zubieta and MkNelly 21 , Reference Mishra and Ray 28 , Reference Nguyen and Winters 29 ).
Dietary diversity, i.e. the number of food groups available for consumption, was also used to measure food security in four of the cited studies( Reference Jones 24 , Reference Mishra and Ray 28 , Reference Nguyen and Winters 29 , Reference Sophal 41 ). For the assessment of dietary diversity, foods reported in HCES were grouped into similar categories, and then further aggregated into eight to ten food groups. The way in which foods were aggregated was often determined by the food consumption patterns of the population being studied. For example, in countries where rice (e.g. Vietnam) or maize (e.g. Malawi) was the predominant staple and provided over 50 % of total available energy, these foods were allocated their own food category( Reference Jones 24 , Reference Giesecke, Tran and Corong 42 ).
All HCES cited included home-produced foods as well as those that had been gifted or provided in-kind. In nine articles, food security was reported as a bivariate variable (i.e. food secure or food insecure)( Reference Fisher and Lewin 23 , Reference Mahajan, Sousa-Poza and Datta 26 , Reference Mahal and Karan 27 , Reference Osberg 30 , Reference Rose and Charlton 33 – Reference Geniez, Mathiassen and De Pee 37 ), three studies used a ranking in the range of 1, 2 or 3 (i.e. food secure, moderately food insecure, severely food insecure)( Reference Adebayo, Olagunju and Kabir 22 , Reference Mishra and Ray 28 , Reference Khandker 38 ) and five studies assessed the variables as continuous measures( Reference Melgar-Quinonez, Zubieta and MkNelly 21 , Reference Jones 24 , Reference Kumar and Quisumbing 25 , Reference Mishra and Ray 28 , Reference Nguyen and Winters 29 ). Five studies also explored food security qualitatively, where coping strategies and participant experiences were assessed( Reference Melgar-Quinonez, Zubieta and MkNelly 21 , Reference Jones 24 , Reference Kumar and Quisumbing 25 , Reference Osberg 30 , Reference Sophal 41 ). The variables reported to influence the risk of food insecurity were common across studies, namely larger household size and gender of head of household.
Discussion
The present scoping review has identified a range of methods and proxy measures used to assess household food security using data collected as part of HCES. Data obtained through HCES-based surveys may therefore prove useful in monitoring and surveillance efforts focused on food security and progress towards other associated SDG in LMIC.
HCES data are able to provide a measure of apparent food consumption but at the household, rather than the country level, and therefore provide information relating to the access pillar of food security. The type of dietary information differs from the country-level apparent consumption food balance sheets compiled by the FAO. Food balance sheets provide a comprehensive picture of the pattern of a country’s food supply during a specified reference period and thus information on the availability pillar of food security by demonstrating the quantity per capita of individual foods available for human consumption – this corresponds to the sources of the food supply.
Poverty is a major contributor to food insecurity; therefore it is not surprising that many papers chose to use a method focused on measuring the economic access to food, particularly in terms of the affordability of sufficient energy required to meet the needs of the entire household. Many studies used a metric termed the ‘food poverty line’. This metric compares the amount of money spent by a household on food against the predetermined amount required to purchase sufficient energy for all household members. The food poverty line is determined by individual countries but often involves the World Bank in discussion with respective governments( Reference Ravallion, Shaohua and Prem 43 ).
In line with this approach is the cost of basic needs approach, as described by Ravallion( Reference Ravallion 44 ). This approach was also commonly used in the cited papers that focused on economic access to food. The cost of basic needs is constructed first by assessing the household expenditure required to purchase a ‘basket’ of food to meet basic energy needs per capita (i.e. the ‘food basket’ measure). An amount for non-food spending required to meet basic needs (e.g. clothing, housing and health care) is then added to this amount, to determine overall poverty lines. The basket of food is designed to meet minimum energy requirements rather than optimal nutrient requirements of low-income households.
Focusing on access to sufficient energy for the entire household via methods such as the cost of basic needs approach provides useful information that allows identification of sub-sectors of the population that are at greatest risk of inadequate access to sufficient quantities of food. However, care should also be taken when using daily energy requirements for the purpose of food security assessment, as some populations may be less active due to transportation associated with urbanisation and increasingly sedentary lifestyles related to the nutrition transition. Energy requirements may also vary regionally based on the type of labour force participation. For example, populations living in rural areas where farming and agricultural-based activities are common would have higher energy requirements than those living in urban areas where jobs may involve more sedentary behaviours. The daily energy requirement calculations include a physical activity level component that could be altered to allow for increasing sedentary behaviour or differences in regional activity levels( Reference Weisell and Dop 45 ). Energy requirements that are based on differences related to ethnicity and associated ratio of lean mass to fat mass may also need further consideration to avoid overestimating the proportion of the population that is considered to be food insecure( Reference Rush, Freitas and Plank 46 ).
Of the sixteen papers included in the present review that used energy requirements in their assessment of food security, three( Reference Mishra and Ray 28 , Reference Cuong 36 , Reference Khandker 38 ) based their measurements on the 2001 FAO human energy requirements of 8786 kJ (2100 kcal) per person per day( 40 ). This requirement was originally created to calculate the food needs of adults using a minimum activity level to inform food assistance programmes during emergency situations( 47 ) and may therefore not be relevant for more active populations. Other energy requirements used in the cited papers varied from 7121 kJ (1702 kcal) to 12 134 kJ (2900 kcal) per person per day, while some of the papers did not specify an energy requirement as kilojoule/kilocalorie amount.
Methods that focus on access to energy also often fail to provide information regarding the nutritional quality of food available to households, and it has been argued that this is likely to underestimate micronutrient deficiencies in LMIC( Reference Geniez, Mathiassen and De Pee 37 ). In some LMIC such as India that have a double burden of disease including high rates of malnutrition together with increasing obesity rates and prevalence of non-communicable diseases, a refocus on dietary diversity is needed. Here, dietary diversity is defined as the total number of different foods or food groups consumed over a given reference period( Reference Ruel 48 ). If countries are consuming a greater variety of foods but have high rates of overweight and obesity, assessing dietary diversity is essential to determine if the increased variety is coming from imported, energy-dense, nutrient-poor foods or from local, nutrient-rich foods( Reference Jones 24 , Reference Zhang, Chen and Liu 49 ). It is important to realise that populations who are meeting energy requirements may not, in fact, be meeting micronutrient requirements; hence, they may not be considered nutritionally secure, even if they appear to be meeting the availability requirement of a food-secure population. Risk of inadequate micronutrient intakes may be better identified through assessment of dietary diversity, using consumption data obtained through HCES.
Dietary diversity, as a proxy measure for diet quality and a measure of food security, was assessed in four of the cited papers( Reference Jones 24 , Reference Mishra and Ray 28 , Reference Nguyen and Winters 29 , Reference Sophal 41 ), thereby providing information on potential micronutrient inadequacies at a household level. Standard methodology for determining dietary diversity from HCES data is available at the household level; however, it does not account for intra-household food distribution nor does it account for the volume of food acquired or consumed( Reference Zhang, Chen and Liu 49 , Reference Kennedy, Ballard and Dop 50 ). Geniez et al.( Reference Geniez, Mathiassen and De Pee 37 ) used the minimum cost of a nutritious diet (MCND) method devised by Save the Children that calculates the minimum cost (prices based on local food market surveys) required to meet the nutrient requirements of a household. As with other methods, the MCND method has its limitations, namely that food price data are collected at a single point in time and it does not allow for seasonal price variations.
In addition to objective assessments of food security using indicators of economic access and dietary diversity, as described above, there has also been progress made in the development of qualitative measures of household food security. The role of household food insecurity as an underlying determinant of malnutrition in the developing country context was first elucidated in the early 1990s in the UNICEF causal framework( 51 ). Since then, considerable progress has been made in defining and measuring household food insecurity, using tools that are both qualitative and subjective.
For example, the Food Insecurity Experience Scale includes items that question whether respondents are worried that their food will run out, or whether adults in the household eat less than they feel they should( 2 ). Experience-based scales have been used regularly in the USA, where a nationally representative food security module was introduced as a component of the Current Population Survey in 1995( Reference Andrews, Bickel and Carlson 52 ). In our review, only four of the cited HCES papers also included experienced-based questions for food security assessment, and it is noteworthy that these questions were different in each of the four papers( Reference Jones 24 , Reference Kumar and Quisumbing 25 , Reference Osberg 30 , Reference Sophal 41 ). However, Jones( Reference Jones 24 ) used an adapted version of the Coping Strategies Index as an indicator of food insecurity that was included in the Malawi Third Integrated Household Survey. Findings showed that those who were food insecure had less diverse diets as measured by the Food Consumption Score.
In LMIC, it has been argued that if quantitative indicators of food insecurity could be developed using data that are routinely collected for the purpose of determining living standards measures, such as HCES, this would be advantageous to government agencies and non-governmental organizations, which often have scarce resources to meet their information needs( Reference Rose and Charlton 33 ). A quantitative, objective method to assess food insecurity would be a valuable resource for the purpose of food and nutrition monitoring and surveillance. With the development of qualitative assessment tools and their incorporation into HCES-based surveys we may also begin to see a change in the way that food security is regularly measured and monitored. Regardless of the method chosen to assess food security using HCES data, clarity is needed regarding the criteria used to inform the choice of proxy measure to allow greater consistency across surveys in future research.
Evidently, HCES data are able to be utilised in a number of ways to assess food security through both quantitative and qualitative means. An additional indicator to measure food availability using HBS from European countries was also identified. The DAFNE databank has used such surveys to calculate the mean food availability as grams per person per day for various European countries( Reference Trichopoulou, Naska and Oikonomou 53 ). Results from these studies have also shown that HCES can provide useful information on the nutritional status at household and individual levels, as well as dietary patterns and their impact on overall health( Reference Naska, Vasdekis and Trichopoulou 14 ). Although this indicator has provided relevant nutrition information in high-income countries, none of the cited studies in LMIC that met our review inclusion criteria calculated mean food availability using the DAFNE methodology. As such, there is potential to include this methodology in future HCES in LMIC; however, such analysis is beyond the scope of the present paper.
Additionally, HCES data can provide considerable evidence regarding external influences that impact population access to food. For example, the global food price crisis experienced in 2006–2008 was associated with the rise in prevalence of food insecurity, as demonstrated by the use of HCES in Cambodia( Reference Sophal 41 ). Another valuable use of HCES data in the context of food security is to highlight vulnerability of certain sub-populations who are caught in war conflict situations or natural disasters, as was the case to demonstrate the impact of civil conflict imposed by Boko Haram in northern Nigeria( Reference Adebayo, Olagunju and Kabir 22 ). Routine collection of HCES data within the same country can demonstrate seasonal impacts on food availability and cost over time, as was shown in Bangladesh( Reference Khandker 38 ). The analyses may also identify the impact of price shocks, natural disasters or climate change on household access to food( Reference Harttgen, Klasen and Rischke 39 , Reference Sophal 41 ).
An explanation why the included articles covered only fourteen of the fifty-three LMIC classified by the World Bank Country and Lending Group may be related to the fact that governmental and non-governmental agencies often publish their HCES findings in the grey literature, particularly websites. We acknowledge that grey literature may be a valuable source of information; however, the primary purpose of the current review was to determine the robustness of methods used to assess food security using HCES using peer-reviewed literature.
Conclusion
The present scoping review has identified HCES that are routinely conducted in LMIC are a potentially valuable source of information to assess food security and particularly the access dimension of food security. As shown, a range of quantitative and qualitative methods as well as proxy measures have been used to determine food security status of households. However, use of standardised measures as described above, as well as adaptation of measures from developed countries and greater clarity describing the methods, including the associated assumptions and limitations, are needed to allow comparisons between countries in the context of assessing progress towards the SDG. These measures can be used to inform the effectiveness of food policy interventions to alleviate poverty, malnutrition and hunger.
Acknowledgements
Financial support: The authors gratefully acknowledge funding support from the University of Wollongong’s Global Challenge programme and the Australian Centre for International Agriculture Research (ACIAR) Project ‘Fish in national development: contrasting case studies in the Indo-Pacific Region’ (FIS/2015/031). Neither the University of Wollongong’s Global Challenge programme nor ACIAR had any role in the design, analysis or writing of this article. Conflict of interest: The authors declare no conflicts of interest. Authorship: The authors’ responsibilities were as follows. J.R., A.L. and K.C., study concept and design; A.L. completed literature searching and data screening; J.R. and A.L. reviewed articles for inclusion; J.R., A.L. and K.C. drafted the manuscript; J.R., A.L., K.C., Q.H., A.D. and B.C. critically reviewed the final draft of the manuscript. Ethics of human subject participation: Not applicable.
Supplementary material
To view supplementary material for this article, please visit https://doi.org/10.1017/S136898001800068X