


CVD is one of the leading causes of morbidity and mortality worldwide( Reference Finegold, Asaria and Francis 1 ). Metabolic and cardiovascular disturbances including visceral adiposity, dyslipidaemia, high blood pressure and hyperglycaemia have been identified as risk factors for developing CVD( Reference Roth, Forouzanfar and Moran 2 ). In Colombia, obesity and the metabolic syndrome (MetS) have become major public health problems due to westernised dietary habits and physical inactivity( Reference Ramírez-Vélez, Correa-Bautista and Martínez-Torres 3 , Reference González, Castiblanco and Arias-Gómez 4 ). For this reason, it is essential to identify factors contributing to cardiometabolic risk in populations of young people to promote cardiovascular health.
Muscle mass has been established as an independent predictor of cardiometabolic diseases( Reference Kim, Han and Han 5 – Reference Srikanthan and Karlamangla 7 ). In fact, an inverse association has been reported between muscle mass and the MetS( Reference Atlantis, Martin and Haren 8 , Reference Park and Kim 9 ). The biological pathways that led to the protective effect of high muscle fitness on cardiometabolic health have not yet been determined but since skeletal muscle is a primary site for insulin-mediated glucose uptake, loss of muscle may promote insulin resistance and, consequently, metabolic disorders( Reference García-Hermoso, Carrillo and González-Ruíz 10 ).
Furthermore, adiposity, defined as excessive adipose tissue, may result in an adverse endocrine response that may promote cardiovascular and metabolic diseases( Reference Dale, Fatemifar and Palmer 11 ). In particular, visceral adipose tissue is a pro-inflammatory endocrine tissue that plays a relevant role in the development of metabolic disorders since visceral fat deposition is a key determinant of both inflammation and insulin resistance( Reference Bays 12 , Reference Juge-Aubry, Henrichot and Meier 13 ). Thus, previous studies have reported that visceral adiposity is associated with the development of metabolic disease( Reference Yumi, Toru and Shuichiro 14 – Reference Pouliot, Després and Nadeau 20 ). Interestingly, Lee et al. ( Reference Lee, Kuk and Kim 18 ) and Druet et al. ( Reference Druet, Baltakse and Chevenne 19 ) reported that visceral adipose tissue was associated with the MetS in young people.
Sarcopenic obesity, defined as reduced muscle mass and excess adiposity, has been established as a cardiovascular risk factor because of the double metabolic burden deriving from the two individual body composition phenotypes( Reference Prado, Wells and Smith 21 ). The contribution of sarcopenic obesity to cardiometabolic health is becoming a primary concern since it may promote the impaired metabolism of glucose and lipids( Reference Shah, Hurt and Mundi 22 ). Evidence supports the fact that high levels of fat mass together with low muscle fitness may lead to an increased risk of metabolic disorders during early adulthood( Reference Sacheck, Kuder and Economos 23 – Reference Jekal, Kim and Im 25 ). However, the impact of the muscle mass to visceral fat (MVF) ratio on the cardiometabolic profile in young adults has not been investigated. In addition, to our knowledge, cut-off points for MVF ratio to predict the MetS have not been proposed.
The objective of this study was, therefore, to evaluate the association between the MVF ratio and cardiometabolic risk factors in a large population of college students from Colombia and to propose cut-off points of this index for the MetS. We hypothesised that the MVF ratio might be a stronger predictor of clustered cardiometabolic risk in young people compared with muscle mass and/or visceral fat level independently.
Methods
Participants and study design
This was a cross-sectional analysis of data from the FUPRECOL adolescents and young adults study (collected between 2014 and 2017), which aimed to assess changes in lifestyle and CVD during attendance at university (aged 18–30 years)( Reference Ramírez-Vélez, Correa-Bautista and Sanders-Tordecilla 26 ). We recruited a convenience sample consisting of 1838 collegiate students from three different areas of Colombia (the capital district of Bogota, Boyacá and Santiago de Cali). The sex distribution was similar to that of the entire university population. Students were informed that participation was voluntary and there was no penalty for not participating. Inclusion criteria were no self-reported history of inflammatory joint disease or neurological disorder; not an elite athlete. Exclusion criteria included the following: medical or clinical diagnosis of a major systemic disease including malignant conditions such as cancer, type 1 or 2 diabetes, high blood pressure, hypothyroidism or hyperthyroidism; a history of drug or alcohol abuse; regular use of multivitamins; chronic inflammatory conditions including rheumatoid arthritis, systemic lupus erythematosus, multiple sclerosis; infectious conditions and a BMI ≥ 35 kg/m2. Volunteers received no compensation for their participation. The final sample included in this paper was 1464 (64·3 %, 942 women) participants with full valid data. The Research Ethics Committee of Universidad Manuela Beltrán (UMB N° 01-1802-2013) in Bogotá approved the study protocol, and all subjects signed informed consent form before their participation in the study.
Sample size was calculated using the MedCalc version 18.6 program (MedCalc Software bvba). In the original study, we considered a total of 176 539 college students who were enrolled in health sciences programmes in the first semester of 2014( 27 ). Considering an expected prevalence of 25 % since we included multiple cardiovascular risk factors as outcome, 5 % acceptable variability, 99 % confidence level and, an increase of 30 % to control for potential confounding factors, the final sample size was expected to be 1398 subjects. A value of 30 % of the prevalence was considered since it is established that when the information is unknown the most conservative method is to adopt this value.
Procedures
Subjects were screened for inclusion in the study via personal interviews. Interview questions collected consisted of health status, medical history, CVD risk factors and lifestyle. After completing another general information questionnaire, participants were instructed to wear shorts and a T-shirt to the physical exam. Once the subjects were barefoot and in their underwear, their body weight (kg) was measured using an electric scale (Model Tanita® BC-420-MA®) with a range of 0–200 kg and with an accuracy of within 100 g. Height was measured with a portable stadiometer with a precision of 0·1 mm and a range of 0–2·50 m (Seca® 213). BMI was calculated using the formula proposed by Quetelet, where BMI = body mass (kg)/height (m2). BMI status was evaluated according to the WHO criteria( 28 ). Waist circumference (WC) was determined by the average of two measurements taken with tape (Lufkin W606PM®) at the waist (at the midpoint between the last rib and the iliac crest). The morphological evaluation process was carried out by a team of professionals (four physical therapy professors) with extensive experience in anthropometric measurement. In all, 2 % of the sample was measured twice to ensure the quality of measures. The technical error of measurement (TEM) values was <2 % for all anthropometric variables.
Body fat percentage, muscle mass and visceral fat level were determined for bioelectrical impedance analysis (BIA) by a tetrapolar whole body impedance (Model Tanita® BC-420-MA®). For the BIA measurements, the subject stood in an upright position with bare feet on the analyser footpads. The impedance between the two feet was measured while an alternating current (50 kHz and approximately 200 μA) passed through the lower body. BIA measures the percentage of the various compartments having the different tissue conductivity in view. The difference between the resistance by non-fat tissue (conductor) and fat tissue (resistant to the passage of microcurrent) on the electric current (bioimpedance) and the difference in density between the two compartments allow a reliable estimate of total adiposity and total lean tissue( Reference Wells and Fewtrell 29 ). All BIA measurements were completed by a trained investigator according to the device manufacturers’ instructions. For the calculation of intra–inter observer TEM, at least fifty subjects needed to be measured in forty-eight adults participated (54 % women). The corresponding intra-observer TEM (percentage reliability) of the measurements was 95 %. A detailed description of the BIA technique can be found elsewhere( Reference Ramírez-Vélez, Correa-Bautista and González-Ruíz 30 ). Then fat mass index (FMI) was calculated by dividing each subject’s fat mass (kg) by square of his/her height (m), as previously described( Reference Liu, Ma and Lou 31 ).
Diastolic and systolic blood pressure were taken with the subject resting for at least 5 min. The participant was seated in a quiet and calm environment with the right arm placed in a semiflexed position at heart level. Blood pressure was measured by an automated procedure using the Omron M5-I monitor (Omron® Healthcare Europe BV). The mean arterial pressure (MAP) was calculated using the following formula: MAP = (systolic blood pressure + (2 × diastolic blood pressure))/3. This equation originates from the work of Gauer who measured intra-arterial iliac pressure in young healthy male subjects at rest( Reference Landois and Rosemann 32 ). The equation is based on the assumption that systole persists for one-third and diastole for two-third of each cardiac cycle.
Biochemical measurements were made by health professional trained for the project to minimise inter-observer variability at the university. Blood samples were taken by puncturing the capillary vein under standardised conditions, between 06.00 and 10.00 hours, with the participant having fasted at least 10–12 h before. The biochemical profile included the following: (i) HDL-cholesterol, (ii) TAG, (iii) LDL-cholesterol, (iv) total cholesterol and (v) glucose fasting by enzymatic colorimetric methods. Inter-assay reproducibility (CV) was determined from eighty replicate analyses of eight plasma pools over a period of 15 d. The percentages obtained were 2·6 % (TAG), 2·0 % (total cholesterol), 3·2 % (HDL-cholesterol), 3·6 % (LDL-cholesterol) and 1·5 % (fasting glucose). TAG:HDL-cholesterol ratio was also calculated.
Muscular strength was assessed using an adjustable digital handgrip dynamometer TKK-18 digital Grip-D dynamometer (Takey®) (range: 5–100 kg; precision: 0·1 kg). The grip span of the dynamometer was adjusted to the hand size of the participant. With the elbow in full extension, the participant had to press the dynamometer with the right hand for at least 2 s. The test was then repeated with the left hand, performed twice and the maximum score for each hand was recorded in kg. The average of the maximum scores for both hands was used in analyses. As there is substantial covariance between strength capacity and body mass, and the link between strength and both physical function and chronic health is directly mediated by the proportion of strength relative to body mass, handgrip strength was normalised as grip strength per body mass, that is, (handgrip strength in kg)/(body mass in kg).
We calculated a composite the MetS score using the sum of the age and sex standardised scores. The MetS score was calculated from the individual subjects’ data, based on the International Diabetes Federation (IDF)( Reference Alberti, Eckel and Grundy 33 ), and standard deviations using data from the entire subject cohort at baseline. The equation used was the MetS score = ((HDL-cholesterol: 40 or 50 mg/dl)/sd × (–1)) + ((TAG: 150 mg/dl)/sd) + ((fasting glucose: 100 mg/dl)/sd) + ((WC: 94 or 80 cm)/sd) + ((MAP: 100)/sd). The mean of this continuously distributed the MetS score was therefore zero by definition. Thereafter, TAG:HDL-cholesterol ratio was calculated.
Participants were considered to have a diagnoses of the MetS if they had three or more of the following: (1) abdominal obesity (WC ≥ 80 cm in females and ≥90 cm in males), (2) hypertriacylglycerolaemia (≥150 g/dl (1·7 mmol/l)), (3) low HDL-cholesterol (<50 mg/dl (1·3 mmol/l) in females and <40 mg/dl (1·0 mmol/l) in males), (4) high blood pressure (systolic blood pressure ≥130 mmHg or diastolic blood pressure ≥85 mmHg) and (5) high fasting glucose (≥100 mg/dl (5·6 mmol/l)). The MetS was defined in accordance with the updated harmonised criteria of the IDF( Reference Alberti, Eckel and Grundy 33 ).
Lifestyle covariates
A standardised questionnaire, the ‘FANTASTIC’ lifestyle (family, physical activity (PA), nutrition, tobacco toxins, alcohol, sleep/stress, personality type, insight, career), was used to collect comprehensive information about substance use via a personal interview with participants. Alcohol consumption and smoking status were defined as subjects who had consumed any alcoholic beverage ≥1 times/week, and those who had smoked ≥10 cigarettes/week, for at least 6 months, as previously described by Ramírez-Vélez et al. ( Reference Ramírez-Vélez and Agredo 34 ). Participants who exercised five times a week for >30 min were categorised as ‘physically active’, and those who exercised less than five times a week were considered physically inactive( Reference Ramírez-Vélez, Triana-Reina and Carrillo 35 ).
Statistical analysis
Descriptive characteristics are provided as means, standard deviations and percentages. Both statistical (Kolmogorov–Smirnov test) and graphical methods (normal probability plots) were used to examine the fit to a normal distribution for each continuous variable. Descriptive data were assessed by the t test, and participants’ characteristics were described as means and standard deviations. The categorical variables were compared using the χ 2 test. To assess the relationship between abnormal body composition and the cardiometabolic risk factors, all study subjects were divided according to quartiles of the MVF ratio (first quartile (Q1 lowest group), second quartile (Q2), third quartile (Q3) and fourth quartile (Q4 highest group)). Each cardiometabolic risk factor among the MVF ratio quartile groups was determined using ANOVA without any adjustment and then after adjusting (ANCOVA) for age and sex.
Receiver operating characteristics (ROC) were calculated to examine the discriminatory ability of the MVF ratio to predict the MetS by the AUC. AUC has been reported to be a global indicator of diagnostic performance since it represents the ability of the test to correctly classify participants with a high risk of the MetS (P-values <0·01 and an AUC >0·80)( Reference Bewick, Cheek and Ball 36 ). Cut-off points were chosen based on Youden index (J), which uses the point on the ROC parameter that is farthest from the line of equality( Reference Rice and Harris 37 ). In addition, the likelihood ratio (LR+ and LR–), and positive and negative predictive values (+PV and –PV, respectively), was also determined and the AUC values were compared. Statistical analyses were performed using SPSS-IBM (Software, version 24.0; SPSS Inc.). A P value of <0·05 was defined as statistically significant.
Results
The lifestyle and lifestyle-related (Table 1) as well as anthropometric, blood pressure and muscular strength characteristics of the participants according to the quartiles of the MVF ratio without any adjustment and then after adjusting for age and sex are reported in Table 2, respectively. Significant differences were found between the four categories for all variables, except the rates of tobacco and alcohol consumption. The subjects in Q1 had lower PA levels and, as expected, a higher prevalence of moderate to severity obesity (BMI ≥30 kg/m2) and hypertension (P <0·0001), Table 1. As expected, for anthropometric variables, body weight, WC and BMI were significantly higher in Q1 subjects than those in Q2, Q3 and Q4 (P <0·0001). Fat mas and muscle mass were significantly higher in Q1 than in Q2 and Q3 (P <0·001), while FMI and visceral fat level were significantly higher in Q1 than in Q2, Q3, and Q4 (P <0·0001). Compared with Q3 and Q4, subjects in Q1 had higher systolic and diastolic blood pressure (Table 2).
Table 1 Lifestyle and lifestyle-related characteristics according to the quartiles (Q) of the muscle mass to visceral fat ratio in 1464 young adults*

PA, physical activity.
* Unadjusted prevalence (crude) of characteristics was analysed using the χ 2 test.
Table 2 Anthropometry, body composition, blood pressure and muscular strength characteristics according to the quartiles (Q) of the muscle mass to visceral fat (MVF) ratio in 1464 young adults* (Mean values and 95 % confidence intervals)
WC, waist circumference; NGS, normalised as grip strength.
* The MVF ratio was divided into quartiles with the following (min–max) values: Q1: 2·62–15·3, Q2: ≥15·3–37·4, Q3: ≥37·4–42·7 and Q4: >42·7–73·3.
† Bonferroni pairwise comparisons.
‡ To compare between groups, all dependent variables were analysed using ANCOVA with adjustment for age and sex as covariates.
Fig. 1 represents the cardiometabolic risk factors according to the MVF ratio quartiles adjusted for age and sex. The levels of total cholesterol, TAG, LDL-cholesterol, glucose, MAP, TAG:HDL-cholesterol ratio and the MetS score were significantly higher in subjects in Q1 than those in Q2, Q3 and Q4 (P <0·001). Conversely, compared with Q2, Q3 and Q4, the subjects in Q1 had lower levels of HDL-cholesterol (P <0·001).
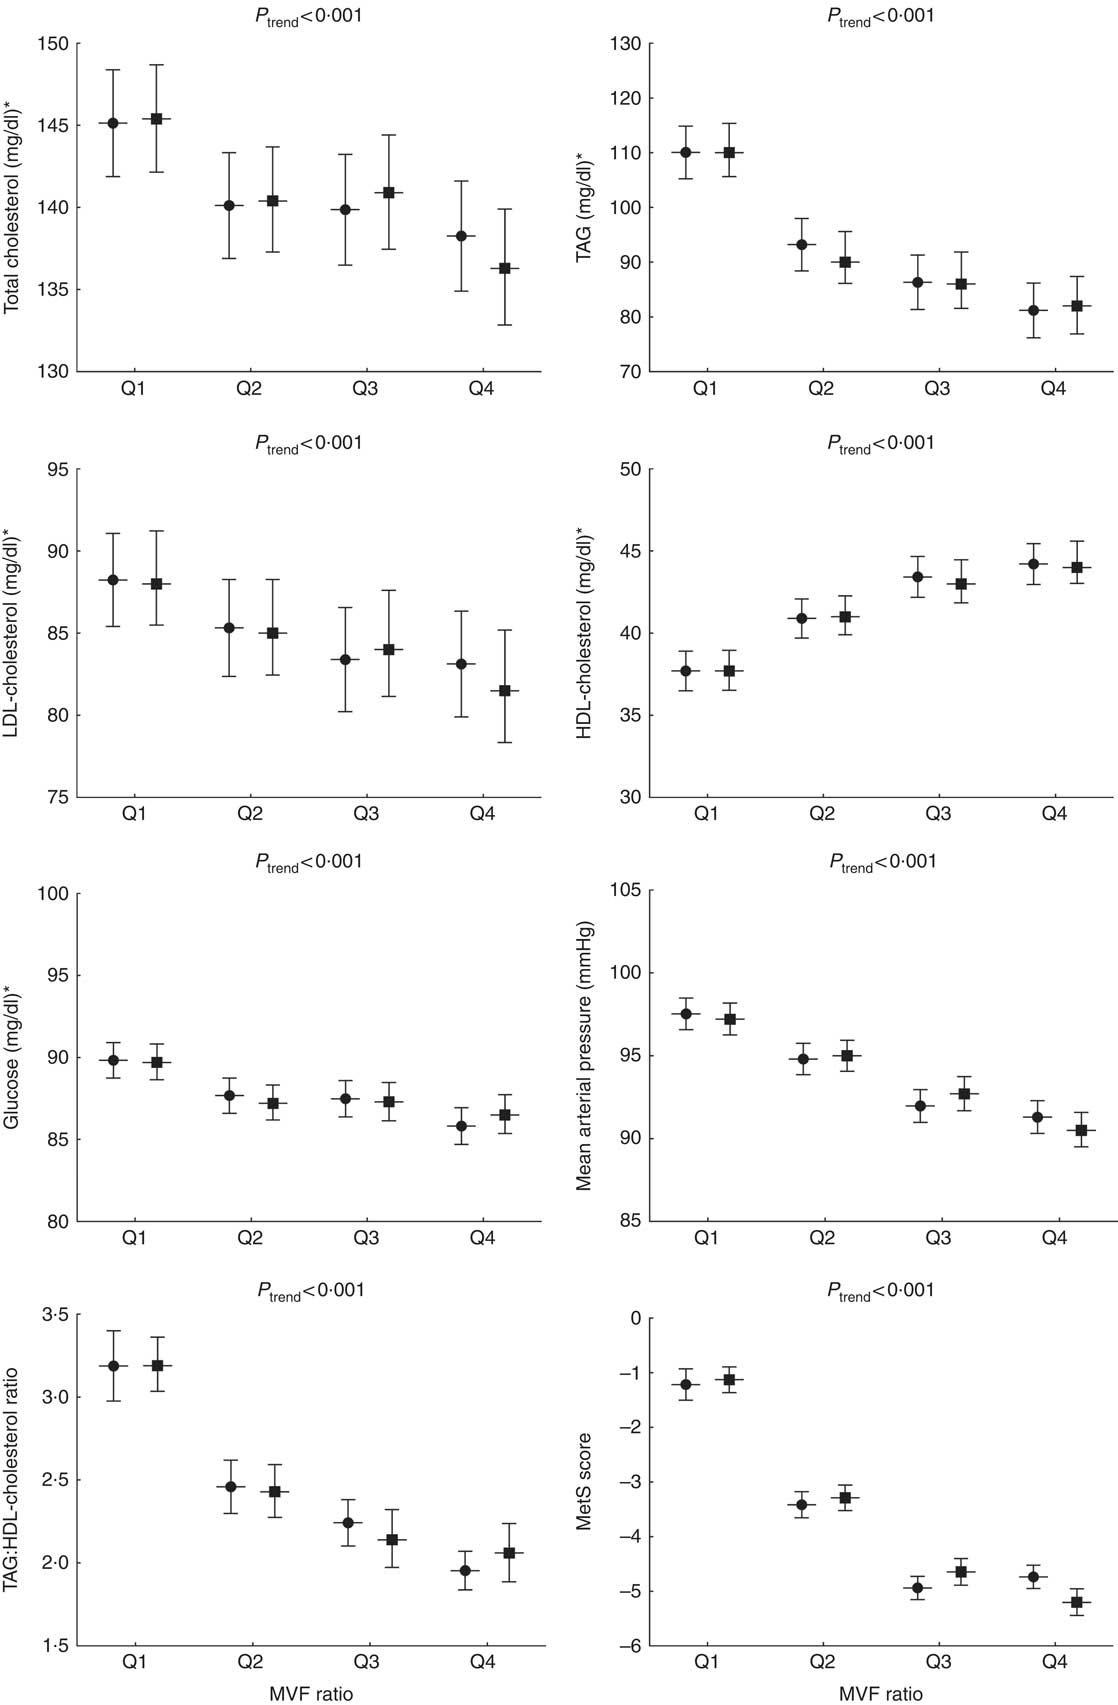
Fig. 1 Cardiometabolic risk factors according to the quartiles (Q) of the muscle mass to visceral fat (MVF) ratio. To compare between groups, all dependent variables were analysed using ANOVA or ANCOVA with adjustment for age and sex as covariates. Bonferroni pairwise comparisons. MetS, metabolic syndrome. ![]() , Unadjusted;
, Unadjusted; ![]() , adjusted. * To convert cholesterol from mg/dl to mmol/l, multiply by 0·0259. To convert TAG from mg/dl to mmol/l, multiply by 0·0113. To convert glucose from mg/dl to mmol/l, multiply by 0·0555.
, adjusted. * To convert cholesterol from mg/dl to mmol/l, multiply by 0·0259. To convert TAG from mg/dl to mmol/l, multiply by 0·0113. To convert glucose from mg/dl to mmol/l, multiply by 0·0555.
The overall prevalence of the MetS was 10·3 %, higher in men than in women (15·2 v. 8·0 %, P <0·001). The prevalence of the MetS according to the MVF ratio quartiles was the following: 32·3 % in Q1, 5·0 % in Q2, 2·2 % in Q3 and 1·9 % in Q4. Significant differences were observed for the MetS across the MVF ratio quartiles (P <0·001) (Fig. 2).
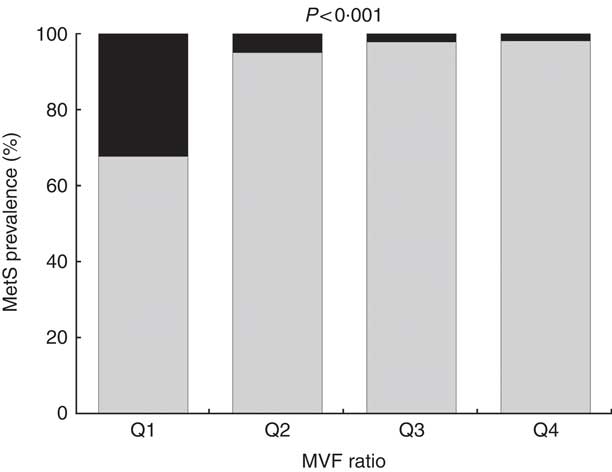
Fig. 2 Prevalence of the metabolic syndrome (MetS) across quartiles (Q) of muscle mass to visceral fat (MVF) ratio. ![]() , Yes;
, Yes; ![]() , no.
, no.
Finally, the ROC curve analyses for the diagnostic performance of the MVF ratio, muscle mass and visceral fat level in identifying a high risk of the MetS are shown in Table 3 and Fig. 3(a) and (b) (MVF ratio). Data on AUC, optimal MVF ratio, muscle mass and visceral fat level cut points for detecting the MetS and diagnostic measures by sex are shown in Table 3. In men, when considering the full sample, the best MVF ratio cut-off point for detecting the MetS according to the IDF was 18·0 (AUC 0·83, sensitivity 78 % and specificity 77 %); for women, the MVF ratio cut-off point was 13·7 (AUC 0·85, sensitivity 76 % and specificity 87 %). As it can be observed, using the MVF ratio in Colombian young adults seems to be the best option, owing to its better accuracy in identifying subjects at high cardiometabolic risk.
Table 3 Diagnostic properties of muscle mass to visceral fat (MVF) ratio, muscle mass and visceral fat level to detect high risk of the metabolic syndrome according to the International Diabetes Federation by sex* (Mean values and 95 % confidence intervals)
* DeLong et al. ( Reference DeLong, DeLong and Clarke-Pearson 55 ) pairwise comparison of receiver operating characteristic curves. Men (muscle mass v. visceral fat level, difference between areas 0·132 (P <0·0001); muscle mass v. visceral fat level, difference between areas 0·129 (P = 0·0002); MVF ratio v. visceral fat level, difference between areas 0·002 (P = 0·6888)) and women (muscle mass v. visceral fat level, difference between areas 0·031 (P = 0·1173); muscle mass v. visceral fat level, difference between areas 0·019 (P = 0·4548); MVF ratio v. visceral fat level, difference between areas 0·012 (P = 0·050)).
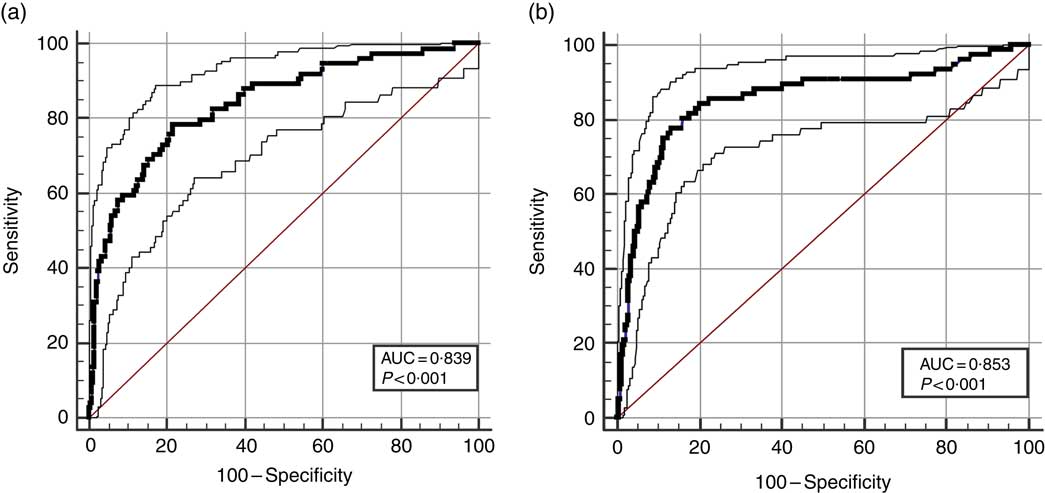
Fig. 3 Diagnostic properties of ratio of muscle mass to visceral fat ratio, muscle mass and visceral fat level to detect high risk of the MetS according to the International Diabetes Federation by sex. (a) Men and (b) women.
Discussion
In this study, we investigated the association between the MVF ratio and several cardiometabolic risk factors adjusted for age and sex in a large population of 1464 college students from Colombia. Although muscle mass and visceral adipose tissue have been independently associated with cardiometabolic health, to the best of our knowledge, the relationship of the MVF ratio with an adverse cardiometabolic profile has not been examined. Our results reveal that the prevalence of moderate to severe obesity, hypertension and the MetS were higher in young adults with a lower MVF ratio. Furthermore, individuals with a lower MVF ratio had higher cardiometabolic disturbances, including altered anthropometry, blood pressure and biochemical parameters compared with young adults in higher MVF ratio quartiles.
To the best of the researchers’ knowledge, this is the first study to investigate the predictive capacity of the MVF ratio with respect to the MetS in a cohort of young people. The MVF ratio thresholds established for detecting a high risk of the MetS were ≤18·0 in men and ≤13·7 in women, with high sensitivity and specificity at the cut-off points for both sexes. In this sense, it was observed that the positive predictive value was low for both sexes (37·4 and 34·3, respectively), suggesting a greater number of false positives. This positive predictive value is directly related to the low prevalence of the MetS in the overall sample (10·3 %). However, a major limitation is that cut-off points can only be applied to populations where the condition has a similar prevalence to the population tested or to individuals with a similar risk of a positive result. This suggests caution be applied in clinical practice, due to population differences that can have a huge impact on their interpretation. Overall, these findings support the idea that the MVF ratio could be used as a complementary screening tool to help clinicians identify young adults at high cardiometabolic risk. In addition, adopting a lifestyle that does not result in a decreased MVF ratio is important to prevent cardiometabolic disease in early adulthood.
The role of muscle mass has been increasingly recognised in the prevention of chronic disease in adult populations( Reference Kim, Han and Han 38 , Reference Kim, Kim and Park 39 ). Evidence suggests that muscle mass and strength decrease progressively after the age of 20 years( Reference Gallagher, Visser and De Meersman 40 ), while in old age, grip and hip strength decline by an average of 1·10 and 1·31 kg/year( Reference Xue, Beamer and Chaves 41 ). Therefore, early adulthood seems to be a crucial time for monitoring and intervention. Muscle mass has been recognised as an independent predictor of risk factors for CVD such as atherosclerosis, diabetes, hypertension and dyslipidaemia( Reference Ayça, Kafadar and Avsar 42 – Reference Kim and Park 44 ). In fact, muscle mass has been elucidated as a predicting factor for cardiometabolic diseases and mortality( Reference Srikanthan and Karlamangla 7 , Reference Srikanthan, Horwich and Tseng 45 ). In agreement with these findings, previous studies of young people have reported an inverse association between muscle mass and the lipid metabolic profile and the MetS risk( Reference Atlantis, Martin and Haren 8 , Reference Kim, Park and Lim 46 , Reference Park and Kim 47 ).
On the other hand, a growing body of evidence suggests that visceral adipose tissue pertaining to insulin resistance may play a relevant role in the development of cardiometabolic risk and the MetS( Reference Yumi, Toru and Shuichiro 14 – Reference Pouliot, Després and Nadeau 20 ). In a 3-year longitudinal study, Shah et al. Reference Shah, Murthy and Abbasi (17) found that visceral adiposity predicts the risk of the MetS, suggesting that this parameter is essential for estimating cardiometabolic risk regardless of age, race or BMI. Similarly, the Hitachi Health Study investigated the effect of longitudinal modifications in visceral fat area (VFA) on the incidence of metabolic risk factors, reporting that more than 50 cm2 change in VFA over a 3-year follow-up period was associated with high TAG and low HDL-cholesterol levels( Reference Matsushita, Nakagawa and Yamamoto 16 ). It should be noted that previous studies found a relationship between visceral adipose tissue and the MetS prediction in populations of children and adolescents( Reference Lee, Kuk and Kim 18 , Reference Druet, Baltakse and Chevenne 19 ).
Visceral adipose tissue is known to play a significant role in the MetS through various pathways( Reference Ibrahim 48 ). Ectopic visceral adipose accumulation can cause metabolic alterations in adipose tissue, such as free fatty acid influx deregulation, oxidative stress( Reference Trayhurn 49 ) or increase in adipokines and pro-inflammatory molecules, which may result in insulin resistance( Reference Kwon, Kim and Kim 50 ). On the other hand, some biological pathways are behind the protective role of muscle mass for cardiometabolic disease risk. Thus, it has been suggested that increased muscle mass might generate a higher basal metabolic rate and greater energy expenditure that may result in reduced visceral adipose tissue and improve cardiovascular risk factors( Reference Ramírez-Vélez, Izquierdo and Correa-Bautista 51 ). This association may provide a possible link regarding the negative effect of high visceral adipose level and low muscle mass on the Mets components or prevalence. Therefore, the inverse relationship between MVF ratio and cardiometabolic risk does not seem spurious because muscle quality (strength per unit of muscle size or mass) and central adiposity are considered an underlying risk factor in this cluster.
As far as we are aware, our study is the first to examine the effect of decreased muscle mass and increased visceral fat on the cardiometabolic profile, suggesting that a lower MVF ratio is associated with high cardiometabolic risk in a large cohort of Colombian college students. The effect on other indices, such as the ratio of skeletal muscle mass to visceral fat area (MFR) and visceral fat to thigh muscle area (VMR) on metabolic disturbances, has been previously established( Reference Kim, Park and Lim 46 , Reference Lim, Yang and Kim 52 ). Consistent with our findings, in the Korean Sarcopenic Obesity Study, MFR( Reference Kim, Park and Lim 46 ) and VMR( Reference Lim, Yang and Kim 52 ) showed independent relationships with the MetS and arterial stiffness. The fact that previous studies analysing other indexes such as MFR and VMR on metabolic disturbances were conducted in a population consisted of Korean adults aged 20–88 years old and our study cohort included only young adults (18–30 years) make it difficult to compare the results. Therefore, future research investigating the influence of other indices that include lean muscle mass or total adipose tissue in a specific population of young adults would be on special interest.
Our findings have clinical significance as we evidence the importance of including muscle mass and visceral fat testing in health-monitoring systems in early adulthood for the primary prevention of cardiometabolic disorders. We propose the use of the MVF ratio as a complementary assessment measure that may be useful for clinicians. Considering that the MetS is considered important public health problems, this study is especially relevant since it provides a novel tool for the early identification of these health issues.
This study has certain limitations. Due to its cross-sectional design, no causal conclusions can be drawn. Therefore, longitudinal studies are necessary to determine any effect of a decreased MVF ratio on cardiometabolic risk factors. In addition, the gold standard for the assessment of visceral fat is MRI and computed tomography. However, in this study, visceral fat measurement was assessed by BIA that, although is a highly reliable device, provided an indirect measure( Reference Leong, Teo and Rangarajan 53 ). Finally, although in this study we evaluate a new index of the MetS using the ratio of MVF, we did not examine skeletal muscle index (%; total skeletal muscle mass (kg)/weight (kg) × 100) or visceral adipose tissue/area index as potential indicators of the MetS in young adults( Reference Buehring, Siglinsky and Krueger 54 ). Despite these limitations, the major strength of this study is that since the data were collected from a community-based cohort, our study population comprises a important cohort of young adults in Colombia. Furthermore, highly standardised procedures have been developed within the FUPRECOL study to avoid measurement bias.
In conclusion, this community-based population study demonstrates that young adults with a lower MVF ratio exhibit increased cardiometabolic risk, after covariate adjustments, supporting the idea that the MVF ratio may serve as a marker for assessing cardiometabolic disease in young people. In addition, this study proposes the first cut-off points for use in clinical practice to predict the MetS risk in early adulthood. Considering the public health importance of the high prevalence of the MetS in young adults, this study is especially relevant as it provides a novel tool for use in a clinical setting.
Acknowledgements
The authors gratefully acknowledge the contributions of Carolina Sandoval-Cuellar and Monica Liliana Ojeda, Boyacá University who assisted the authors with obtaining data. The authors also acknowledge Pilar Castellanos, Boyacá University, for assistance with data analysis.
This study was part of the project entitled ‘Body Adiposity Index and Biomarkers of Endothelial and Cardiovascular Health in Adults’, which was funded by Centre for Studies on Measurement of Physical Activity, School of Medicine and Health Sciences, Universidad del Rosario (Code N° FIUR DN-BG001) and Universidad de Boyacá (Code N° RECT 60). The funder had no role in the study design, data collection, data analysis and interpretation, preparation of the manuscript or decision to publish.
J. E. C.-B., R. R.-V., D. H. P.-B., A. C. Q.-A., C. M. R.-B. and A. G.-H. conceived and designed the experiments. K. G.-R., H. A. C. and R. R.-V. performed the experiments. M. C.-R., J. S. R.-V. and E. G.-J. contributed reagents/materials/analysis tools. R. R.-V. and A. G.-H. analysed the data. M. C.-R., R. R.-V., E. G.-J. and J. S. R.-V. contributed to the writing of the manuscript. All authors read and approved the final manuscript.
The authors declare that there are no conflicts of interest.


