


Food labelling represents one of the principal tools for food companies to communicate with consumers at the time of purchase. Over the years, messages reported on the pack drastically increased with the aim to inform consumers about the product characteristics and nutritional qualities. This phenomenon has created a complex and crowded label environment in which a wide number of claims coexist. Regarding facts made on foods, the European Commission specifically regulates information that must be provided to consumers, such as the list of ingredients and the nutrition declaration (Regulation (EU) n. 1169/2011)(1). Moreover, the European Commission strictly supervises other declarations, such as nutrition and health claims (NHC), which can be provided on the pack on a voluntary basis (Regulation (CE) n. 1924/2006) and which state about beneficial nutritional properties (e.g. ‘rich in fibre’) or relationships between food and health (e.g. ‘contributes to the maintenance of normal blood cholesterol levels’)(2). In this context, NHC could play a key role in enabling consumers to make healthier food choices(Reference Benson, Lavelle and Bucher3,Reference van Trijp and van der Lans4) . However, it has been reported that NHC may not directly predict the overall nutritional quality of products(Reference Schaefer, Hooker and Stanton5) or paradoxically overestimates their healthiness(Reference Kaur, Scarborough and Rayner6,Reference Roe, Levy and Derby7) and subsequently increases the consumption of products bearing claims(Reference Calfee and Pappalardo8–Reference van Buul and Brouns10). Likewise, products carrying gluten-free (GF) declaration (as defined by the Regulation (EU) n. 828/2014)(11) are gaining interest from non-coeliac consumers due to the perception of a better nutrition profile than the gluten-containing (GC) counterpart, although evidence describes an equivalent or even lower quality of GF than GC products(Reference Calvo-Lerma, Crespo-Escobar and Martínez-Barona12,Reference Morreale, Angelino and Pellegrini13) . As a result, consumers’ perception of product quality and, in turn, their intention to buy is affected by the sum of these factors(Reference Shangguan, Afshin and Shulkin14). Therefore, the messages claimed on the pack may have a dual and opposite role: (1) to become a platform for implementing specific health-related policies for informing and educating consumers and, in turn, influencing industry practices and (2) to generate a misleading scenario, becoming an easy tool for marketing.
Certainly, the nutritional quality of food products is a result of several factors, which may be only partially described by NHC as well as other messages on specific characteristics, as this information generally focuses on one or more food components and not on the overall quality of the product. Previous reports focused on the quality of products sold in different markets worldwide; however, only few of them specifically compared the nutritional quality based on specific characteristics such as the presence of NHC(Reference Kaur, Scarborough and Matthews15) or GF declaration(Reference Calvo-Lerma, Crespo-Escobar and Martínez-Barona12,Reference Morreale, Angelino and Pellegrini13,Reference Cornicelli, Saba and Machello16) . Despite this limited and preliminary evidence, the appropriateness of using specific characteristics on the food pack for describing the nutritional quality of food products needs to be fully investigated.
Cereal-based products represent one of the most consumed foods, not only in Italy(Reference Leclercq, Arcella and Piccinelli17) but also worldwide(18). Nutrition information (e.g. NHC, GF declaration) may have a large application on this food group, due to its nutritional composition(Reference Hieke, Kuljanic and Pravst19). So far, the nutritional quality of cereal based-food products sold on the Italian market, based on the characteristics of products (e.g. type) or declarations (e.g. GF or presence of NHC), has not yet been comprehensively and systematically described.
Therefore, the aims of the present study were: (i) to investigate the nutritional quality of two categories of sweet cereal-based products (biscuits and sweet snacks), collecting their nutrition declarations from packaging, and (ii) to compare their energy, nutrient and salt contents based on different characteristics (type of product, presence/absence of NHC, GF declaration). This work is part of the Food Labelling of Italian Products (FLIP) study that aims at systematically investigating the overall quality of the prepacked foods sold on the Italian market(Reference Angelino, Rosi and Dall’Asta20–Reference Angelino, Rosi and Vici22).
Materials and methods
Food product selection
Foods from two categories (i.e. biscuits and sweet snacks) were analysed. Products were selected from the home-shopping website of thirteen retailers present on the Italian market (Auchan, Bennet, Carrefour, Conad, Coop Italia, Crai, Despar, Esselunga, Il Gigante, Iper, Pam Panorama, Selex, Sidis).
Online search for food products was performed from July 2018 until December 2018. All the items present in the two categories of interest in each online shop were considered eligible for data extraction.
The exclusion criteria were: (i) not prepacked foods, (ii) incomplete images of all the sides of the pack, (iii) unclear images of nutrition declaration and/or list of ingredients and (iv) products marked ‘currently unavailable’ on all the online stores.
Data extraction
Images of all the sides of each pack were collected for all included products. For each food item, the following specifically regulated (mandatory) quali-quantitative information was retrieved: company name, brand name, descriptive name, energy (kcal/100 g), total fat (g/100 g), saturates (g/100 g), carbohydrate (g/100 g), sugars (g/100 g), protein (g/100 g) and salt (g/100 g). Moreover, the following voluntary declarations were collected: NHC (presence or absence of at least one nutrition or health claim) and GF declaration (either ‘specifically formulated for coeliacs’ or ‘containing gluten’).
The precision of extracted data was double-checked by two researchers, and inaccuracies were solved through secondary extractions.
A dataset was created with all the collected data, grouping products into the two categories of interest: biscuits and sweet snacks. Items were further sub-grouped for specific comparisons, considering (i) the descriptive name reported, (ii) the presence/absence of GF declaration and (iii) the presence/absence of NHC declaration. Based on the descriptive name, biscuits were divided in six types (tea cookies, short-bread biscuits, cream-filled wafer, covered and/or sandwich cookies, Italian traditional biscuits (e.g. cantucci and amaretti) and other biscuits); similarly, sweet snacks were grouped in six types (cream-filled sponge cake, plain or cream/jam-filled croissant or pain au chocolat, yogurt plumcake and muffin, sponge cake, cream/jam-filled shortbread cake, cream-filled and/or covered chilled snack).
Statistical analysis
Statistical analysis was carried out using the Statistical Package for Social Sciences software (IBM SPSS Statistics, version 25.0, IBM Corp.) and performed at P < 0·05 of significance level. The normality of data distribution was rejected through the Kolmogorov–Smirnov test, and variables were expressed as median (IQR).
Data regarding energy, nutrients and salt content per 100 g of a product for each product category were analysed to explore differences using the Kruskal–Wallis non-parametric one-way ANOVA for independent samples with multiple pairwise comparisons (for differences among types and GF declaration categories) and using the Mann–Whitney non-parametric test for two independent samples (for differences between nutrition claim categories and health claim categories). In addition, a principal component analysis (PCA) with varimax rotation was performed for all products and by each product category considering energy, nutrients and salt content per 100 g of a product to better describe the inter-product nutrition variability.
Results
A total of 1483 sweet cereal-based products were identified during the online search performed from July 2018 until December 2018. These products included 961 items for biscuits and 522 for sweet snacks categories. After applying the exclusion criteria, a total of 1290 products were eligible for data extraction, of which 63 % (n 814) were biscuits and 37 % (n 476) were sweet snacks.
Values of energy, nutrients and salt content (g/100 g) for each category, with statistical comparison by category, are presented in Tables 1 and 2. Energy, nutrients and salt contents showed a high variability among the considered product categories. The total median energy was 471 (449–489) and 408 (387–427) kcal/100 g for biscuits and sweet snacks, respectively. Total carbohydrates were the most representative macronutrient in biscuits (57 % of energy) and sweet snacks (53 % of energy), with sugars accounting for 36 % of the total carbohydrates in biscuits and 53 % in sweet snacks. Total fat contributed to the energy content as follows: 41 % for sweet snacks and 37 % for biscuits, with saturates covering 37 % of total fat for sweet snacks and 30 % for biscuits.
Table 1 Energy, macronutrients and salt contents in the biscuit category*
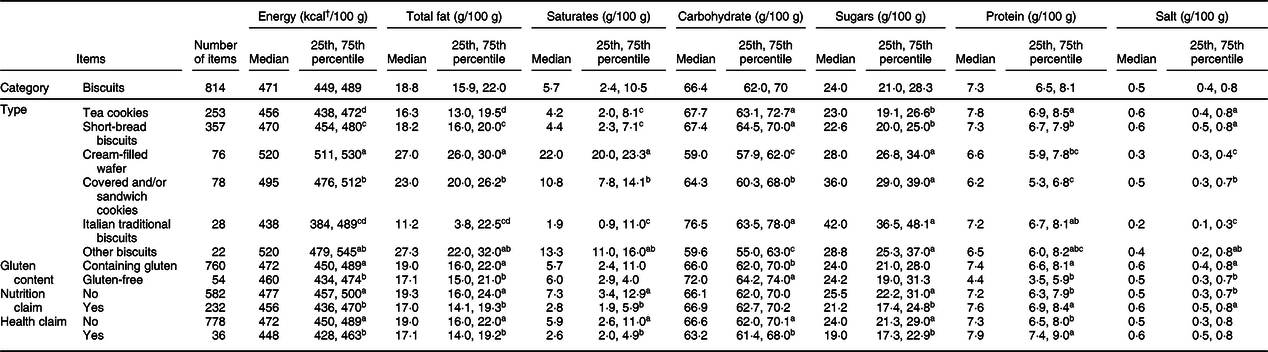
* For each category item, different lowercase letters in the same column indicate significant differences (Kruskal–Wallis non-parametric one-way ANOVA for independent samples with multiple pairwise comparisons; Mann–Whitney non-parametric test for two independent samples), P < 0·05.
† To convert kcal to kJ, multiply energy values by 4·184.
Table 2 Energy, macronutrients and salt contents in the sweet snack category*
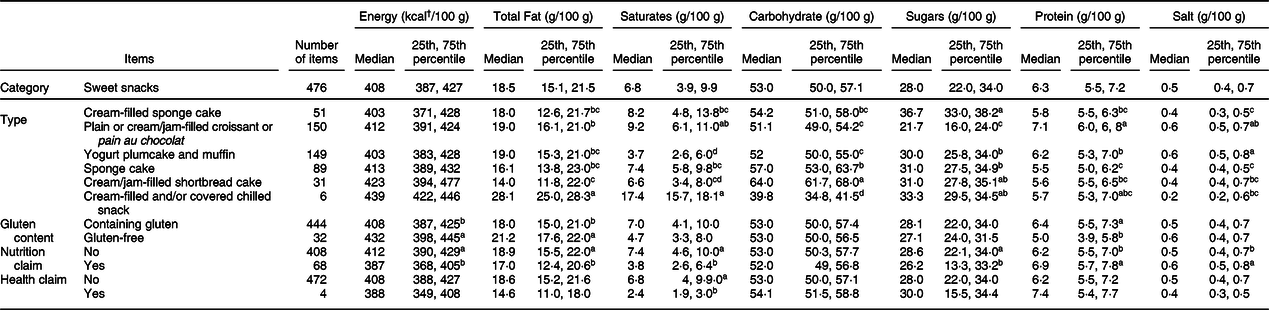
* For each category item, different lowercase letters in the same column indicate significant difference (Kruskal–Wallis non-parametric one-way ANOVA for independent samples with multiple pairwise comparisons; Mann–Whitney non-parametric test for two independent samples), P < 0·05.
† To convert kcal to kJ, multiply energy values by 4·184.
Inter-product variability was described by three principal components (PC), which explained 73 % of variation among products (Fig. 1). PC1 accounted for 33 % of total variability and was positively loaded by energy, total fat and saturates. PC2 explained 21 % of variability and had positive loadings from protein and salt and a negative loading from sugars. The remaining 19 % of variability was explained by PC3, which was positively loaded by carbohydrates. The two product categories presented an overlap due to a high variability in terms of nutrition profile among products within the same category. However, product categories were grouped based on their carbohydrate content (positive scores for PC3, Fig. 1(c) and (d)) as well as on their energy, total fat and saturate contents (positive scores for PC1, Fig. 1(a) and (b)), all being higher in biscuits than in sweet snacks.
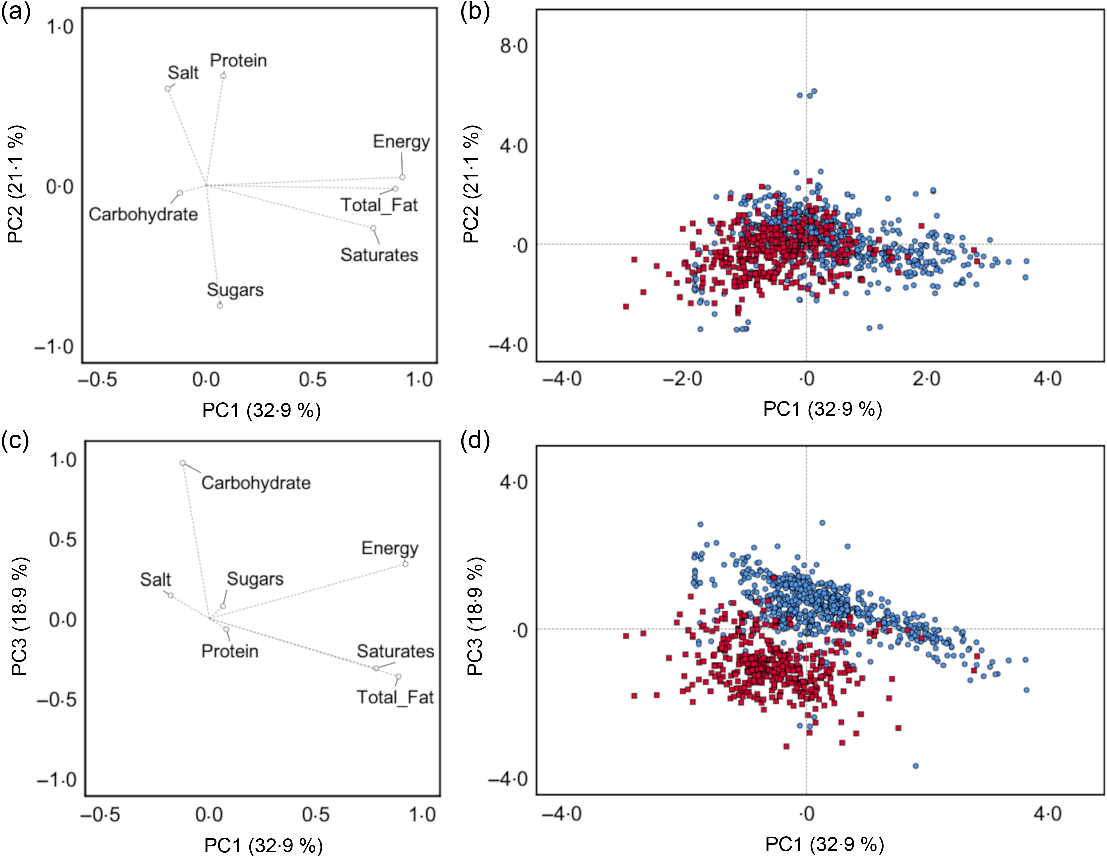
Fig. 1 Principal component (PC) analysis describing the intra-category variability of products based on their nutrient composition (energy (kcal/100 g), total fat (g/100 g), saturates (g/100 g), carbohydrate (g/100 g), sugars (g/100 g), protein (g/100 g) and salt (g/100 g)). Loading plots of PC1 v. PC2 (a) and PC1 v. PC3 (c); score plots of the nutrient composition of each product analysed within each category (biscuits and sweet snacks) from PC1 and PC2 (b) and PC1 and PC3 (d). (b, d) ![]() , sweet snacks;
, sweet snacks; ![]() , biscuits
, biscuits
Biscuits
The energy content of the biscuit category significantly varied across the types of products (P < 0·001), from a median of 438 kcal/100 g (384–489) for Italian traditional biscuits to 520 kcal/100 g (511–530) for cream-filled wafer and 520 kcal/100 g (479–545) for other biscuits (Table 1). Accordingly, the cream-filled wafer type showed the highest content of total fat and saturates and the lowest of carbohydrates. Items specifically formulated for coeliacs had lower total energy than GC products (P < 0·001) as a consequence of lower total fat content (P = 0·019) although higher in total carbohydrates (P < 0·001). For biscuits carrying a nutrition or health claim, lower contents of total energy (P < 0·001 and P < 0·001, respectively), total fat (P < 0·001 and P = 0·002, respectively), saturates (P < 0·001 for both), carbohydrates (P = 0·021 only for health claim) and sugars (P < 0·001 and P < 0·001, respectively) were identified, while protein was higher (P < 0·001 and P = 0·002, respectively) than the non-claiming counterparts. Finally, the salt content in products with at least one nutrition claim was significantly higher compared to products without claims (P < 0·001).
A high inter-product variability was observed among the biscuit types (Fig. 2(a) and (b)), estimated at 67 % (45 and 22 %, respectively by PC1 and PC2). Energy, total fat and saturates were the main loadings positively associated with PC1, while the carbohydrate content was negatively associated with PC1. PC2 had a positive component loading from sugars and a negative load from protein and salt (Fig. 2(a)). As reported in Fig. 2(b), the score plot shows a good separation among some biscuit types. In particular, the cream-filled wafers grouped well, even if partially overlapping with other biscuit types. These products showed the highest score for PC1, related to high energy, total fat and saturates. On the contrary, tea cookies and short-bread biscuits were very similar, presenting a comparable quantity of protein and a low sugar content (i.e. most of them presented negative PC2 scores), and wide differences in energy and total fat. Other biscuit types were scarcely represented and showed a high inter-product variability.
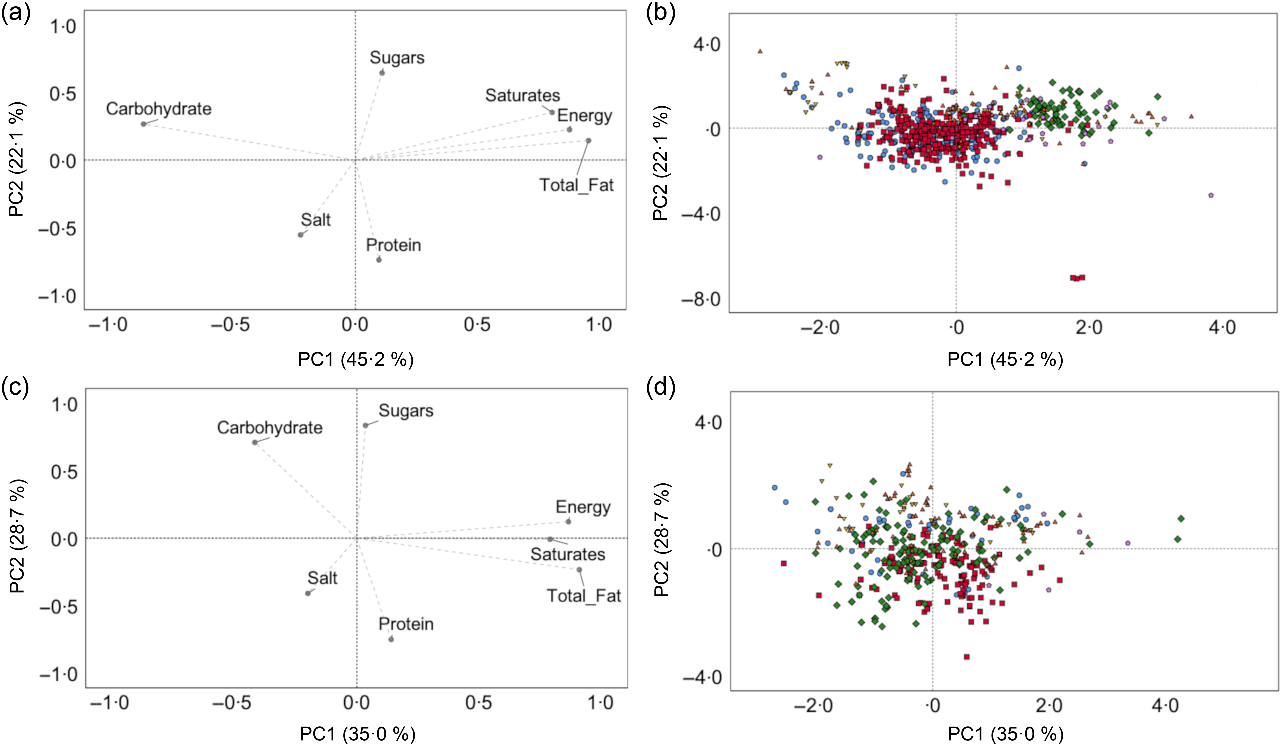
Fig. 2 Principal component (PC) analysis describing the inter-product variability within each group of products based on their nutrient composition (energy (kcal/100 g), total fat (g/100 g), saturates (g/100 g), carbohydrate (g/100 g), sugars (g/100 g), protein (g/100 g) and salt (g/100 g)). Loading plots of PC1 v. PC2 in biscuits (a) and sweet snacks (c); score plots of the nutrient composition of each product analysed within each category of products from PC1 and PC2 for biscuits (b) and sweet snacks (d). (b) ![]() , tea cookies;
, tea cookies; ![]() , short-bread biscuits;
, short-bread biscuits; ![]() , cream-filled wafer;
, cream-filled wafer; ![]() , covered and/or sandwich cookies;
, covered and/or sandwich cookies; ![]() , Italian traditional biscuits;
, Italian traditional biscuits; ![]() , other biscuits. (d)
, other biscuits. (d) ![]() , cream-filled sponge cake;
, cream-filled sponge cake; ![]() , plain or cream/jam-filled croissant or pain au chocolat;
, plain or cream/jam-filled croissant or pain au chocolat; ![]() , yogurt plumcake and muffin;
, yogurt plumcake and muffin; ![]() , sponge cake;
, sponge cake; ![]() , cream/jam-filled shortbread cake;
, cream/jam-filled shortbread cake; ![]() , cream-filled and/or covered chilled snack
, cream-filled and/or covered chilled snack
Sweet snacks
Although no differences were identified among the sweet snack types for energy content, they varied from a median of 403 kcal/100 g (371–428) for cream-filled sponge cake and 403 kcal/100 g (383–428) for yogurt plumcake and muffin, to a median of 439 kcal/100 g (422–446) for cream-filled and/or covered chilled snack (Table 2). On the contrary, differences among sweet snack types were found for total fat (P < 0·001), saturates (P < 0·001), carbohydrates (P < 0·001), sugars (P < 0·001) and protein (P < 0·001). The cream-filled and/or covered chilled snacks were characterised by higher total fat content and saturates and lower carbohydrates compared to other types. The yogurt plumcake and muffin type had the lowest content of saturates, while the lowest amount of sugars was found for plain or cream/jam-filled croissant or pain au chocolat. Products specifically formulated for coeliacs were higher in energy (P = 0·016) than the GC counterparts, due to their higher content of total fat (P = 0·009). Energy (P < 0·001), total fat and saturates (P = 0·001 and P < 0·001, respectively) and sugars (P = 0·002) were significantly lower in sweet snacks with a nutrition claim, while they had higher protein (P = 0·011) and salt (P = 0·004) contents than their counterparts. Finally, the presence of a health claim did not affect the overall nutritional quality of products, but saturates were lower in products with claims (P = 0·004) compared to those without claims.
Concerning differences in energy, nutrients and salt contents among product types, PC1 (35 %) and PC2 (29 %) accounted for 64 % of total variability, as shown in Fig. 2(c). Energy, total fat and saturates had a great weight on PC1, while PC2 was positively loaded by carbohydrates and sugars and negatively loaded by protein amount (Fig. 2(d)). Overall, the surveyed products showed high heterogeneity in their nutrition profiles and no clear groups were observed within the sweet snack category (Fig. 2(d)).
Discussion
To our knowledge, this is the first survey investigating the nutritional quality of a wide range of biscuits and sweet snacks sold on the Italian market.
Using the mandatory nutrition information on the package, biscuit and sweet snack categories were well grouped. This may be because each category is a combination of specific technological processes and ingredients used for their formulation. However, a high intra-category heterogeneity within both categories was observed, more pronounced for biscuits. A high variability in nutrition profile was also described by previous studies focusing on selected product categories (e.g. biscuits, snacks or yogurts) or on specific nutrients (e.g. salt, sugars or energy)(Reference Goglia, Spiteri and Menard23–Reference Pombo-Rodrigues, Hashem and He27).
Comparing products with and without GF declarations, differences in nutrient contents emerged in both considered categories. These differences did not allow us to conclude whether GF products would have a better nutrition profile than the CG counterparts. Our results are partially in line with previous studies evaluating the nutritional quality of GF bakery products currently present on Italian and other markets. Overall, these data suggest that, despite the consumers’ perception of healthier attributes, GF products may not present a better nutrition profile than GC products(Reference Calvo-Lerma, Crespo-Escobar and Martínez-Barona12,Reference Morreale, Angelino and Pellegrini13,Reference Cornicelli, Saba and Machello16) .
After comparing products with and without nutrition claims, an overall, more favourable nutrition profile emerged for biscuits and sweet snacks carrying a claim. An exception was found for the higher salt content in both categories carrying a nutrition claim than the counterparts. Moreover, positive, despite limited, differences were observed between products with and without health claims, mostly in the biscuit category. Contrasting results have been previously reported on the role of NHC as a marker of the overall nutritional quality of food products. For instance, a wide range of NHC products sold in the United Kingdom, including cereal-based products, resulted in a slightly better nutrition profile (lower in total fat and saturates) than products not carrying NHC(Reference Kaur, Scarborough and Matthews15). Conversely, a low relationship emerged between the front-of-pack labelling and the nutritional quality (determined by energy, sugar and sodium contents) in some products on the Mexican market(Reference Nieto, Rincon-Gallardo Patino and Tolentino-Mayo28). Another study evaluating different food categories, such as cereal-derived items, sold in the Slovenian market supports the overall poor nutrient profiles of products carrying health claims(Reference Pivk Kupirovic, Miklavec and Hribar29). Similarly, a report focusing on the US market also described that front-of-pack claims do not allow to distinguish ‘healthy’ food, although sometimes they may predict higher or lower levels of key nutrients(Reference Schaefer, Hooker and Stanton5). Finally, other studies suggest that the consistency between health-related information on the pack and the real overall nutritional values of the product may be increased by implementing a nutrient profiling scheme(Reference Hughes, Wellard and Lin30,Reference Maschkowski, Hartmann and Hoffmann31) . Based on these findings, claims might be paradoxically misleading about the overall nutritional quality of foods, hindering the consumers’ ability to select healthier foods(Reference Schaefer, Hooker and Stanton5,Reference Taillie, Ng and Xue32) . Thus, all these studies highlight the need to pay attention to the overall nutrition profiles of NHC-carrying products, as well as on the way of presenting information in the front-of-pack. In this framework, it has been suggested that a simple and colour-coded front-of-pack can be an easy tool for discriminating the nutritional quality of foods for supporting consumers in making healthier food choices(Reference Cecchini and Warin33,Reference Emrich, Qi and Lou34) .
In general, a major strength of this study is related to the wide number of products analysed. These products were selected from major Italian retailers and included the majority of biscuits and sweet snacks sold in Italy. However, a small number of items with specific declarations (e.g. health claims) was found during our online search. This may be due to a low penetration of specific information (e.g. NHC or GF), as previously described(Reference Storcksdieck genannt Bonsmann, Celemín and Larrañaga35). This could have generated a possible bias in the interpretation of results. Moreover, in this study we did not include either data from discounts that generally do not have online stores, or from other commercial channels (e.g. vending machines, cafés or pharmacies especially for GF products). Despite these limitations, to the best of our knowledge, this is the first study reporting on the nutritional quality of a broad range of sweet cereal-based products sold on the Italian market. Overall, focusing on the mandatory information, a high variability was described for the products analysed. This supports the importance of reading and understanding the label before selecting a product, rather than choosing a specific category of products and excluding others. No clear conclusion could be drawn regarding the quality of GF products as they presented contrasting results within the categories. Nutrition claims seem to be linked to a better quality of products, even though results highlighted the importance of reformulating them for reducing the salt content. No clear conclusion could be drawn for health claims due to the limited number of samples analysed.
Finally, considering the importance declarations may have on consumers’ intention-to-buy, specific actions are needed by stakeholders, researchers and government representatives to improve the harmonisation and simplification of food labelling. Moreover, targeted nutrition education programmes for consumers can represent an essential tool for a better comprehension of the nutritional characteristics of products and food labelling.
Conclusion
The present study represents a thorough evaluation of the nutritional quality of prepacked biscuits and sweet cereal snacks sold on the Italian market, by taking into account different characteristics and regulated information on the pack. Thus, an analysis of the nutrition profiles of these categories based on the information reported on the package may be useful for implementing strategies for ameliorating the overall quality of the diet. Future studies are needed to further investigate the nutritional quality of food products present on the Italian market. These studies should include other cereal-based categories as well as other food groups. Consequently, these findings will elucidate if specific food characteristics or declarations might be used as markers of the overall quality of food products. This could support consumers in their purchasing process, without neglecting the importance of nutrition education programmes that are mandatory to improve consumers’ food and nutrition literacy and consequently food choices.
Acknowledgements
Acknowledgements: The authors wish to thank all students who participated in the development of the dataset. Financial support: This research received no specific grant from any funding agency, commercial or not-for-profit sectors. Conflict of interest: None. Authorship: M.D., A.R. and D.A. were involved in protocol design, data analyses, interpretation of results and drafting of manuscript; N.P. participated in protocol design and critically reviewed the manuscript; D.M. designed the study protocol, performed data analyses, interpreted the results, critically reviewed the manuscript and had primary responsibility for the final content. All authors read and approved the final manuscript. Ethics of human subject participation: Ethical approval was not required.


