


Introduction
A link between species diversity and habitat diversity was first reported more than a half-century ago (MacArthur, Reference MacArthur1958, Reference MacArthur1964) and was further supported for a variety of plant and animal species (Lawton, Reference Lawton1983; Rosenzweig, Reference Rosenzweig1995; Tews et al., Reference Tews, Brose, Grimm, Tielbörger, Wichmann, Schwager and Jeltsch2004). Given that hosts represent the ultimate habitats for a majority of parasite taxa, it is thus not surprising that studies of the effects of host diversity on parasite diversity have reported strong positive associations between them (Watters, Reference Watters1992; Krasnov et al., Reference Krasnov, Shenbrot, Khokhlova and Degen2004a; Thieltges et al., Reference Thieltges, Hof, Dehling, Brändle, Brandl and Poulin2011; Kamiya et al., Reference Kamiya, O'Dwyer, Nakagawa and Poulin2014). However, parasite diversity is determined not only by host diversity, but also by environmental factors (e.g. Adlard et al., Reference Adlard, Miller and Smit2015). In other words, parasite species composition results from an interplay between host species composition and environment. This is especially true for ectoparasites because they are affected by both hosts and the external off-host environment (Marshall, Reference Marshall1981). Obviously, compositional diversity is not the only component of species diversity. Phylogenetic diversity is no less important because it represents an evolutionary measure of biodiversity that may or may not be reflected by compositional diversity (Miller et al., Reference Miller, Jolley-Rogers, Mishler and Thornhill2018). Although phylogenetic methods are now broadly applied in parasitological studies (Bass et al., Reference Bass, Stentiford, Littlewood and Hartikainen2015; Selbach et al., Reference Selbach, Jorge, Dowle, Bennett, Chai, Doherty, Eriksson, Filion, Hay, Herbison, Lindner, Park, Presswell, Ruehle, Sobrinho, Wainwright and Poulin2019), investigations of the patterns of phylogenetic diversity in parasites are still more scarce than those of free-living taxa (but see Clark, Reference Clark2018; Krasnov et al., Reference Krasnov, Shenbrot, van der Mescht, Warburton and Khokhlova2019a, Reference Krasnov, Shenbrot, Korallo-Vinarskaya, Vinarski, Warburton and Khokhlova2019b; Llopis-Belenguer et al., Reference Llopis-Belenguer, Pavoine, Blasco-Costa and Balbuena2020).
One of the main questions asked in studies on parasite diversity is whether it is mainly driven by host diversity or environmental factors. The majority of studies on compositional parasite diversity have suggested that the effect of host diversity was more important than that of environmental variation. For example, the diversity of helminth parasites of amphibians, at the global scale, was found to be affected by both precipitation seasonality and host richness, with the effect of the latter being stronger (Martins et al., Reference Martins, Poulin and Gonçalves-Souza2021). The meta-analysis of Kamiya et al. (Reference Kamiya, O'Dwyer, Nakagawa and Poulin2014) convincingly demonstrated that parasite species richness is strongly correlated with that of their hosts. A study on fleas in northern and central Eurasia suggested that the drivers of flea community composition were scale-dependent, with host composition playing the main role on the continental scale, whereas the effect of environment was more important on the regional scale (Krasnov et al., Reference Krasnov, Shenbrot, Khokhlova, Stanko, Morand and Mouillot2015). In contrast to compositional diversity, the drivers of parasites' phylogenetic diversity have been poorly studied. Nevertheless, it appeared that the relative effects of host phylogenetic diversity and environment on parasite diversity could vary between geographic regions, even in the same parasite taxon. Among the drivers of the phylogenetic diversity of regional flea assemblages within each of 4 biogeographic realms (the Afrotropics, the Nearctic, the Neotropics and the Palaearctic), host phylogenetic diversity played the most important role in the Palaearctic only, whereas the effect of environment was weak, although the opposite was true for the Afrotropics and the Nearctic (Krasnov et al., Reference Krasnov, Shenbrot, van der Mescht, Warburton and Khokhlova2019a). The latter study dealt with phylogenetic alpha-diversity. Phylogenetic beta-diversity (i.e. dissimilarity in phylogenetic composition between communities) may respond to factors other than compositional beta-diversity. Furthermore, it is unknown whether the drivers of phylogenetic beta-diversity of the same parasite taxon vary between geographic regions or whether these drivers are geographically invariant, as is the case with parasite compositional beta-diversity. In fact, dissimilarity in host species composition, across regions in all 4 aforementioned biogeographic realms, was the most important factor affecting the compositional dissimilarity of flea assemblages, whereas environmental effects were weaker (Krasnov et al., Reference Krasnov, Shenbrot, van der Mescht and Khokhlova2020). A similar pattern has been reported for chiropterans and their bat fly parasites (Eriksson et al., Reference Eriksson, Doherty, Fischer, Graciolli and Poulin2019). The results of 2 studies on the phylogenetic beta-diversity of fleas were obtained at a relatively small scale (Krasnov et al., Reference Krasnov, Shenbrot, Korallo-Vinarskaya, Vinarski, Warburton and Khokhlova2019b; Maestri et al., Reference Maestri, Shenbrot, Warburton, Khokhlova and Krasnov2020) and do not allow answering the question about the geographic variation of predictors of parasite phylogenetic turnover at a large scale.
Elucidating the relationships between the beta-diversities (whether compositional or phylogenetic) of 2 different taxa or between beta-diversity and environment is essentially a test of the relationships between either species (or phylogenetic lineages) turnover of taxon A (e.g. parasites) and taxon B (e.g. hosts) or species (or phylogenetic lineages) turnover and environmental dissimilarity. The drivers of community compositional/phylogenetic turnover should be analysed with an appropriate, non-linear analytical method represented, for example, by generalized dissimilarity modelling (GDM) (Ferrier et al., Reference Ferrier, Manion, Elith and Richardson2007; Mokany et al., Reference Mokany, Ware, Woolley, Ferrier and Fitzpatrick2022). This is because of 2 main problems associated with any linear analysis of pairwise metrics of dissimilarity/turnover, namely that (a) the range of any dissimilarity index varies from 0 to 1 only, and (b) the rate of species (or phylogenetic lineages) compositional change along a gradient is not necessarily constant, so the model has to take into account the curvilinear relationship between dissimilarity in species/phylogenetic composition and environmental dissimilarity or geographic distance. The GDM resolves both these problems and, moreover, can incorporate various biotic and abiotic predictors into a single model. The GDM has been successfully, albeit rarely, applied in studies of parasite species turnover and has proven to be a promising tool for revealing drivers of parasite diversity (Maestri et al., Reference Maestri, Shenbrot and Krasnov2017, Reference Maestri, Shenbrot, Warburton, Khokhlova and Krasnov2020; Eriksson et al., Reference Eriksson, Doherty, Fischer, Graciolli and Poulin2019; Krasnov et al., Reference Krasnov, Shenbrot, van der Mescht and Khokhlova2020; McNew et al., Reference McNew, Barrow, Williamson, Galen, Skeen, DuBay, Gaffney, Johnson, Bautista, Ordoñez, Schmitt, Smiley, Valqui, Bates, Hackett and Witt2021). Phylogenetic generalized dissimilarity modelling (phyloGDM) (Ferrier et al., Reference Ferrier, Manion, Elith and Richardson2007) represents an extension of the traditional GDM aimed at modelling spatial patterns of phylogenetic, rather than compositional, turnover (Ferrier et al., Reference Ferrier, Manion, Elith and Richardson2007; Rosauer et al., Reference Rosauer, Ferrier, Williams, Manion, Keogh and Laffan2013).
Another phylogenetic pattern in parasite–host associations is related to the phylogenetic originality of either a parasite or a host. A species is considered original if it has only a few close relatives and/or if its branch in the phylogenetic tree is long (i.e. it supposedly evolved quickly) (May, Reference May1990; Vane-Wright et al., Reference Vane-Wright, Humphries and Williams1991; Faith, Reference Faith1992; Pavoine et al., Reference Pavoine, Ollier and Dufour2005; Pavoine and Izsak, Reference Pavoine and Izsak2014). Phylogenetically original species are highly interesting from the conservation point of view because of their important roles within communities and ecosystems and increased probability of extinction (e.g. Isaac et al., Reference Isaac, Turvey, Collen, Waterman and Baillie2007, Reference Isaac, Redding, Meredith and Safi2012; but see Pavoine et al., Reference Pavoine, Bonsall, Dupaix, Jacob and Ricotta2017). Relationships between a species’ degree of phylogenetic originality and its ecological features are poorly known. Nevertheless, the results of the few available studies suggest that phylogenetically original species tend to have restricted geographic ranges (Cadotte and Davies, Reference Cadotte and Davies2010; Veron et al., Reference Veron, Kondratyeva, Robuchon, Grandcolas, Govaerts, Haevermans, Pellens and Mouchet2021). Taking into account one of the most persistent macroecological patterns, namely the negative relationship between geographic range size and niche breadth (Brown, Reference Brown1984), it can be hypothesized that phylogenetic originals are likely ecological specialists. This has never been specifically tested either in free-living species or in parasites. From a parasite perspective, niche specialization can be reflected in a high degree of host specificity, both structural and phylogenetic (sensu Poulin et al., Reference Poulin, Krasnov and Mouillot2011; see Krasnov et al., Reference Krasnov, Poulin, Shenbrot, Mouillot and Khokhlova2005 for fleas). From a host perspective, if phylogenetically original hosts are also those with a restricted geographic range, then a decrease in the diversity of the parasite assemblages they harbour with an increase in the degree of their phylogenetic originality can be expected because of the negative relationships between a host's geographic range size and the diversity of its parasite assemblage (Feliu et al., Reference Feliu, Renaud, Catzeflis, Hugot, Durand and Morand1997; Krasnov et al., Reference Krasnov, Shenbrot, Khokhlova and Degen2004b).
Here, we studied phylogenetic patterns of regional flea assemblages in 6 biogeographic realms (the Afrotropics, the Australasia, the Indomalaya, the Nearctic, the Neotropics and the Palaearctic). The aims of this study were 2-fold. First and similar to earlier studies of flea compositional dissimilarity (e.g. Krasnov et al., Reference Krasnov, Shenbrot, Korallo-Vinarskaya, Vinarski, Warburton and Khokhlova2019b), we asked (a) whether flea phylogenetic turnover is mainly driven by host phylogenetic turnover or environmental dissimilarity or alternatively by the geographic distance between flea/host assemblages and (b) whether the patterns of the relationships between flea phylogenetic turnover, host phylogenetic turnover, environmental dissimilarity and geographic distance differ between biogeographic realms due to differences in flea and host evolutionary histories in these realms (Traub, Reference Traub, Traub and Starcke1980; Medvedev, Reference Medvedev2005). To assess the relationships between flea and host phylogenetic turnover, environmental dissimilarity and geographic distances, we applied phyloGDMs. In addition, to understand whether spatial patterns and environmental drivers of flea phylogenetic turnover are similar to those of host phylogenetic turnover (Maestri et al., Reference Maestri, Shenbrot and Krasnov2017), we applied phyloGDMs to host phylogenetic turnover as affected by environmental dissimilarity and geographic distances. Second, we asked whether the phylogenetic originality of a flea species correlated with the degree of its host specificity in terms of either size (i.e. the number of host species) or the phylogenetic diversity of its host spectrum. We also asked whether the phylogenetic originality of a host species correlated with the number of flea species it harbours or their phylogenetic diversity.
Materials and methods
Data on fleas, hosts and their interactions
Data on fleas parasitic on small mammalian hosts were taken from a variety of published surveys that reported identities of flea species collected from a given host species [Monotremata, Dasyuromorphia, Didelphimorphia (except large opossums), Paramelemorphia, Notoryctemorphia, Diprotodontia (except Vombatiformes), Macropodiformes (except large kangaroos), Paucituberculata, Macroscelidea, Eulipotyphla, Rodentia and ochotonid Lagomorpha] from 15 regions of the Afrotropics, 8 regions of the Australasia, 10 regions of the Indomalaya, 23 regions of the Nearctic, 17 regions of the Neotropics and 36 regions of the Palaearctic (see lists of regions, maps and references in Krasnov et al., Reference Krasnov, Shenbrot and Khokhlova2022a). Similarly to our earlier study (Krasnov et al., Reference Krasnov, Shenbrot and Khokhlova2022b), whenever possible, we relied on the information in the original sources and did not include in the analyses those findings of certain fleas on certain hosts that the author(s) of the original publications considered to be accidental. Ubiquitous host (Rattus rattus, Rattus norvegicus and Mus musculus) and flea (Xenopsylla cheopis, Xenopsylla brasiliensis, Nosopsyllus fasciatus, Nosopsyllus londoniensis and Leptopsylla segnis) species, as well as introduced host species (e.g. Ondatra zibethicus in the Palaearctic), were also excluded from the analyses. In total, we used data on 213 flea and 196 host species in the Afrotropics, 147 flea and 140 host species in the Australasia, 236 flea and 147 host species in the Indomalaya, 254 flea and 217 host species in the Nearctic, 200 flea and 160 host species in the Neotropics and 338 flea and 209 host species in the Palaearctic.
Phylogenies
Phylogenetic trees for fleas and hosts were constructed for each realm separately because flea faunas, as well as the faunas of flea-harbouring hosts, have been shown to form clear clusters according to the biogeographic realms in which they occur (Krasnov et al., Reference Krasnov, Shenbrot and Khokhlova2022a). For fleas, we used, as a backbone, the most recent and comprehensive (and 1 of only 2 available) molecular phylogenetic tree (Zhu et al., Reference Zhu, Hastriter, Whiting and Dittmar2015). This tree comprised the majority of flea genera from our datasets, whereas this was not the case for the majority of species. The topology of the remaining genera and species was established based on either their morphologically derived taxonomic positions (Hadfield et al., Reference Hadfield, Krasnov, Poulin and Nakagawa2014) or the molecular/morphological phylogenies carried out for some genera (see references in Krasnov et al., Reference Krasnov, Shenbrot and Khokhlova2022b). No information on branch length for ca. 80% of species was available. Consequently, we arbitrarily assigned all branch lengths to a length of 1 and arbitrarily ultrametrized the resultant tree using the option ‘arbitrarily ultrametrize’ in the Mesquite modular system for evolutionary analysis (Maddison and Maddison, Reference Maddison and Maddison2021). Polytomies (9 clades in the Indomalaya, 3 clades in the Nearctic and 11 clades in the Palaearctic) were resolved using the function ‘fix.poly’ of the package ‘RRphylo’ (Castiglione et al., Reference Castiglione, Serio, Piccolo, Mondanaro, Melchionna, Febbraro, Sansalone, Wroe and Raia2020) of the R programming language for statistical computing (R Core Team, 2022).
Host phylogenetic trees were taken as subsets from the 10 000 species-level birth–death tip-dated completed trees for 5911 mammal species of Upham et al. (Reference Upham, Esselstyn and Jetz2019). We built a consensus tree for each realm from 1000 random trees of Upham et al. (Reference Upham, Esselstyn and Jetz2019) using the function ‘consensus.edge’ of the R package ‘phytools’ (Revell, Reference Revell2012), ultrametrized this tree using the function ‘force.ultrametric’ (with option method = ‘extend’) of the ‘phytools’, and resolved the polytomies using the function ‘fix.poly’ of the ‘RRphylo’.
Environmental data
The latitudinal and longitudinal positions of the centres of the regions were determined using ArcGIS 10.6 based on the information from the original source. Environmental variables for each region included (a) seasonal normalized difference vegetation indices (NDVI) (reflecting the amount of green vegetation in boreal/austral spring, summer, autumn and winter); (b) mean, maximum and minimum air temperature; and (c) seasonal precipitation (for boreal/austral spring, summer, autumn and winter). Environmental data were averaged over a region across 30 arc-second grids. NDVI data were obtained from the database PROBA-V S10 TOC NDVI 1KM (http://www.eovoc.spacebel.be). Air temperature and precipitation variables were extracted from the WORLDCLIM (BIOCLIM) 2.0 package (Fick and Hijmans, Reference Fick and Hijmans2017). Then, we ran principal component analyses of each category of environmental variables and substituted their original values with the scores of the first principal component. This resulted in 3 composite environmental variables, namely (a) a vegetation variable (based on the NDVI) that reflected the amount of green vegetation, (b) an air temperature variable and (c) a precipitation variable. In each realm, these new variables explained from 72 to 97% of the variation in NDVI, from 74 to 97% of the variation in air temperature and from 71 to 92% of the variation in precipitation (see Supplementary Table S1). In all realms, the vegetation, air temperature and precipitation variables reflected an increase in the respective raw variables, except in the Indomalaya, where the principal component of precipitation variables corresponded to a decrease in the amount of summer rainfall and an increase in rainfall in the remaining seasons (Supplementary Table S1).
Data analyses: phyloGDM
Measures of phylogenetic dissimilarities among sites represent traditional dissimilarity indices where species are replaced by evolutionary units (Ferrier et al., Reference Ferrier, Manion, Elith and Richardson2007; Nipperess et al., Reference Nipperess, Faith and Barton2010; Pavoine, Reference Pavoine2016). For each realm, we constructed a presence/absence matrix for either flea or host species per each region. Then, we calculated flea or host phylogenetic dissimilarity matrices for each realm using the command ‘evodiss_family’ of the R package ‘adiv’ (Pavoine, Reference Pavoine2020) with option ‘method = 7’, that is, using coefficient S12 of Gower and Legendre (Reference Gower and Legendre1986) based on Ochiai (Reference Ochiai1957). We chose to use this coefficient because it is calculated for incidence rather than abundance data, whereas the abundances of either flea or host species were not available in the majority of data sources. PhyloGDMs were carried out separately for each realm using the R package ‘gdm’ (Fitzpatrick et al., Reference Fitzpatrick, Mokany, Manion, Nieto-Lugilde and Ferrier2022). First, we ran phyloGDMs to reveal how between-region phylogenetic dissimilarity in flea assemblages was affected by host phylogenetic dissimilarity, environmental dissimilarity and geographic distances. Then, we ran phyloGDMs on host phylogenetic dissimilarity as affected by environmental dissimilarity and geographic distances.
Data analyses: phylogenetic originality and phylogenetic diversity
To test (a) whether the phylogenetic originality of a flea species affected its level of host specificity in terms of the size and phylogenetic diversity of a host spectrum and (b) whether the phylogenetic originality of a host species affected the species richness and phylogenetic diversity of its flea assemblages, we calculated the measures of the phylogenetic originality of a flea or a host species and the phylogenetic diversity of a host spectrum or a flea assemblage separately for each realm. The phylogenetic originality of a flea or a host was calculated as 2Hb index (a vector that maximizes the 2H index of Pavoine and Izsak, Reference Pavoine and Izsak2014) using the function ‘distinctUltra’ with the option ‘method = 2Hb’ of the ‘adiv’ package. 2H represents an application of the quadratic entropy (QE) of Rao (Reference Rao1982) modified by Ricotta and Szeidl (Reference Ricotta and Szeidl2009) and developed by Pavoine et al. (Reference Pavoine, Ollier and Dufour2005) and Pavoine and Izsak (Reference Pavoine and Izsak2014), where the QE is equal to the expected dissimilarity between 2 entities randomly selected using a replacement (see mathematical details in Pavoine and Izsak, Reference Pavoine and Izsak2014). Pavoine and Izsak (Reference Pavoine and Izsak2014) demonstrated that a maximizing vector for 2H can be used as a measure of a given species’ phylogenetic originality.
The sizes of a flea's host spectrum and the species richness of a host's flea assemblage were calculated as mere numbers of species. Mean pairwise distance (MPD) and mean nearest-taxon distance (MNTD) (Tucker et al., Reference Tucker, Cadotte, Carvalho, Davies, Ferrier, Fritz, Grenyer, Helmus, Jin, Mooers, Pavoine, Purschke, Redding, Rosauer, Winter and Mazel2017) were used as metrics of the phylogenetic diversity of either a flea's host spectrum or a host's flea assemblage. Both metrics measure the phylogenetic dispersion of a community. MPD is the average phylogenetic distance between all species, whereas MNTD measures the average phylogenetic distance between the nearest-neighbouring species. The standardized effect sizes of the MPD and MNTD (SESMPD and SESMNTD, respectively) for either host spectra or flea assemblages were obtained by comparing observed phylogenetic relatedness to phylogenetic relatedness expected under the null model of randomization of either a host spectrum or a flea assemblage constructed using the ‘independent swap’ algorithm (Gotelli and Entsminger, Reference Gotelli and Entsminger2001). This algorithm maintains species occurrence frequency and species richness in either a host spectrum or a flea assemblage. Calculations were done using the functions ‘ses.mpd’ and ‘ses.mntd’, respectively, of the R package ‘picante’ (Kembel et al., Reference Kembel, Cowan, Helmus, Cornwell, Morlon, Ackerly, Blomberg and Webb2010).
The relationships between a flea species’ or a host species’ originality (an independent variable) and either the size/species richness of a host spectrum or a flea assemblage or its phylogenetic diversity (a dependent variable) were analysed using generalized linear models. Prior to the analyses, all variables were normalized from 0 to 1.
Results
Phylogenetic turnover
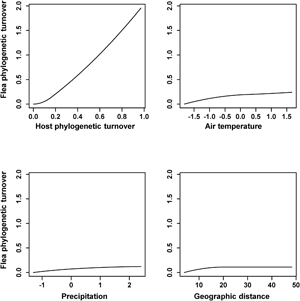
The results of the phyloGDMs that aimed to test (a) how flea phylogenetic turnover was affected by host phylogenetic turnover, environmental dissimilarity and geographic distance and (b) how host phylogenetic turnover was affected by environmental dissimilarity and geographic distance are presented in Tables 1 and 2, respectively. All models explained substantial proportions of deviance. I-splines produced by the phyloGDMs for fleas are presented in Figs 1–3, whereas those for hosts are in Supplementary Figs S1–S3. In all realms, flea phylogenetic turnover was affected first and foremost by host phylogenetic turnover, whereas the effect of environment on flea phylogenetic turnover within a realm was weaker. The shape of the I-spline for host turnover as a predictor of flea turnover was similar in all realms and steeply increased with an increase in host phylogenetic dissimilarity. Furthermore, different environmental variables played different roles in their effect on flea phylogenetic turnover. For example, the most important environmental predictor of flea phylogenetic turnover in the Afrotropics, the Indomalaya and the Palaearctic was temperature gradient (Figs 1–3), whereas this factor did not play any role whatsoever in the Australasia and exerted the weakest impact of all the environmental gradients on flea turnover in the Nearctic and the Neotropics (Figs 2 and 3). Similarly, flea phylogenetic turnover strongly responded to the amount of green vegetation gradient in the Neotropics, but the effect of vegetation in the Palaearctic was extremely weak. The precipitation gradient was associated with flea turnover in the Afrotropics, the Australasia and the Nearctic, whereas it did not have any influence in the remaining realms. In addition, dissimilarity in the phylogenetic composition of flea assemblages between regions increased with an increase of spatial distance between regions in all realms, although this increase was manifested differently in different realms, being strong in the Australasia, moderate in the Nearctic and the Neotropics and weak in the Afrotropics, the Indomalaya and the Palaearctic (Figs 1–3).

Fig. 1. Generalized dissimilarity model-fitted I-splines (partial regression fits) of host phylogenetic turnover, environmental variables and geographic distance as predictors of flea phylogenetic turnover across the Afrotropics and the Australasia. The steeper slope of the transformed relationship on a given section of the gradient indicates a greater rate of turnover.

Fig. 2. Generalized dissimilarity model-fitted I-splines (partial regression fits) of host phylogenetic turnover, environmental variables and geographic distance as predictors of flea phylogenetic turnover across the Indomalaya and the Nearctic. The steeper slope of the transformed relationship on a given section of the gradient indicates a greater rate of turnover.

Fig. 3. Generalized dissimilarity model-fitted I-splines (partial regression fits) of host phylogenetic turnover, environmental variables and geographic distance as predictors of flea phylogenetic turnover across the Neotropics and the Palaearctic. The steeper slope of the transformed relationship on a given section of the gradient indicates a greater rate of turnover.
Table 1. Flea phylogenetic turnover as explained by host phylogenetic turnover (HPT), environmental variables (Veg, T, P) and geographic distance (GD) between regions in 6 biogeographic realms

Veg, T and P composite environmental variables reflecting the amount of green vegetation, air temperature and precipitation, respectively (see text for explanations); I-splines 1, 2 and 3: coefficients of the first, second or third I-spline, respectively; ΣI-splines: sum of 3 I-splines (demonstrates the amplitude of an I-spline).
Table 2. Host phylogenetic turnover as explained by environmental variables (Veg, T, P) and geographic distance (GD) between regions in 6 biogeographic realms

Veg, T and P composite environmental variables reflecting the amount of green vegetation, air temperature and precipitation, respectively (see text for explanations); I-splines 1, 2 and 3: coefficients of the first, second or third I-spline, respectively; ΣI-splines: sum of 3 I-splines (demonstrates the amplitude of an I-spline).
Within the same realm, dissimilarity in host and flea phylogenetic composition was differently affected by environmental gradients. For example, the effect of precipitation on dissimilarity in phylogenetic composition in the Afrotropics was strong for hosts and weak for fleas (Fig. 1 and Supplementary Fig. S1). In the Australasia, the amount of vegetation was a strong predictor of host, but not flea, phylogenetic turnover (Fig. 1 and Supplementary Fig. S1). In 4 of 6 realms (the Australasia, the Nearctic, the Neotropics and the Palaearctic) (Figs 1–3 and Supplementary Figs S1–S3), geographic distances were substantially better predictors of host phylogenetic turnover than environmental gradients.
Phylogenetic originality, host specificity and phylogenetic diversity of flea assemblages
No significant relationships between a flea species’ phylogenetic originality (FPO) and either its host spectrum's size (HSR) or phylogenetic diversity were found except in the Palaearctic (P > 0.05 for all), where the number of host species exploited by a flea decreased with an increase in a flea's originality (HSR = 0.15–0.20 × FPO, R 2 = 0.02, F = 4.89, P = 0.03; Fig. 4A). However, the coefficient of determination of this relationship was rather low, and the point scatter in Fig. 4A was clearly triangular, suggesting that fleas with a low degree of originality could exploit either many or only a few host species, whereas highly original fleas were highly host specific. In addition, the negative relationship between the FPO and the phylogenetic diversity of its host spectrum, in terms of MPD, was marginally significant in the Nearctic (F = 3.10, P = 0.08).

Fig. 4. Relationship between the phylogenetic originality of a flea species and the number of host species it exploits in the Palaearctic (A), between the phylogenetic originality of a host species and the number of flea species it harbours in the Afrotropics (B) and the Palaearctic (C), between the phylogenetic originality of a host species and the phylogenetic diversity of its flea assemblage measured as either MPD or MNTD in the Australasia (D) and the Nearctic (E, F). MPD, mean pairwise distance; MNTD, mean nearest-taxon distance (see text for explanations).
A host's phylogenetic originality (HPO) affected the species richness of its flea assemblage in the Afrotropics and the Palaearctic, both metrics of phylogenetic diversity in the Nearctic, and phylogenetic diversity measured as MNTD in the Australasia (Table 3), whereas no relationships whatsoever were found in the Neotropics and the Indomalaya. In the Afrotropics, the Palaearctic and the Australasia, these relationships were negative, and similar to the effect of FPO on host diversity, point scatters were clearly triangular (Fig. 4B–D). This suggested that phylogenetically non-original host species could harbour either highly diverse or less diverse flea assemblages, whereas flea assemblages of highly phylogenetically original hosts were either species-poor or phylogenetically similar. However, in the Nearctic, both the MPD and MNTD of flea assemblages increased with an increase in HPO (Fig. 4E, F). In other words, flea assemblages of highly phylogenetically original North American hosts were highly phylogenetically diverse. A significantly negative relationship between MNTD and HPO in the Australasia arose mainly due to 2 monotreme hosts (which obviously were highly phylogenetically original) (Fig. 4D). After these hosts were removed from the analysis, the relationship still appeared to be negative, albeit only marginally significant (MNTD = 0.55–1.77 × HFO, F = 3.56, P = 0.06). Additionally, negative relationships between HPO and (i) species richness or (ii) phylogenetic dissimilarity, measured as the MPD of its flea assemblage, were marginally significant in the Nearctic (F = 3.10, P = 0.08) and the Australasia (F = 3.80, P = 0.06), respectively.
Table 3. Relationship between the phylogenetic originality of a host species (HPO) and either the species richness (FSR) or phylogenetic diversity of its flea assemblage (MPD or MNTD) in 4 biogeographic realms (only significant models are shown)

MPD, mean pairwise distance; MNTD, mean nearest-taxon distance (Tucker et al., Reference Tucker, Cadotte, Carvalho, Davies, Ferrier, Fritz, Grenyer, Helmus, Jin, Mooers, Pavoine, Purschke, Redding, Rosauer, Winter and Mazel2017).
Discussion
The strong link between flea and host phylogenetic turnover found in this study reflects the common evolutionary history of fleas and their hosts. This common history does not, however, necessarily imply co-speciation as advocated in the earliest studies that compared parasite and host phylogenies (e.g. Hafner and Nadler, Reference Hafner and Nadler1988, Reference Hafner and Nadler1990; Hafner and Page, Reference Hafner and Page1995). Instead, the common history of parasites and their hosts is often (indeed, almost always) characterized by a variety of other coevolutionary events, such as host switching, lineage sorting and duplications [see definitions in, e.g. Paterson et al. (Reference Paterson, Gray and Wallis1993); Beveridge and Chilton (Reference Beveridge and Chilton2001); Roy (Reference Roy2001)]. As a result, phylogenetic trees of parasites and hosts are most often incongruent (e.g. Caira and Jensen, Reference Caira and Jensen2001). Our results indicated a pattern of parasite–host coevolution resembling co-speciation but taking place at a phylogenetic level deeper than species and genera. This supports the conclusions of Traub (Reference Traub, Traub and Starcke1980), Whiting et al. (Reference Whiting, Whiting, Hastriter and Dittmar2008) and Zhu et al. (Reference Zhu, Hastriter, Whiting and Dittmar2015) that flea history and dispersal are strongly tied to those of their mammalian hosts and that flea diversification started when their ancestors became an ectoparasite on mammals. Moreover, flea diversification is undoubtedly a response to the diversification of their hosts (e.g. Morrone and Gutiérrez, Reference Morrone and Gutiérrez2005) exemplifying the so-called phylogenetic tracking (Russo et al., Reference Russo, Miller, Tooker, Bjornstad and Shea2017). Although strict co-speciation has not been proven, repeated episodes of co-speciation might be masked because they are mediated by, for example, vicariant events. Clear clustering of flea assemblages, according to the biogeographic realms to which they belong (Krasnov et al., Reference Krasnov, Shenbrot and Khokhlova2022a), indicated independent (to some extent) flea evolution in different realms. Tight relationships of certain phylogenetic lineages of fleas with certain phylogenetic lineages of their hosts (e.g. Krasnov et al., Reference Krasnov, Shenbrot, Khokhlova and Degen2016) have resulted in patterns of flea geographic distribution that often mirror those of their host (Traub, Reference Traub, Traub and Starcke1980; Medvedev, Reference Medvedev2005; Morrone and Gutiérrez, Reference Morrone and Gutiérrez2005; López-Berrizbeitia et al., Reference López-Berrizbeitia, Acosta-Gutiérrez and Díaz2020). Recently, Gibert et al. (Reference Gibert, Shenbrot, Stanko, Khokhlova and Krasnov2021) demonstrated that the species composition of fleas and their small mammalian hosts on several continents predominantly depended on historical processes (dispersal). This is because fleas most likely rely on their hosts, using them as dispersal vehicles due to their own limited (if any) dispersal abilities.
Environmental predictors of flea phylogenetic turnover played a less important, albeit substantial, role than host phylogenetic turnover. This indicates the dependence of a flea's ecological requirements on both host identity and environmental factors (Krasnov et al., Reference Krasnov, Shenbrot, Medvedev, Khokhlova and Vatschenok1998, Reference Krasnov, Shenbrot, Khokhlova, Stanko, Morand and Mouillot2015) and could be a reasonable explanation for the effect of environment on flea compositional turnover. The environmental effect on phylogenetic turnover suggests that some physiological flea traits determining their environmental requirements and/or preferences might be phylogenetically conserved. This, however, has never been studied and, thus, is completely unknown. Nevertheless, some observations have indicated that this might well be the case. For example, a significant phylogenetic signal was found in flea body size (Surkova et al., Reference Surkova, Warburton, van der Mescht, Khokhlova and Krasnov2018). Given that body size and many physiological variables are highly correlated in many taxa, including insects (Peters, Reference Peters1983; Schmidt-Nielsen, Reference Schmidt-Nielsen1984; Chown and Gaston, Reference Chown and Gaston1997; Chown et al., Reference Chown, Addo-Bediako and Gaston2002), a phylogenetic signal in flea physiological traits is expected, which, in turn, might be translated into the relationships between flea phylogenetic turnover and environmental gradients. Furthermore, environmental predictors of flea phylogenetic turnover differed between biogeographic realms. There might be at least 2, not mutually exclusive, reasons behind this. First, the length of an environmental gradient, that is, variation in an environmental variable, can differ between realms, so that environmental variation might be too low for a turnover to respond to. For example, the coefficients of variation of the NDVI variables in the Australasia ranged from 0.47 to 0.52, whereas the coefficients of variation of the precipitation variables were higher and ranged from 0.93 to 1.11. As a result, flea phylogenetic turnover responded to precipitation but not to the amount of green vegetation. Second, different flea lineages might have different environmental requirements/preferences in dependence on the environmental conditions they evolved under, so that lineages in different realms differ in their sensitivity to the same environmental factors. Admittedly, we do not have any information supporting the latter explanation. We recognize that it is highly speculative and requires special investigation.
As mentioned above, host phylogenetic turnover appeared to be a better predictor of flea phylogenetic turnover than environment. A similar pattern was reported by Krasnov et al. (Reference Krasnov, Shenbrot, van der Mescht and Khokhlova2020) for flea compositional turnover in 4 biogeographic realms. However, the best predictor of dissimilarity in flea species composition in Mongolia was found to be the air temperature gradient, whereas the effect of dissimilarity in host species composition was weaker (Maestri et al., Reference Maestri, Shenbrot and Krasnov2017). In other words, the identity of the best predictor of flea compositional turnover might be scale dependent. Comparison of this study's results with those of Krasnov et al. (Reference Krasnov, Shenbrot, Korallo-Vinarskaya, Vinarski, Warburton and Khokhlova2019b) and Maestri et al. (Reference Maestri, Shenbrot, Warburton, Khokhlova and Krasnov2020), however, suggests that predictors of flea phylogenetic turnover are scale invariant. Nevertheless, both studies at the local scale were carried out in the Palaearctic. It remains to be further studied whether predictors of flea phylogenetic turnover are scale-dependent in other biogeographic realms.
Phylogenetic turnovers of fleas and hosts were predicted by different environmental gradients in the same realm. Maestri et al. (Reference Maestri, Shenbrot and Krasnov2017, Reference Maestri, Shenbrot, Warburton, Khokhlova and Krasnov2020) reported the same pattern for the compositional beta-diversity of fleas and hosts and concluded that flea species composition responds directly to environmental variables rather than being mediated by host responses. The same appears to be true for the phylogenetic beta-diversity of fleas. The simplest explanation for this may be the sharp differences in ecological requirements, possibilities and constraints between insects (i.e. fleas) and mammals.
Geographic distance was, in general, a better predictor of phylogenetic turnover for hosts than for fleas. Its importance varied between realms in both fleas and hosts. In addition, it had no effect on the phylogenetic turnover of hosts in the Afrotropics. This supports earlier observations that the famous pattern of distance decay of community similarity (Nekola and White, Reference Nekola and White1999) is not universal in terms of either compositional similarity or phylogenetic similarity (Pérez-del-Olmo et al., Reference Pérez-del-Olmo, Fernández, Raga, Kostadinova and Morand2009; Maestri et al., Reference Maestri, Shenbrot and Krasnov2017).
We found only a weak relationship between flea phylogenetic originality and host specificity and only in terms of host species richness and only in the Palaearctic (although some trend could be envisaged in the Nearctic). The main reason behind the general lack of association between parasite phylogenetic originality and host specificity could be that host specificity, to a great extent, correlates with parasite traits rather than with their phylogenetic position. For example, reproductive output, in terms of clutch size, correlates with host specificity in copepods (Doherty et al., Reference Doherty, Milotic, Filion and Eriksson2022). Similarly, the number of host species used by facultatively haematophagous gamasid mites correlated with their body size (Krasnov et al., Reference Krasnov, Vinarski, Korallo-Vinarskaya and Khokhlova2013). In other words, parasite host specificity might be related to its functional rather than its phylogenetic originality, while phylogenetic originality does not necessarily reflect functional originality (Pavoine et al., Reference Pavoine, Bonsall, Dupaix, Jacob and Ricotta2017). The relationships between a parasite's functional originality and its host specificity remain to be investigated. Nevertheless, the case of the Palaearctic fleas may be linked to the fact that diversification of the largest flea families likely occurred in this realm and started as late as in the Eocene (Medvedev, Reference Medvedev2005). As a result, the distribution of flea species according to the degree of their phylogenetic originality was strongly asymmetrical in the Palaearctic (skewness = 3.94) followed by that in the Nearctic (3.38), with less asymmetry in the remaining realms (2.33–3.24). The high asymmetry of this distribution could have resulted in a significant relationship between phylogenetic originality and the size of a host spectrum.
Relationships between the phylogenetic originality of a host species and either the compositional or phylogenetic diversity of their flea assemblages, albeit weak, were found in 4 of the 6 realms. These might have resulted from the aforementioned chain of associations between phylogenetic originality, geographic range size and diversity of flea assemblages (Feliu et al., Reference Feliu, Renaud, Catzeflis, Hugot, Durand and Morand1997; Veron et al., Reference Veron, Kondratyeva, Robuchon, Grandcolas, Govaerts, Haevermans, Pellens and Mouchet2021). Surprisingly, the trend of increased phylogenetic flea diversity in the most phylogenetically original hosts in the Nearctic was opposite to the patterns found in the Australasia. This difference is difficult to explain, although it suggests differential histories of flea evolution in different realms. Our knowledge of the historical patterns of flea evolution and dispersal is insufficient. However, these opposite trends might somehow be associated with the fact that flea fauna in the Nearctic is represented by a large number of species belonging to the youngest family (Ceratophyllidae), whereas many Australasian fleas belong to the basal flea families Macropsyllidae, Stephanocircidae, Pygiopsyllidae, Stivaliidae and Lycopsyllidae (Medvedev, Reference Medvedev2005; Zhu et al., Reference Zhu, Hastriter, Whiting and Dittmar2015).
In conclusion, the results of our study suggest that fleas’ phylogenetic turnover is determined, to a great extent, by the phylogenetic turnover of their hosts, whereas environmental factors are less important. Comparison of the results of this study with those of earlier studies (e.g. Krasnov et al., Reference Krasnov, Shenbrot, van der Mescht, Warburton and Khokhlova2019a) suggests that the phylogenetic alpha- and beta-diversity of parasites are controlled by different rules (see also Krasnov et al., Reference Krasnov, Shenbrot, Korallo-Vinarskaya, Vinarski, Warburton and Khokhlova2019b). In addition, phylogenetic patterns in the order Siphonaptera are manifested mainly at the level of regional assemblages rather than at the level of individual species.
Supplementary material
The supplementary material for this article can be found at https://doi.org/10.1017/S003118202300015X.
Data availability
Data for the Afrotropics, the Neotropics, the Nearctic and the Palaearctic are deposited in the Mendeley Data Repository (http://dx.doi.org/10.17632/6jxpf678rm.1) (Krasnov, Reference Krasnov2018). Data for the Australasia and the Indomalaya data can be found in the sources cited in Krasnov et al. (Reference Krasnov, Shenbrot and Khokhlova2022a).
Acknowledgements
We thank Uri Roll and Helena Furman for their help with the Geographic Information Systems.
Author's contributions
B. R. K. conceived and designed the study. All authors collected the data and performed statistical analyses. B. R. K. wrote the first draft of the article. All authors finalized the article.
Financial support
This research received no specific grant from any funding agency, commercial or not-for-profit sectors.
Conflict of interest
None.
Ethical standards
The study used data from literature sources.


 Open access