


Obesity is a growing public health problem in the world that is closely related to increased cardiovascular disorders(Reference Arroyo-Johnson and Mincey1). Based on the previous evidence, central rather than general obesity may specifically increase the risk of diabetes, metabolic syndrome, CHD, certain cancers and mortality rate(Reference Shelgikar, Yajnik and Hockaday2–Reference Hamer, O’Donovan and Stensel9).
Visceral adipose tissue (VAT) is a hormonally effective part of body fat mass that is collected within the abdominal cavity, near the digestive processes(Reference Brown, Harhay and Harhay10,Reference Després11) . VAT is considered an independent risk factor for metabolic syndrome (MetS) due to its role in glucose(Reference Hayashi, Boyko and Leonetti12), lipid metabolism(Reference Kim, Kim and Hur13) and controlling blood pressure (BP)(Reference Hayashi, Boyko and Leonetti14). It has been shown that patients with visceral obesity may promote atherosclerosis and are particularly prone to CVD(Reference Fujimoto, Bergstrom and Boyko15). More sensitive and specific biomarkers than classical indicators (BMI, waist circumferences and waist:hip ratio) are needed to enable health professionals to evaluate visceral adipose tissue. Lipid accumulation product (LAP) index is a biomarker of central fat accumulation that has newly been developed and has been advocated as a correct indicator of the risk of insulin resistance, MetS, type 2 diabetes and CVD(Reference Mirmiran, Bahadoran and Azizi16,Reference Wakabayashi and Daimon17) . LAP is also correlated with abnormal glucose homoeostasis and insulin resistance, as well as increased alanine aminotransferase, in healthy people(Reference Oh, Sung and Lee18). BMI does not distinguish between fat and lean tissues. The components of LAP include waist size as a measure of truncal fat and serum triglyceride that are related to insulin levels as a risk factor of CVD, and it has been reported that LAP is a stronger indicator of cardiovascular risk in USA people than BMI(Reference Kahn19,Reference Ray, Ravichandran and Nanda20) .
The lifestyle component plays an important role in the aetiology of obesity(Reference Jebb and Moore21). Visceral obesity and the aforementioned cardiometabolic disease may be linked through potentially modifiable lifestyle factors that provoke fat accumulation, such as special dietary habits(Reference Bulló, Casas-Agustench and Amigó-Correig22). Since carbohydrate is the main source of energy among the Iranian population(Reference Bahreinian and Esmaillzadeh23), it is of great interest to reveal how carbohydrate intakes link to the risk of fat deposition. Besides dietary pattern and macronutrient intake, carbohydrate quality is another important factor that has previously been shown to have a link with MetS components(Reference Slyper24,Reference de Mello Fontanelli, Sales and Carioca25) . It has been proposed that VAT is changed by the qualitative aspects of nonenergetic diets, although evidence of a macronutrient combination of diet and VAT is still limited(Reference Veum, Laupsa-Borge and Eng26).
Recent research shows that energy expenditure, mainly in the form of carbohydrates or fat, for 3 months does not affect visceral fat and MetS in a low-processed, low-glycaemic diet(Reference Veum, Laupsa-Borge and Eng26). There have been numerous studies to investigate the relationship between glycaemic index (GI) and glycaemic load (GL) with obesity in adults with inconclusive associations. Taking a low-fat diet as a strategy to lose weight and reduce visceral fat was developed in many previous trials(Reference Kendall, Levitsky and Strupp27,Reference Shai, Schwarzfuchs and Henkin28) . However, in a low-fat diet, the percentage of dietary carbohydrates increases and contributed to an increment in blood sugar and consequently higher fat storage by the increased level of insulin(Reference Mazloom, Kazemy and Tabatabai29). Because of inconsistent findings, many questions remain still open regarding the relationship between low-carbohydrate diet (LCD) score and carbohydrate quality and visceral adiposity. Then, understanding the real association may help us to design interventions to reduce abdominal obesity and its associated complications. Therefore, we aimed to investigate the relationship between LCD score and dietary GI and GL with visceral fat level (VFL) and LAP in adults in Tehran.
Participants and methods
Study design
This cross-sectional study was conducted on 270 adults, aged between 18 and 45 years, who lived in Tehran between February 2017 and December 2018. The sample was chosen using a convenient sampling method within different health centres in Tehran. Health centres were selected randomly from different areas of Tehran. We applied advertisements, distribution of flyers in public locations and information sessions at health care centres. People were invited to participate in the study after the clarification of the objectives and benefits of the research. We calculated the sample size of 254 using the formula N = ((Z1-α/2)2 × (S)2)/d2 considering ‘α’ = 0·05, ‘d’ = 4 % and the effect size = 1·5(Reference Amini, Shahinfar and Babaei30). Totally, 270 participants were selected for inclusion to compensate for the potential exclusion of participants due to under- and over-reporting of total energy intake.
The current study was conducted according to the guidelines laid down in the Declaration of Helsinki, and all methods including human subjects were approved by the ethical standards of the Tehran University of Medical Sciences, which established the protocol and informed consent form (Ethic Number: IR.TUMS.VCR.REC.1396·4306). All members signed written informed consent before the start of the study.
Eligibility criteria
Participants with specific diets, such as weight loss and weight gain diets, adults with chronic diseases afflicting the sleeping metabolic rate, including diabetes, hormonal and CVD, pregnant and lactating women, receiving any special medication or supplement (slimming medicine, hormone, sedative, supplements including thermogenic substances, such as caffeine and green tea and linoleic acid conjugate) were excluded from the study.
Demographics
Additional covariates include age, gender, smoking status (non-smoker, former smoker or current smoker), marital status (married or single), education status (high as above the diploma or low as under diploma), medical history (underlying disease such as diabetes, hypertension, stroke, cancer or dyslipidaemia) and physical activity level (low, moderate or vigorous) were collected using approved questionnaires.
Physical activity
Physical activity was evaluated using the International Physical Activity Questionnaire (IPAQ), which is an interview-administered instrument, by an experienced interviewer. IPAQ was previously validated and is consistent in the Iranian population(Reference Moghaddam, Aghdam and Asghari Jafarabadi31). Data were collected regarding walking, moderate and vigorous activity, in the preceding week. Also, the time and regularity of activity days were recorded. During the present study, we used the short form of the IPAQ (the ‘last 7-day recall’ version of the IPAQ-SF), which records three intensity levels of activity based on the metabolic equivalents (MET). Eventually, MET were categorised as low (< 600 MET-min/week), moderate (600–3000 MET-min/week) and vigorous (> 3000 MET-min/week).
Blood pressure
BP was measured twice using a standard mercury sphygmomanometer. Participants were questioned about the consumption of tea and coffee, physical activity and a full bladder. They were in a seated position comfortably for 15 min before the BP reading. The mean of the two measured systolic BP (SBP) and diastolic BP (DBP) were reported.
Anthropometry measurements and body composition
Weight was measured using digital scales (Seca model 808; Seca, measurement accuracy ± 0·1 kg), whilst height was measured using a stadiometer (Seca, measurement accuracy ± 0·1 cm) in health care centres. BMI was calculated using measured weight (kg)/height (metres) squared. waist circumference (WC) was measured between the lower rib and iliac crest, at the widest portion, with light clothing, using a tape metre (Seca 201) without any pressure on the body(Reference Kouchi32). Hip circumference was measured at the maximal level over light clothing, using a non-stretch tape measure, without putting pressure on the body surface. Waist:hip ratio (WHR) was calculated as waist circumference (cm) divided by hip circumference (cm). VFL was measured using bioimpedance analysis (InBody S10, JMW140; InBody). Also, to improve measurement accuracy, people were advised not to engage in moderate to vigorous physical activity 1-to-2 h before using the bioimpedance analysis devices and to empty their bladder before measurement. To minimise the possible measurement error, a single trained dietitian did all the procedures.
Definitions
LAP is based on a combination of WC and the fasting concentration of TG, two markers that are associated with insulin resistance and cardiovascular risk. It was developed based on the data of the third National Health and Nutrition Examination Survey (NHANES III), on a sample of mostly non-Hispanic blacks and Mexican Americans, conducted between 1988 and 1994. The sample contained 4447 men and non-pregnant 4733 women, over the age of 18 years. It has been shown to have a strong and reliable diagnostic accuracy in Iranian adults previously(Reference Motamed, Razmjou and Hemmasi33). LAP was calculated as (waist circumference (WC) − 65) × TG in men and (WC − 58) × TG in women(Reference Esfahani, Asghari and Mirmiran34).
Dietary assessment
The dietary intake of participants was assessed by a valid and reliable semi-quantitative FFQ, which contained 168 food items including low-fat and high-fat dairy, a variety of vegetables, fruits, grains, different meats, sweets and sugary foods, nuts, fats and oils and legumes(Reference Esfahani, Asghari and Mirmiran34). Esfahani et al. assessed the repeatability of food groups included in the FFQ designed for the Tehran Lipid and Glucose Study (TLGS) and found it to be reliable and valid for assessing the intake of a variety of foods. The FFQ was directed by trained dietitians to limit any possible miscalculation, via face-to-face interviews, asking participants to describe their frequency of consumption of each food item, during the past year on a daily, weekly or monthly basis. These data were then converted to daily intake using Nutritionist IV software, which was based on a modified USA Department of Agriculture dietary composition for Iranian foods(Reference Haytowitz, Lemar and Pehrsson35). A trained dietitian manually entered the data after excluding under and overreporting and entrants with missing data.
Assessment of dietary glycaemic index and glycaemic load
We estimated the total dietary GI by using the following formula: ∑ (GIa × available carbohydratea)/total available carbohydrate, where available carbohydrate was calculated as total carbohydratea minus fibrea (Reference Wolever, Yang and Zeng36). The total carbohydrate and fibre contents of the foods were derived from the USA Department of Agriculture food composition table. Of the 101 carbohydrate-containing foods in the FFQ, GI values for only six foods could be derived from the Iranian GI table(Reference Taleban and Esmaeili37) because the table does not cover the GI of all available foods. The GI values for the remaining items are obtained from the international table of GI(Reference Foster-Powell, Holt and Brand-Miller38), and the GI online database maintained by the University of Sydney(39). For items that were not on the table, they were estimated based on similar physical and chemical foods. All derived GI values were relative to glucose as the reference food. The GI of composite mixed meals were estimated based on the GI of individual food components(Reference Wolever, Yang and Zeng36). The dietary GL was calculated as (total GI × total available carbohydrate)/100 and expressed as g/d(Reference Wolever, Yang and Zeng36). We used the energy-adjusted quantity of total carbohydrate intake measured through the residual process, as suggested by Willett et al. (Reference Willett and Stampfer40)
LCD
We calculated an LCD score for each participant based on the method introduced by Hamilton et al. with some adjustment in maximum score(Reference Halton, Willett and Liu41). Participants were divided into quintiles of carbohydrate, protein and fat intake as a percentage of energy intakes. Women in the lowest quintile of carbohydrate intake were given a score of 4 and those in the highest quintile were given a score of 0. Other quintiles (second, third and fourth) were given the corresponding scores (3, 2 and 1, respectively). For protein and fat, we used the same scoring, but the order was reversed. Women in the lowest quintile were given a score of 0 for that macronutrient and those in the highest quintile of protein and fat intake were given a score of 4. Other quintiles (second, third and fourth) were given the corresponding scores (1, 2 and 3, respectively). To create the LCD score, macronutrient scores were summed and ranged from 0 to 12. The lowest score (0) indicated the highest carbohydrate intake and the lowest fat and protein intake, and the highest score (12) indicated the lowest carbohydrate intake and the highest protein and fat intake. Therefore, a high LCD score would represent a participant with high adherence to a low-carbohydrate diet and vice versa.
Laboratory investigation
Participants asked to be fast for at least 8–12 h. Then, 10 ml fasting-blood samples were collected between the hours of 07.00–10.00 in acid-washed test tubes without anticoagulants. After storing at room temperature for 30 min and clot formation, blood samples were centrifuged at 1500 g for 20 min. Serums were stored at –80°C until future testing. Glucose was included by the enzymatic (glucose oxidase) colorimetric method, using a commercial kit (Pars Azmun). Serum total cholesterol (TC) and HDL-cholesterol was measured using a cholesterol oxidase phenol 4-amino antipyrine method, and TG was estimated using a glycerol-3 phosphate oxidase phenol 4-amino antipyrine enzymatic method.
Statistical analysis
Energy-adjusted dietary GI, GL and LCD score were used to classify participants into tertiles. According to the type of variables, the comparison of quantitative mean variables between the tertiles of subject characteristics and anthropometric measurement was performed using ANOVA (one-way variance analysis) and comparison of qualitative variables distribution between the tertiles with χ 2 square test. The multivariate-adjusted means of anthropometric measures across tertiles of GI, GL and LCD score were compared using ANCOVA. To obtain the OR with 95 % CI for a higher LAP index and VFL (based on the median values), we applied binary logistic regression in crude and multivariate-adjusted models. We used age and energy intake for the first model. Model 2 was adjusted for variables in model 1 plus education, smoking status, physical activity, occupation, marriage and underlying diseases. All statistical analyses were performed using Statistical Package for Social Science (SPSS version 26·0; IBM Corp.). The significance level of < 0·05 was considered for statistical analysis.
Results
Of the 270 participants, 118 and 152 were men and women, respectively. The average age was 38 in men and 35·7 in women. Mean of GI, GL and CQI was 65·4 ± 2·9, 265 ± 18·5 and 9·5 ± 4·5, respectively.
The general characteristics of participants are presented in Table 1. Participants with the highest GI tended to have a higher body weight (P = 0·01), height (P = 0·01), WC (P = 0·04), WHR (P = 0·04) and DBP (P = 0·03). The mean of body weight (P < 0·001), height (P = 0·01), BMI (P = 0·02), WC (P < 0·001), WHR (P = 0·03) and DBP (P = 0·05) were also significantly different across tertiles of the GL. Participants with the highest GI and GL tended to be more smoker and male. Within the LCD tertiles, participants in the third tertile were less uneducated, male current smoker and physically active and to have chronic disease and more likely to be married, educated and employed compared with those in the first tertile.
Table 1. General characteristics of study participants across tertiles of low-carbohydrate diet score, glycaemic index and glycaemic load
(Mean values and standard deviations)

GI, glycaemic index; GL, glycaemic load; LCD, low-carbohydrate diet score; T, tertile; WC, waist circumference; WHR, waist:hip ratio; SBP, systolic blood pressure; DBP, diastolic blood pressure; Y, year; Cm, centimetre; kg/m², kilogram/metre²; Mm Hg, millimetres of mercury.
All values are means ± standard deviation.
P values result from ANOVA for quantitative variables and χ2 test for qualitative variables.
The association between dietary intake of participants according to tertiles of LCD, GI and GL was shown in Table 2. Comparing dietary intakes across GL and GI tertiles, we found that participants in the top tertile had a higher intake of energy, carbohydrate and fibrer compared with those in the bottom tertile. Participants in the highest tertile of LCD had higher intake of carbohydrates, protein and fat intake compared with those in the lowest tertile.
Table 2. Dietary intake of participants according to tertiles of low-carbohydrate diet score, glycaemic index and glycaemic load
(Mean values and standard deviations)

GI, glycaemic index; GL, glycaemic load; LCD, low-carbohydrate diet score; T, tertile.
P values result from ANOVA for quantitative variables.
All values are means ± standard deviation.
Crude and multivariable-adjusted means of anthropometric indicators across tertiles of dietary GI, GL and LCD are shown in Table 3. Neither in crude nor in adjusted models found a significant difference in anthropometric measures and indexes, LAP and VFL index comparing tertiles of dietary GL, GI and LCD. After adjustment for age and energy intake, women in the top tertile of GI and GL tended to have higher LAP compared with those in the bottom tertile. However, the significant association was disappeared after controlling for other potential confounders.
Table 3. Gender-stratified crude and multivariable-adjusted means for anthropometric measures across tertiles of low-carbohydrate diet score, glycaemic index and glycaemic load
(Mean values and standard deviations)

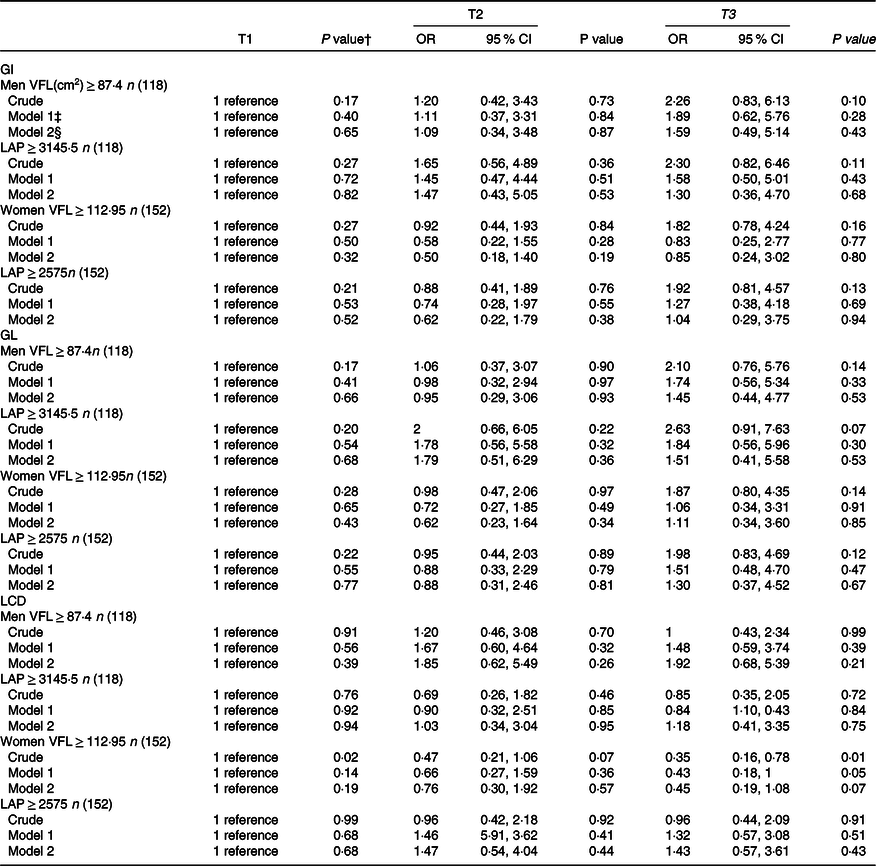
Crude and multivariable-adjusted OR (95 % CI) for LAP and VFL within tertiles of LCD, GI and GL are depicted in Table 4. There was no association between dietary GI and GL and LCD with LAP and VFL index in crude and adjusted models.
Table 4. Crude and multivariable-adjusted OR (95 % CI) for LAP and VFL tertiles of low-carbohydrate diet score, glycaemic index and glycaemic load*
(Odd ratio and 95 % confidence intervals)

GI, glycaemic index; GL, glycaemic load; LCD, low-carbohydrate diet score; LAP, lipid accumulation product; VFL, visceral fat level.
* Data are OR (95 % CI).
† Obtained from logistic regression.
‡ Model I: adjusted for age and energy intake.
§ Model II: additionally adjusted for age and energy intake, education, smoking status, physical activity, occupation, marriage andmetabolic diseases.
Gender-stratified crude and multivariable-adjusted OR and 95 % CI for LAP and VFL across tertiles of dietary GI, GL and LCD are provided in Table 5. There was no significant association between dietary GI and GL and LCD with LAP and VFL index in men. We found a significant association between LCD score and VFL in women in the crude model (OR = 0·35, 95 % CI = 0·16–0·78, P = 0·01). Women in the highest tertile of LCD score compared with those in the lowest tertile had lower chance of a high VFL (≥ 112·95) by 57 % (OR = 0·43, 95 % CI = 0·18–1·00, P = 0·01) when controlled for age and energy intake in model 1. However, this significant association disappeared after controlling for other potential confounders (OR = 0·45, 95 % CI = 0·19, 1·08, P = 0·07).
Table 5. Gender-stratified crude and multivariable-adjusted OR (95 % CI) for LAP and VFL tertiles of low-carbohydrate diet score, glycaemic index and glycaemic load*
(Odd ratio and 95 % confidence intervals)
GI, glycaemic index; GL, glycaemic load; LCD, low-carbohydrate diet score; LAP, lipid accumulation product; VFL, visceral fat level.
* Data are OR (95 % CI).
† Obtained from logistic regression.
‡ Model I: adjusted for age and energy intake.
§ Model II: additionally adjusted for age and energy intake, education, smoking status, physical activity, occupation, marriage and metabolic diseases.
Discussion
In the present study, no significant relationship was observed between GI, GL and LCD with the VFL index after controlling for the potential confounders. Although it should be noted that when we stratified analyses by gender, women in the highest tertile of GL and GI had a significantly higher LAP after controlling for age and energy intake. Furthermore, in women who consumed lower amounts of carbohydrate and higher contents of fat and protein odds of having high VFL reduced by 65 % in crude model. However, after adjusting the potential confounders, this association was no longer significant. In our study, participants in the top tertile of LCD score consumed a smaller percentage of their diet as carbohydrates and a greater amount of protein and fat. The total energy and fibre intake did not differ among the tertiles. Interestingly, in this study, the mean average of carbohydrate intake in the highest tertile (49 %) was still above the definition of LCD (< 45 % of total energy)(Reference Last and Wilson42).
Our study found no significant relationship between LCD score, GI and GL and OR of high LAP and VFL. Previous research concerning these associations in other populations has shown mixed reports. In a cross-sectional study among 209 Iranian women aged 20–50 years, the odds of obesity and cardiovascular risk factors were not associated with different tertiles of LCD score(Reference Jafari-Maram, Daneshzad and Brett43).
In contrast to our results, a large prospective study, which included 48 631 men and women from five countries participating in the European Prospective Investigation into Cancer and Nutrition study, concluded that a diet with low GI may prevent visceral adiposity(Reference Romaguera, Ängquist and Du44). However, in the insulin resistance atherosclerosis study on 979 American adults, GI and GL were not related to measures of insulin sensitivity, BMI, WC and adiposity(Reference Liese, Schulz and Fang45). In another study by Mazidi et al., on American men and women, participated in the cohort of National Health and Nutrition Examination Surveys, it was found that participants who followed a diet high in carbohydrates, sugar, total fat and saturated fat, had a high LAP and VAI levels. In contrast, those who followed a diet high in vitamins, minerals and fibre and had lower LAP and VAI levels(Reference Mazidi, Gao and Kengne46). A Danish cohort study in 185 men and 191 women found that high-GI diets may lead to weight gain, body fat mass and WC were associated with women, but not in me(Reference Hare-Bruun, Flint and Heitmann47).
Discrepancies in findings of studies can be explained as follows: our study population consisted of adults with a normal BMI and WC, while in many of trials concerning the effects of GL and GI on anthropometric measurement, the study population had type 2 diabetes or MetS with higher mean weight, BMI, and probably abnormal body composition(Reference Melanson, Summers and Nguyen48–Reference Brand-Miller, Hayne and Petocz50). Our findings are in line with the fact that Iranians adults receive more than 60 % of their energy from carbohydrates, especially refined grains with a high GI and GL(Reference Kearney51). However, the variance of intake of carbohydrate in this population was not high, which may explain the non-significant results we found in the study. Demographic, cultural and economic differences between different regions and populations can also affect different findings across studies. Inconclusive results among studies may also be due to the age and gender differences. The association of carbohydrate quantity and quality with chronic diseases has been widely published without enough publication stratified by age and gender. It has been reported that GI of sucrose is theoretically 50 % of glucose for all the populations. However, Ishii et al. showed that GI was different in young v. older men in which younger men responded (82 %) better than older men (73·6 %)(Reference Ishii, Shimizu and Ogawa52). In a study by Fan et al.(Reference Fan, Song and Wang53), the results showed a gender modification on the effects of glycaemic index and glycaemic load on cardiovascular risk, with higher risk of CVD in women but not in men. Also, the risk of mortality from strokes increased in women with higher adherence to GI(Reference Takao, Ogawa and Ishii54). In a study by Ishii et al., they also showed that GI of sucrose in young men was not significantly different from the GI of glucose in men, but GI of sucrose in young women was 67·8 % of GI of glucose, and there was a different response according to the age and gender when used substances of distinct structures such as glucose or sucrose(Reference Ishii, Shimizu and Ogawa52). There are gender differences in fat mass and fat free mass throughout life that leads to a difference in energy metabolism and utility of macronutrients(Reference Tarnopolsky55,Reference Wu and O’Sullivan56) , which may be related to sex steroids, differences in insulin resistance or metabolic effects of other hormones such as leptin. In a study by Tarnopolsky et al., it was found that there was a gender differences in absolute and relative carbohydrate intake that can be related to the inability of women to carbohydrate load(Reference Tarnopolsky, Zawada and Richmond57).
To measure adiposity indicators, the gold standard methods like computed tomography scan or MRI and dual-energy X-ray absorptiometry can be used. However, using such examinations in general practice are limited due to being expensive and less availability and need for expertise in medical imaging. In this study we used LAP as a measure of the accumulation of fat mass in the body. Many previous studies have shown that the LAP as a simple, reliable and inexpensive tool was closely related to chronic disease like diabetes, CVD, poly cystic ovarian syndrome, obesity and MetS(Reference Glintborg, Petersen and Ravn58–Reference Er, Wu and Chou60). It also can be used as a reliable indicator of visceral adiposity for early detection of cardiovascular risk in different age groups(Reference Mazidi, Gao and Kengne61,Reference Pires, Tofano and Barbalho62) and populations(Reference Wang, Chen and Sun63,Reference Hosseinpanah, Barzin and Mirbolouk64) . In addition, some studies reported that bioimpedance analysis has enough reliability to show adipose tissue distribution and to monitor visceral fat(Reference Gao, Liu and Ding65–Reference Andreoli, Melchiorri and De Lorenzo67). However, it was not confirmed in other studies.
This study is one of the few studies in developing countries investigating the relationship between GI, GL and LCD with LAP and VFL index. We also applied body composition analysis and measured two newly developed indicators of visceral fat accumulation rather only classical anthropometric indexes. Another strength of this study is controlling for a wide range of potential confounders to achieve an independent association. Valid questionnaires have been also used to collect data that can support the accuracy of the findings. However, despite the strengths of our study, some limitations need to be considered. First, due to the cross-sectional nature of the present study, causal relationships between GI, GL and LCD cannot be inferred from LAP and VFL. Like all epidemiological studies, participants’ incorrect classification due to FFQ use is inevitable. However, we tried to improve some of the wrong classifications by using trained nutritionists to collect the relevant data. Despite the modification of several confounders, the potential effects of residual confounders cannot be ruled out. In addition, our findings from representative sample of Tehran are only generalisable to Tehranian population and may be not be generalised to the Iranian population. We also did not use the gold standard methods to measure VFL and did not compare the result of LAP index with actual physical measurements of visceral adiposity by dual-energy X-ray absorptiometry, MRI or computed tomography scan. Moreover, people in Middle East countries like Iran consume higher intake of their energy from carbohydrate, and then a modified version of LCD score with a new range is needed to investigate associations.
Conclusion
Our finding suggests that carbohydrate quality indexes and LCD score are not associated with LAP and VFL index. However, women with a high adherence to LCD tended to have lower VFL. Further well-designed studies are required to confirm these findings.
Acknowledgements
This paper is a part of the master thesis of Fatemeh Gholami. Special thanks go to all those who participated in this study.
This study has been granted by Tehran University of Medical Sciences (Grant No: 33 887).
S. S. B. contributed to conception/design of the research; N. B. and S. D. contributed to acquisition of data. F. G., F. M. and A.M. participated in the analysis and interpretation of the data; F. G., M. E. and P. G. drafted the manuscript; K. D., S. S. B. and F. M. critically revised the manuscript and S. S. B. agrees to be fully accountable for ensuring the integrity and accuracy of the work. All authors read and approved the final manuscript.
All authors hereby declare that they have no conflict of interest.


